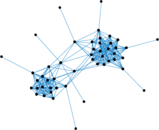
Internet topology
This is the network of connections between autonomous systems of the Internet.
The nodes are autonomous systems (AS), i.e. collections of connected IP routing
prefixes controlled by independent network operators. Edges are connections
between autonomous systems. Multiple edges may connect two nodes, each
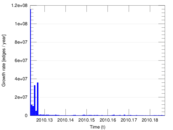
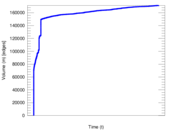
representing an individual connection in time. Edges are annotated with the
timepoint of the connection.
Metadata
Statistics
| Size | n = | 34,761
|
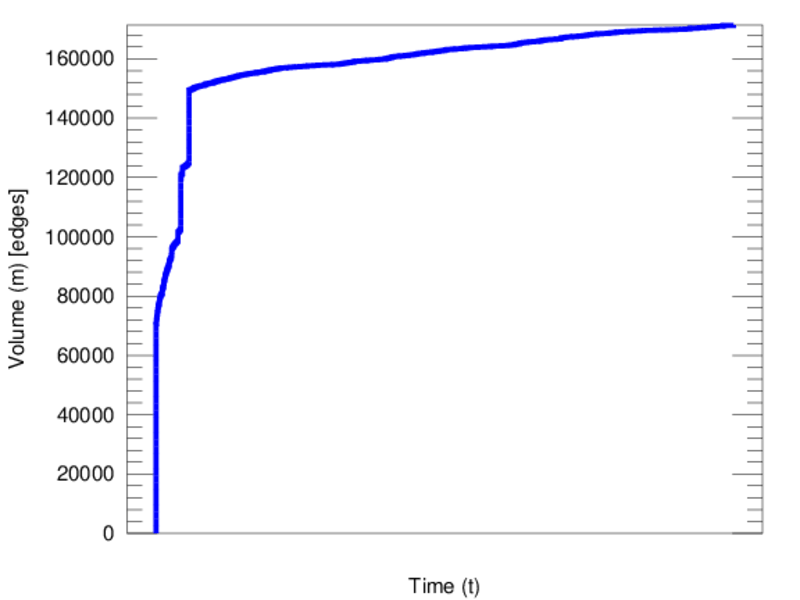
| Volume | m = | 171,403
|
| Unique edge count | m̿ = | 114,496
|
| Loop count | l = | 0
|
| Wedge count | s = | 34,304,301
|
| Claw count | z = | 20,603,857,222
|
| Cross count | x = | 10,997,020,148,941
|
| Triangle count | t = | 554,749
|
| Square count | q = | 79,912,964
|
| 4-Tour count | T4 = | 776,736,356
|
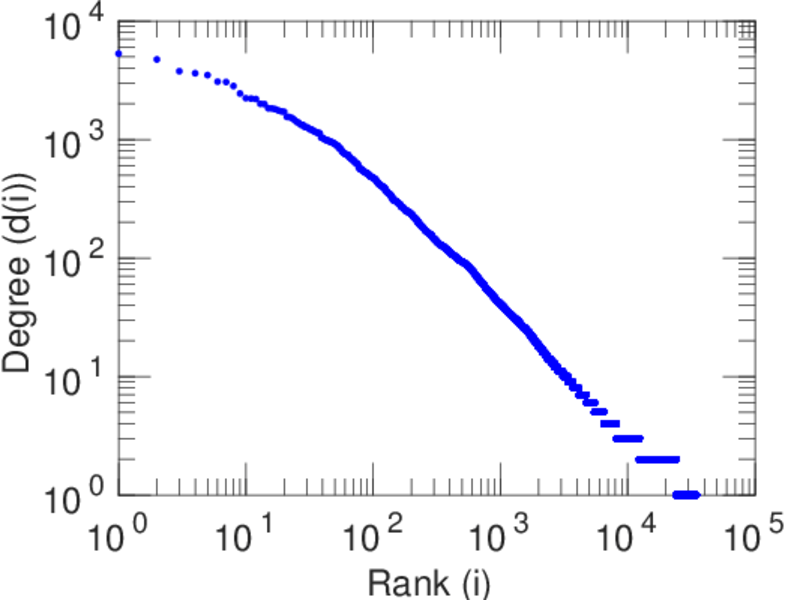
| Maximum degree | dmax = | 5,305
|
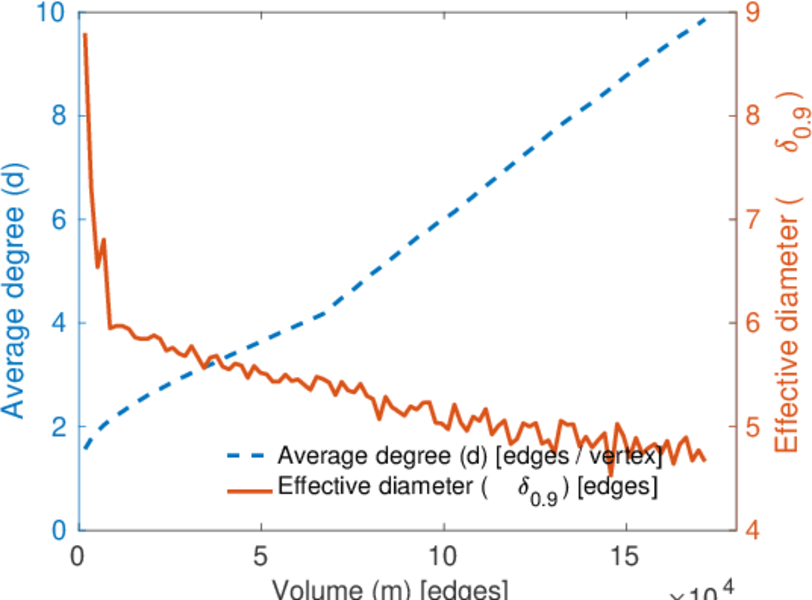
| Average degree | d = | 9.861 80
|
| Fill | p = | 0.000 189 517
|
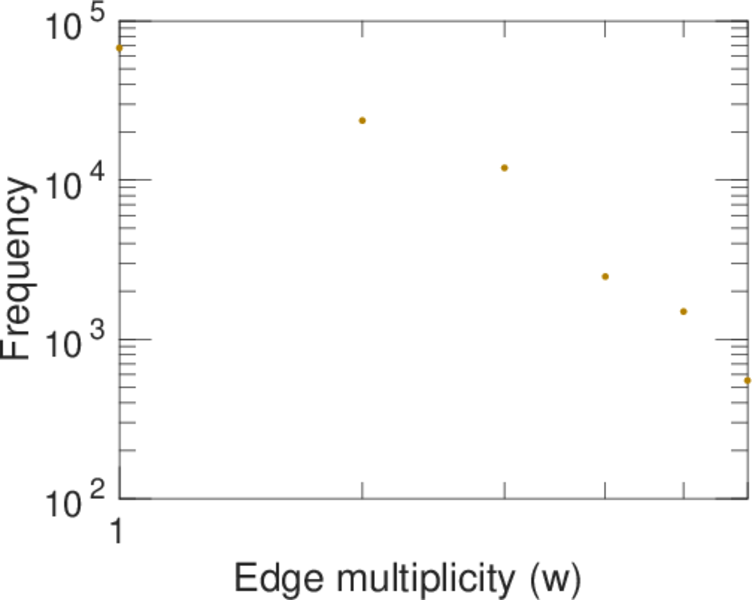
| Average edge multiplicity | m̃ = | 1.497 02
|
| Size of LCC | N = | 34,761
|
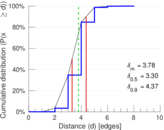
| Diameter | δ = | 10
|
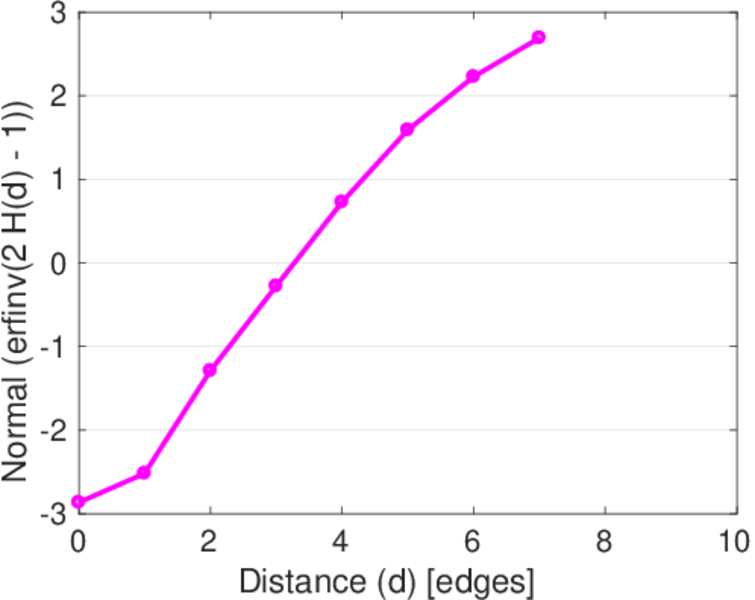
| 50-Percentile effective diameter | δ0.5 = | 3.304 83
|
| 90-Percentile effective diameter | δ0.9 = | 4.372 41
|
| Median distance | δM = | 4
|
| Mean distance | δm = | 3.783 62
|
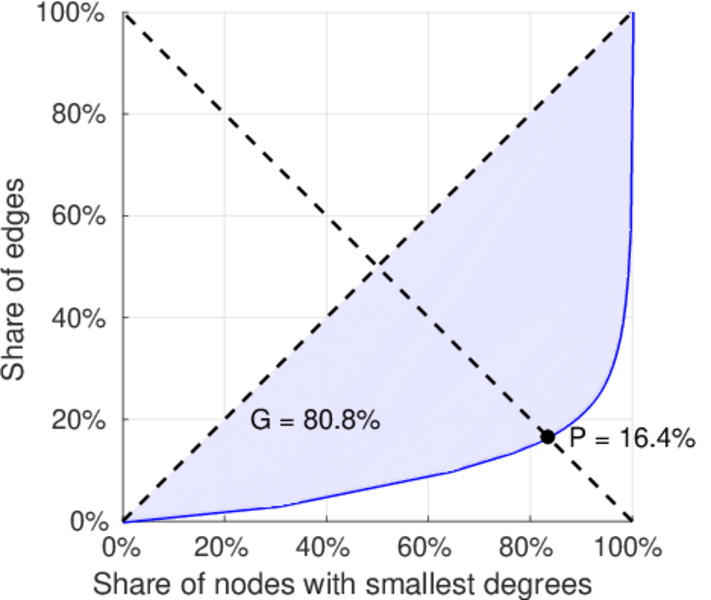
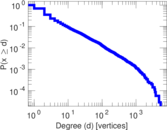
| Gini coefficient | G = | 0.808 028
|
| Balanced inequality ratio | P = | 0.164 131
|
| Relative edge distribution entropy | Her = | 0.807 662
|
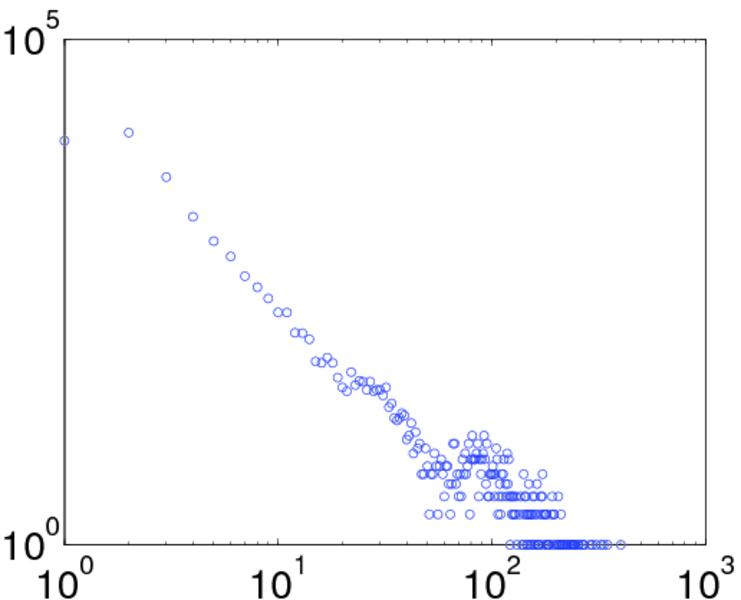
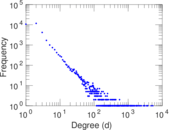
| Power law exponent | γ = | 2.233 38
|
| Tail power law exponent | γt = | 1.921 00
|
| Tail power law exponent with p | γ3 = | 1.921 00
|
| p-value | p = | 0.000 00
|
| Degree assortativity | ρ = | −0.214 867
|
| Degree assortativity p-value | pρ = | 0.000 00
|
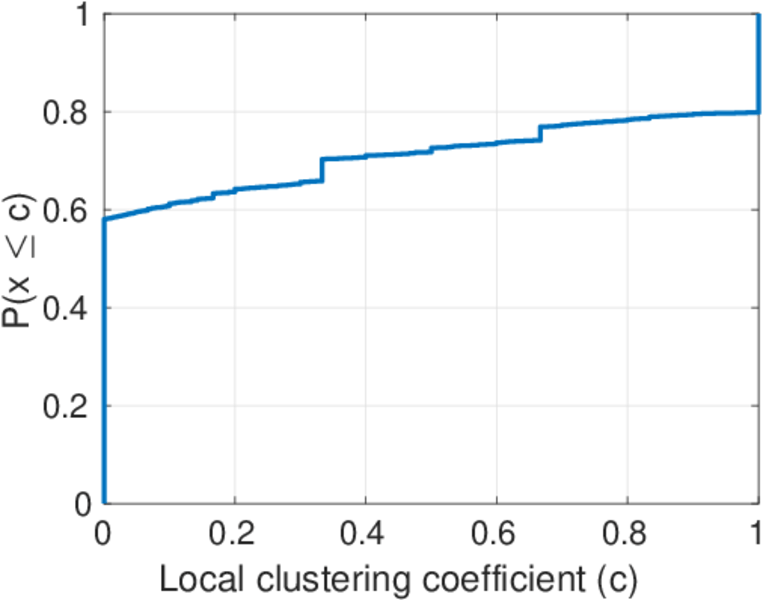
| Clustering coefficient | c = | 0.048 514 2
|
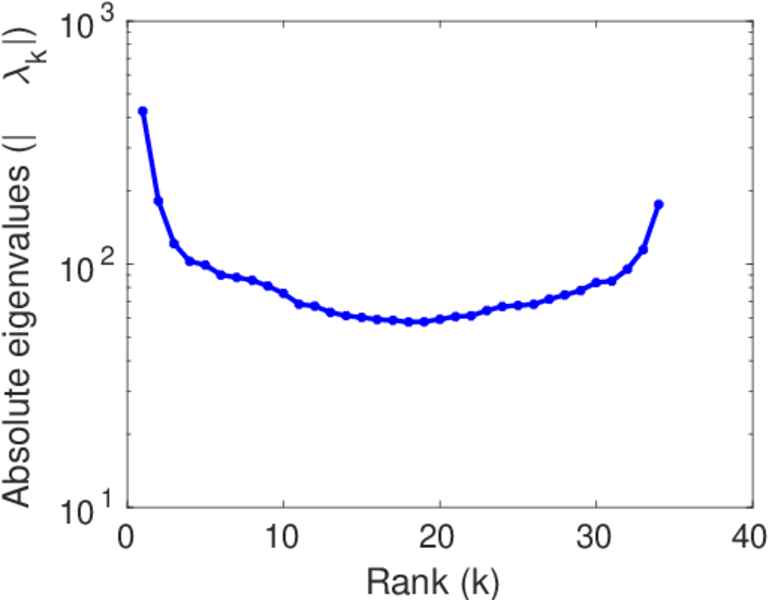
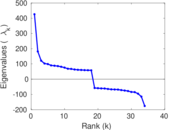
| Spectral norm | α = | 425.817
|
| Algebraic connectivity | a = | 0.044 087 6
|
| Spectral separation | |λ1[A] / λ2[A]| = | 2.341 89
|
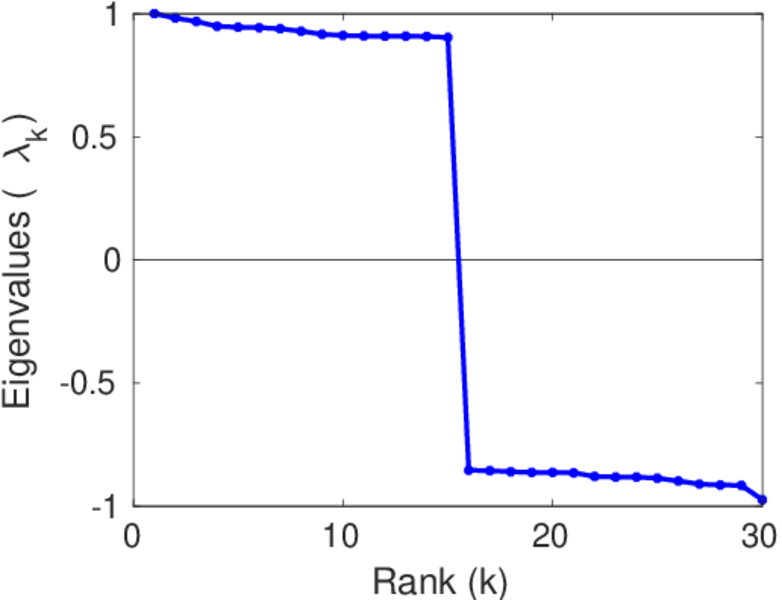
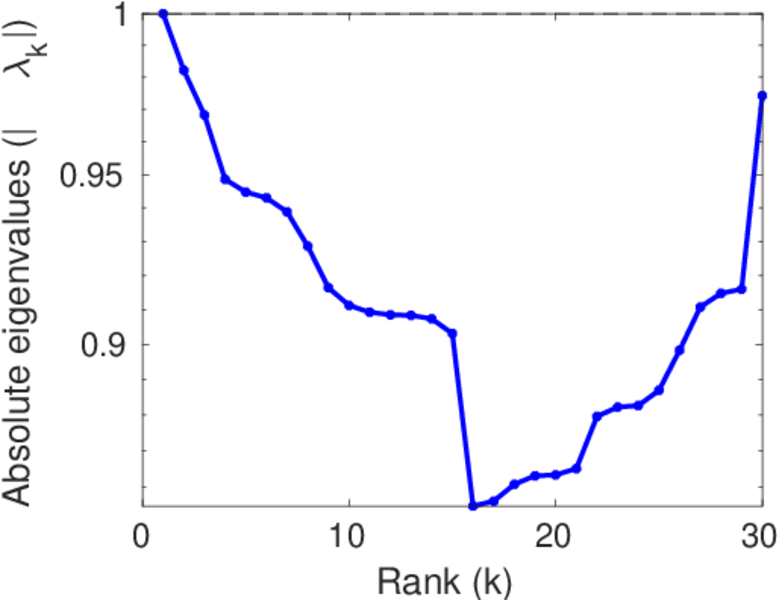
| Non-bipartivity | bA = | 0.586 838
|
| Normalized non-bipartivity | bN = | 0.016 724 9
|
| Algebraic non-bipartivity | χ = | 0.032 772 5
|
| Spectral bipartite frustration | bK = | 0.001 321 95
|
| Controllability | C = | 24,439
|
| Relative controllability | Cr = | 0.703 058
|
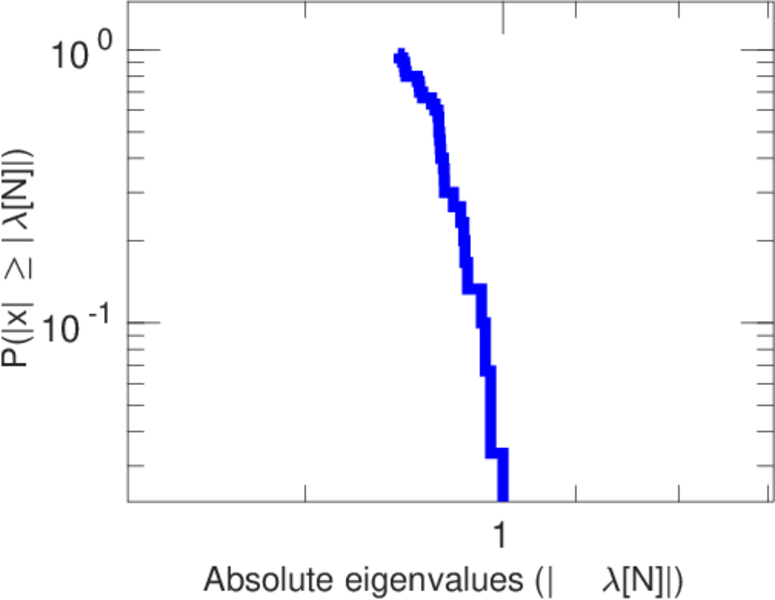
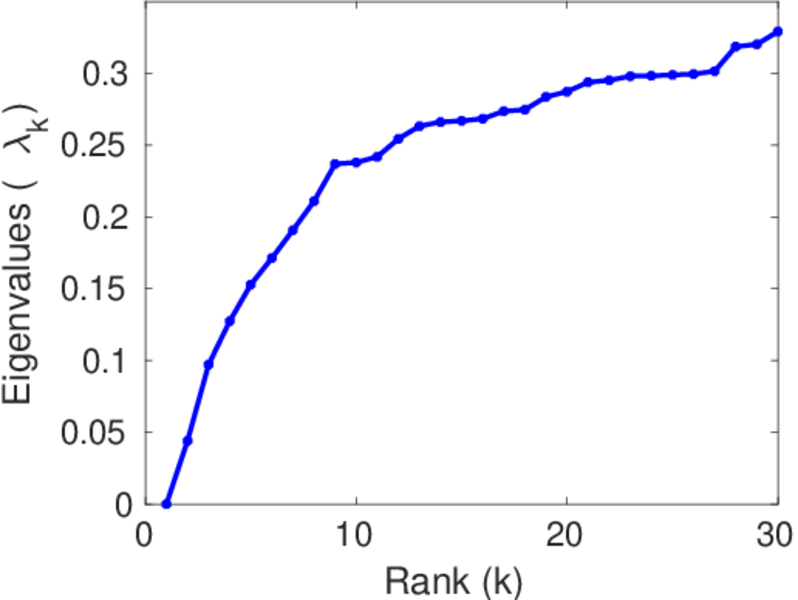
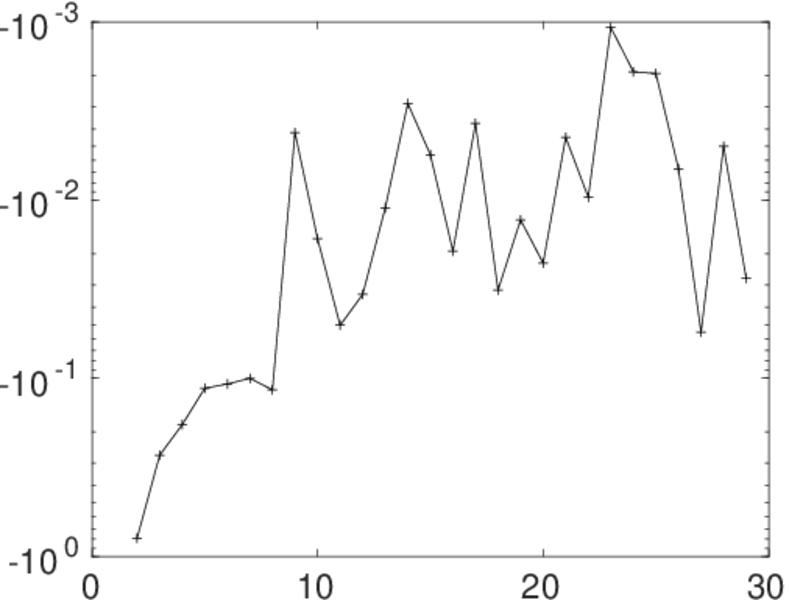
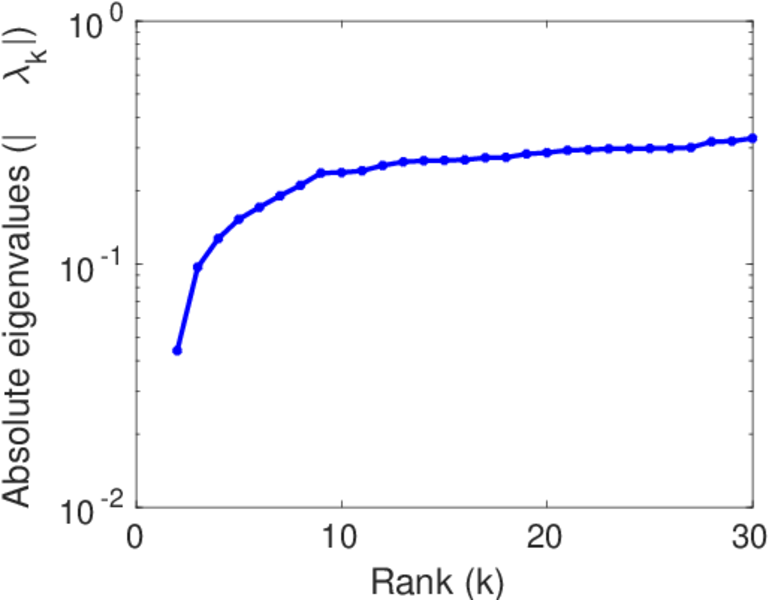
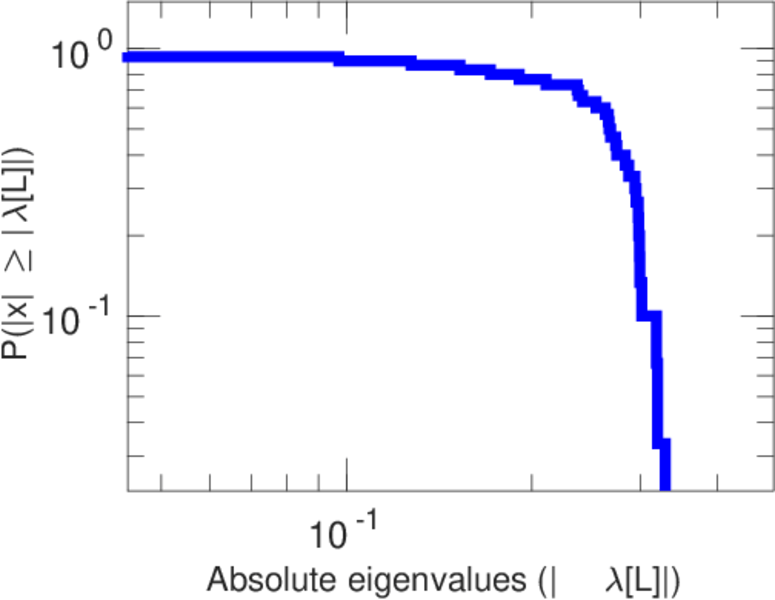
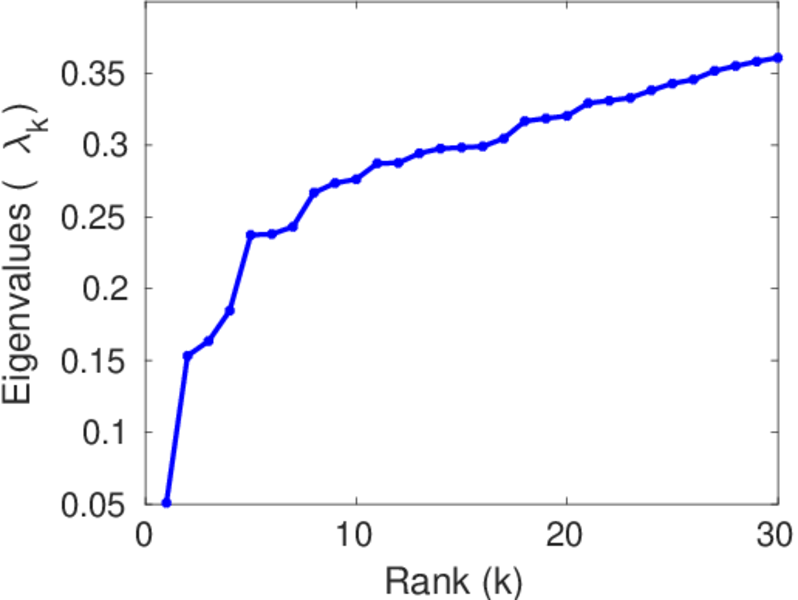
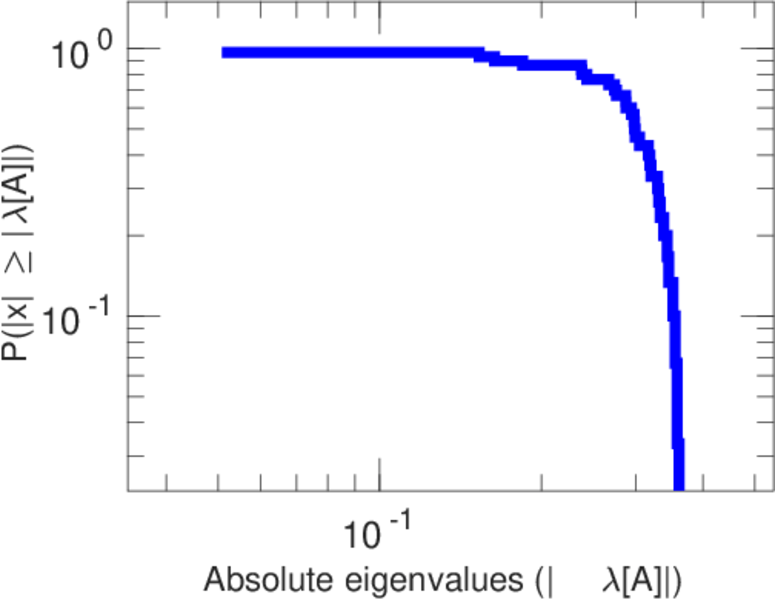
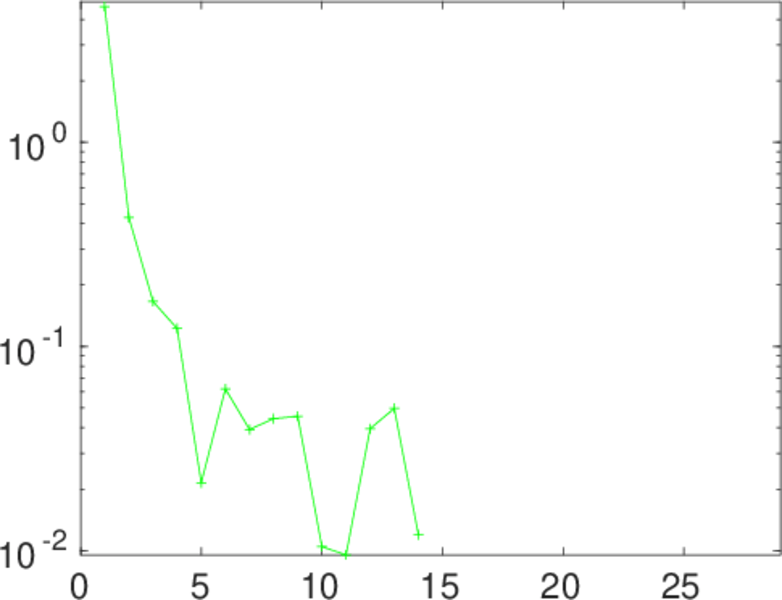
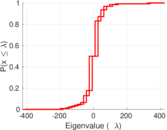
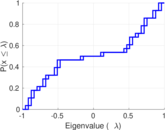
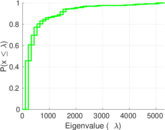
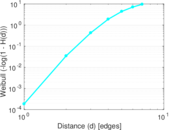
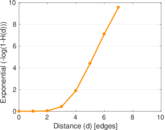
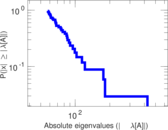
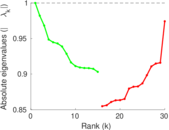
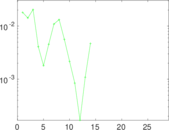
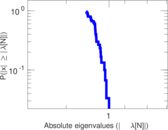
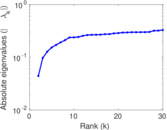
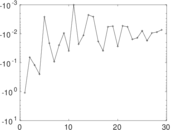
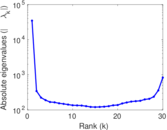
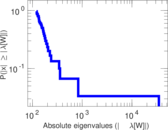
Plots


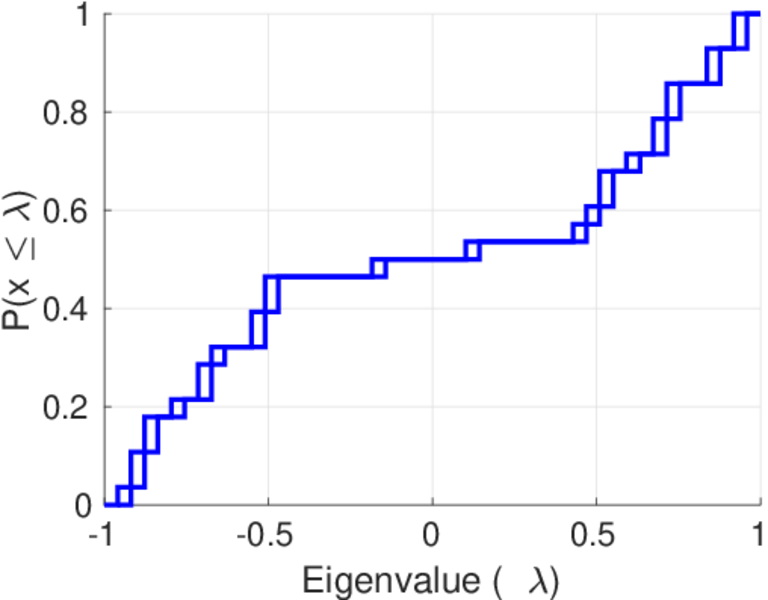
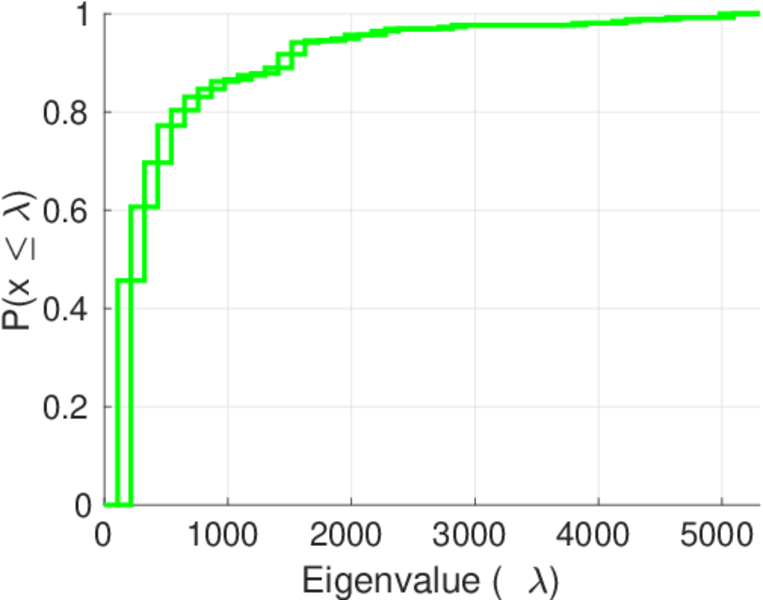
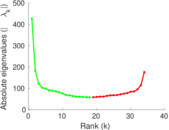
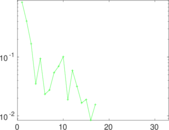
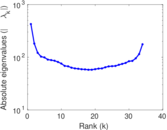
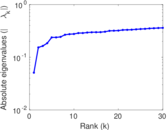
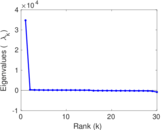
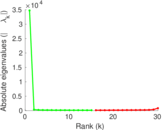
Matrix decompositions plots


Downloads
References
|
[1]
|
Jérôme Kunegis.
KONECT – The Koblenz Network Collection.
In Proc. Int. Conf. on World Wide Web Companion, pages
1343–1350, 2013.
[ http ]
|
|
[2]
|
Beichuan Zhang, Raymond Liu, Daniel Massey, and Lixia Zhang.
Collecting the Internet AS-level topology.
SIGCOMM Comput. Communication Review, 35(1):53–61, 2005.
|
 KONECT ‣ Networks ‣
Buy Me a Coffee
KONECT ‣ Networks ‣
Buy Me a Coffee