Wikipedia talk (bn)
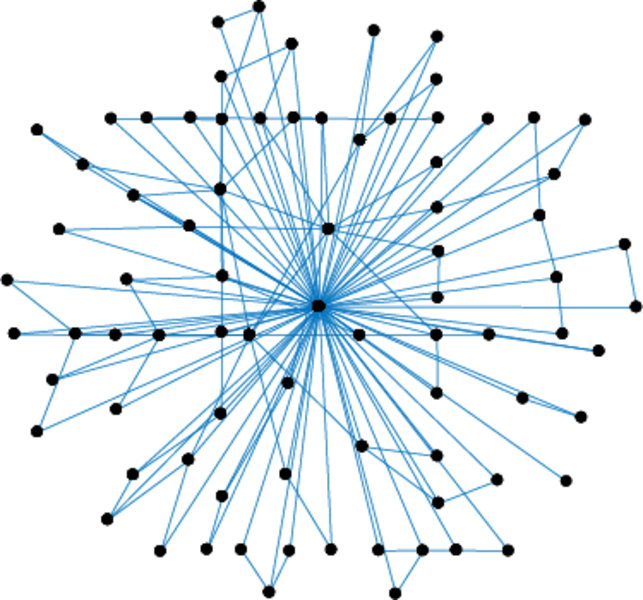
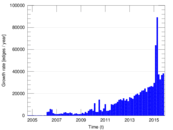
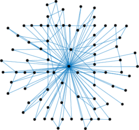
This is the communication network of the Bangla Wikipedia. Nodes represent
users, and an edge from user A to user B denotes that user A wrote a message on
the talk page of user B at a certain timestamp.
Metadata
Statistics
| Size | n = | 83,803
|
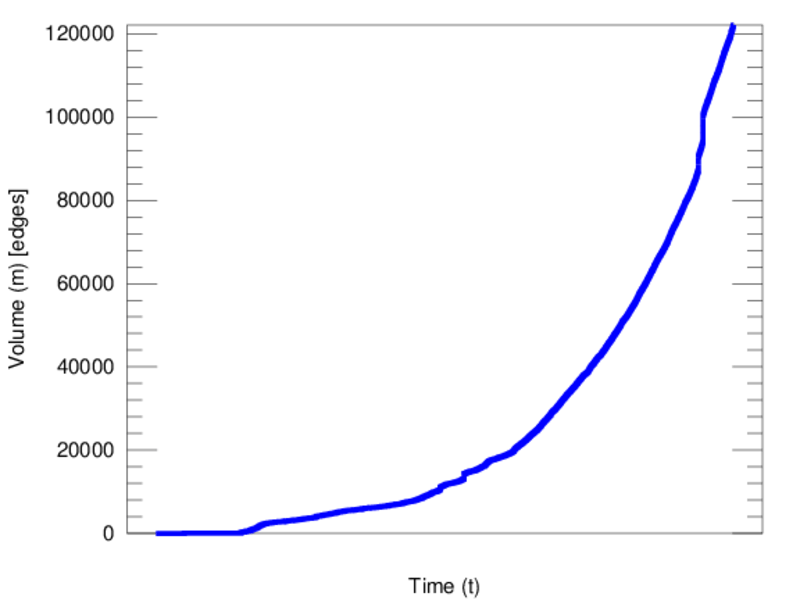
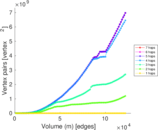
| Volume | m = | 122,078
|
| Unique edge count | m̿ = | 99,789
|
| Loop count | l = | 7,810
|
| Wedge count | s = | 607,190,714
|
| Claw count | z = | 3,752,050,222,613
|
| Cross count | x = | 19,040,630,407,127,920
|
| Triangle count | t = | 14,552
|
| Square count | q = | 7,409,430
|
| 4-Tour count | T4 = | 2,488,232,542
|
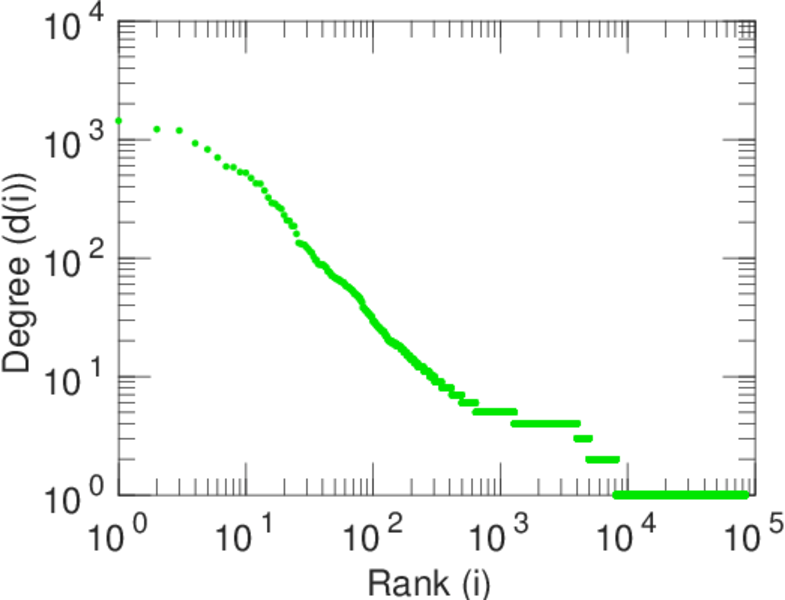
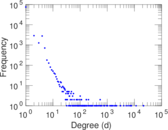
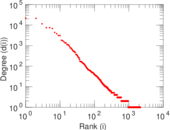
| Maximum degree | dmax = | 21,778
|
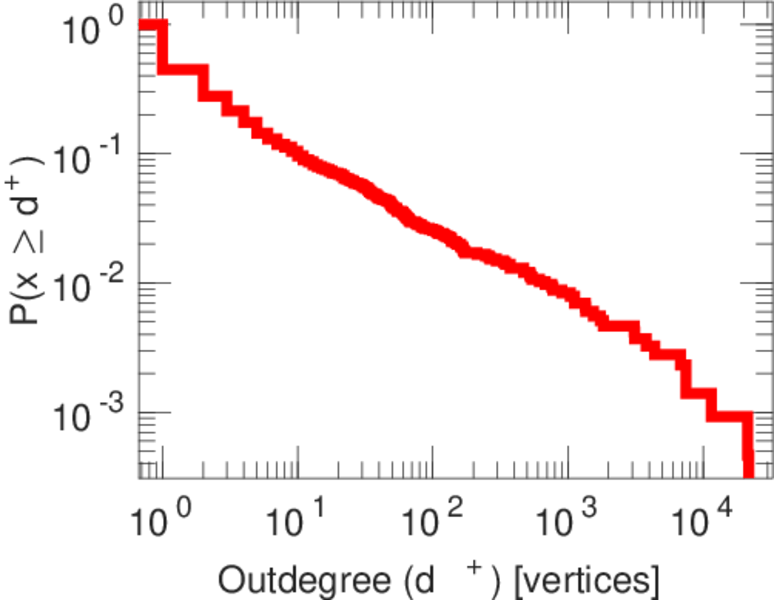
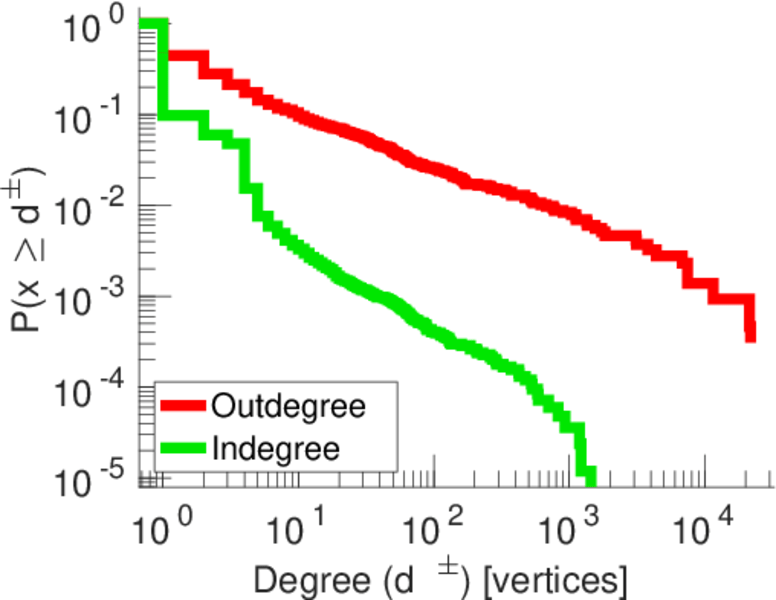
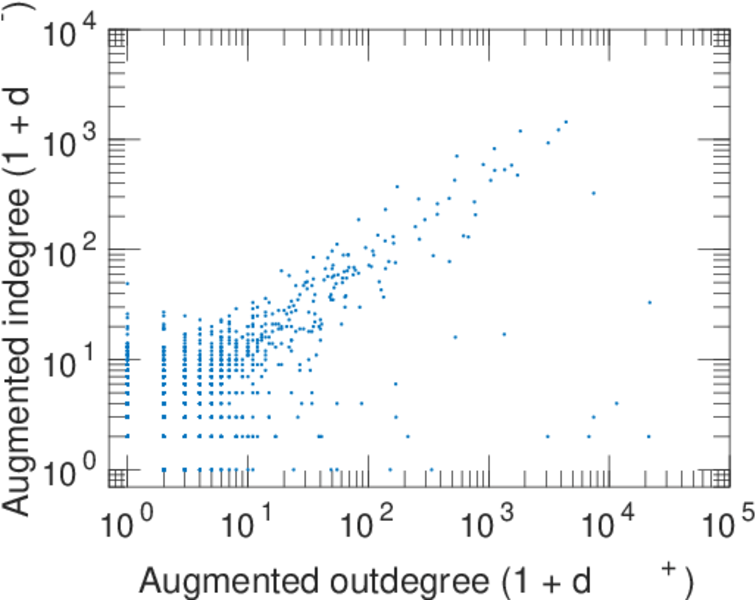
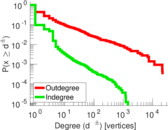
| Maximum outdegree | d+max = | 21,746
|
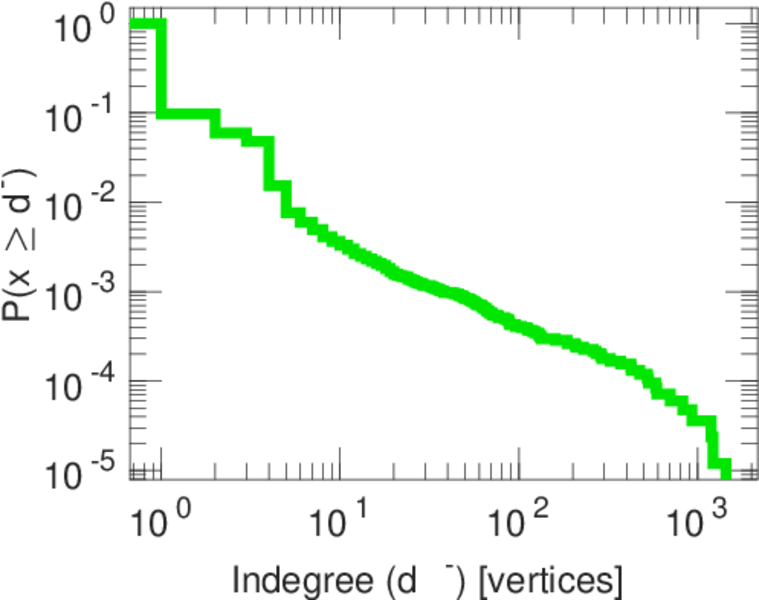
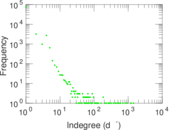
| Maximum indegree | d−max = | 1,440
|
| Average degree | d = | 2.913 45
|
| Fill | p = | 1.420 90 × 10−5
|
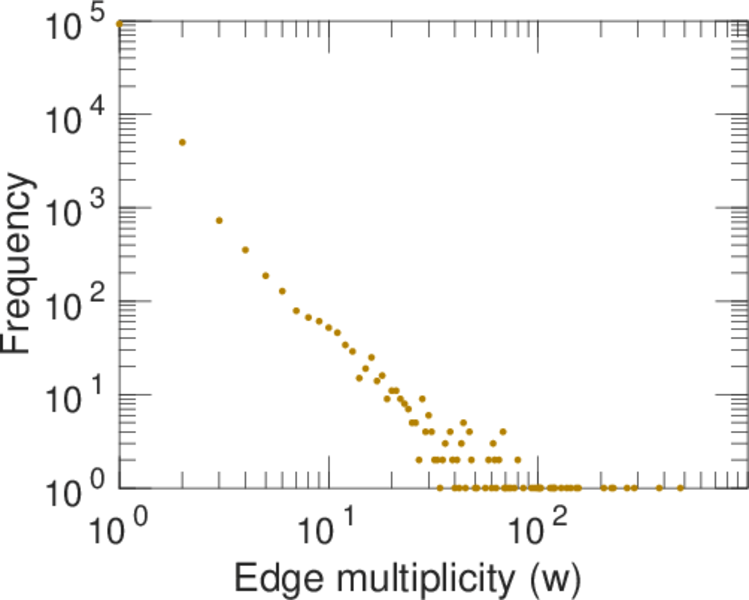
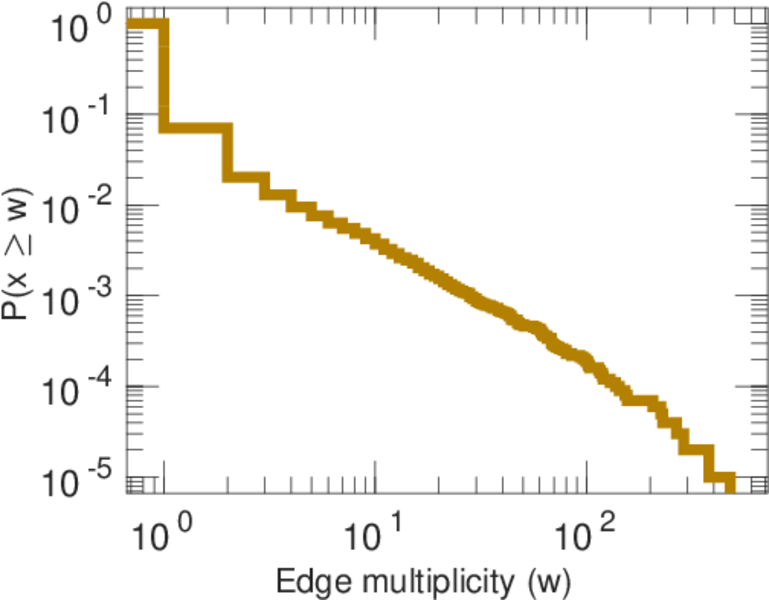
| Average edge multiplicity | m̃ = | 1.223 36
|
| Size of LCC | N = | 83,521
|
| Size of LSCC | Ns = | 700
|
| Relative size of LSCC | Nrs = | 0.008 352 92
|
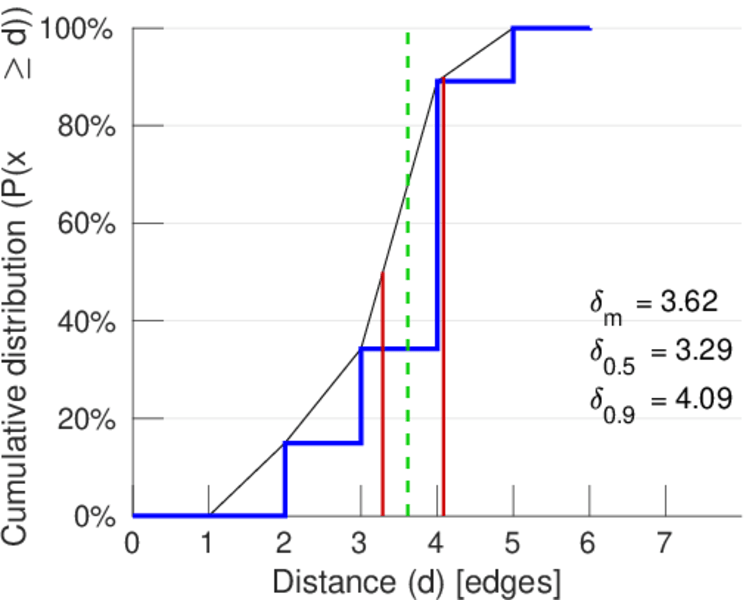
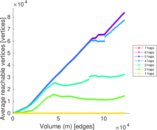
| Diameter | δ = | 7
|
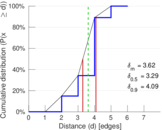
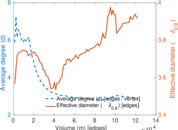
| 50-Percentile effective diameter | δ0.5 = | 3.286 95
|
| 90-Percentile effective diameter | δ0.9 = | 4.085 39
|
| Median distance | δM = | 4
|
| Mean distance | δm = | 3.617 18
|
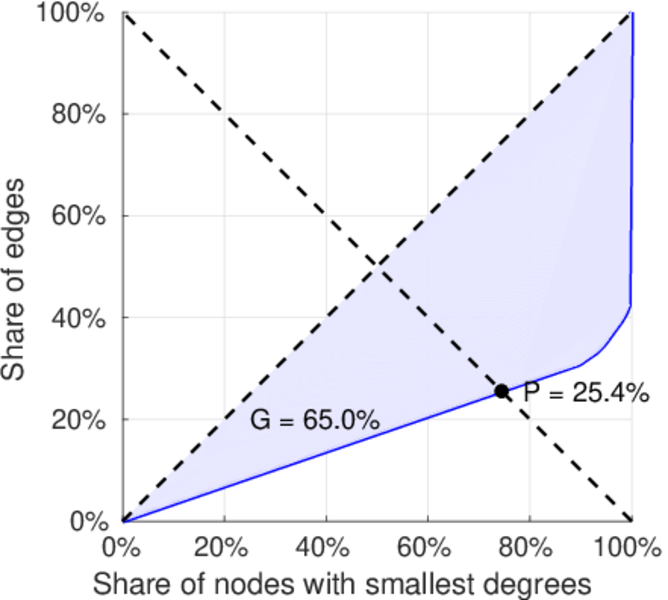
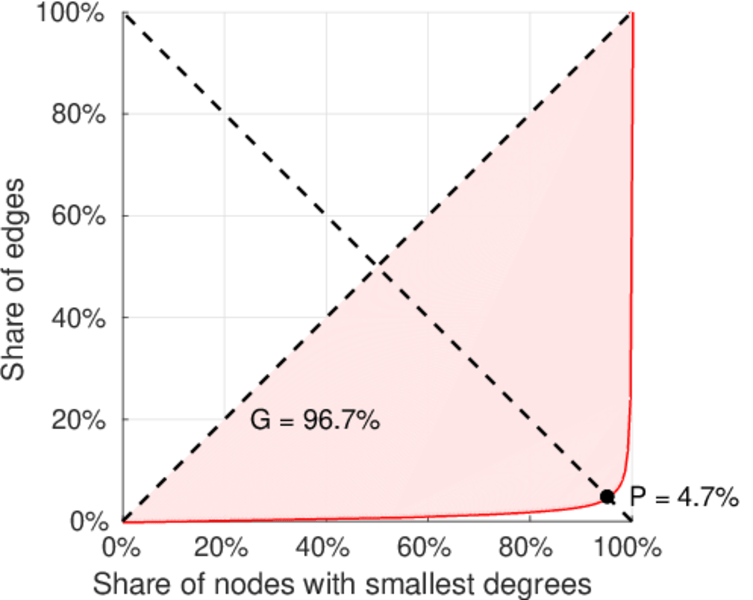
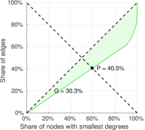
| Gini coefficient | G = | 0.650 115
|
| Balanced inequality ratio | P = | 0.253 993
|
| Outdegree balanced inequality ratio | P+ = | 0.046 879 9
|
| Indegree balanced inequality ratio | P− = | 0.404 651
|
| Relative edge distribution entropy | Her = | 0.676 965
|
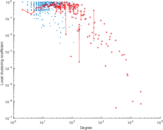
| Power law exponent | γ = | 11.294 7
|
| Tail power law exponent | γt = | 3.531 00
|
| Tail power law exponent with p | γ3 = | 3.531 00
|
| p-value | p = | 0.000 00
|
| Outdegree tail power law exponent with p | γ3,o = | 1.491 00
|
| Outdegree p-value | po = | 0.173 000
|
| Indegree tail power law exponent with p | γ3,i = | 3.601 00
|
| Indegree p-value | pi = | 0.000 00
|
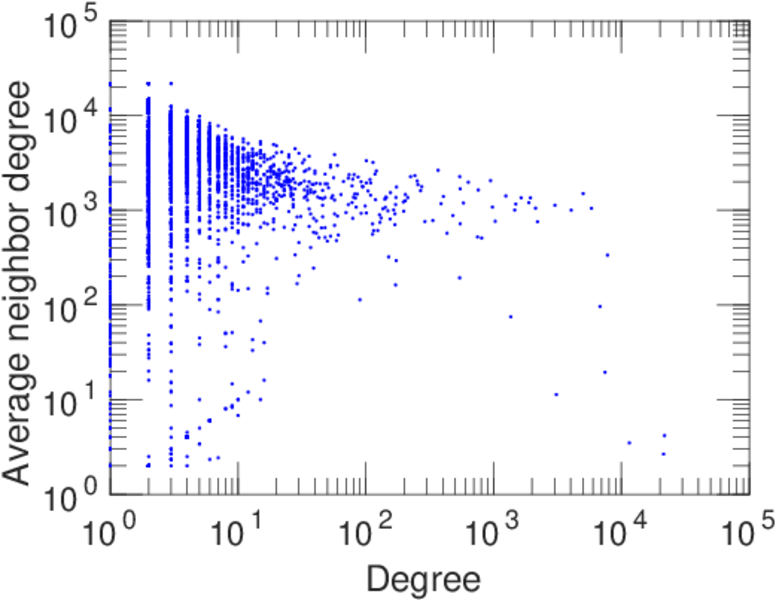
| Degree assortativity | ρ = | −0.510 017
|
| Degree assortativity p-value | pρ = | 0.000 00
|
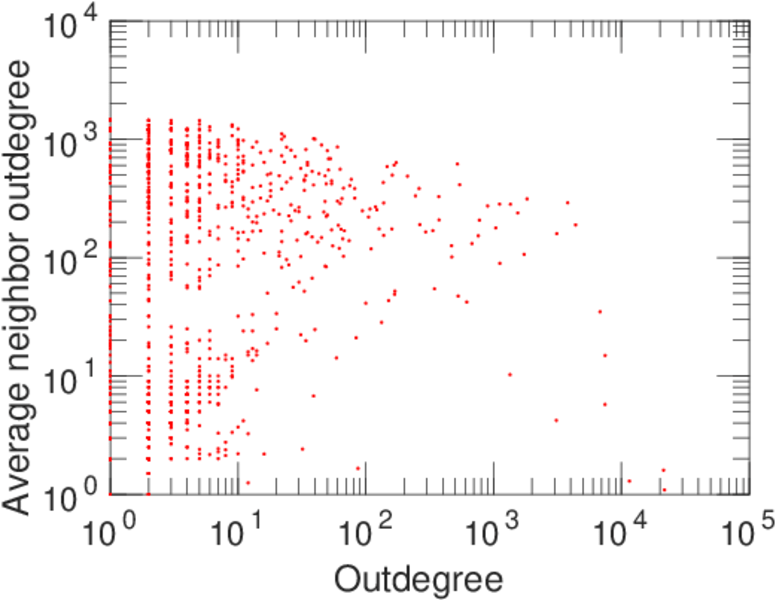
| In/outdegree correlation | ρ± = | +0.566 989
|
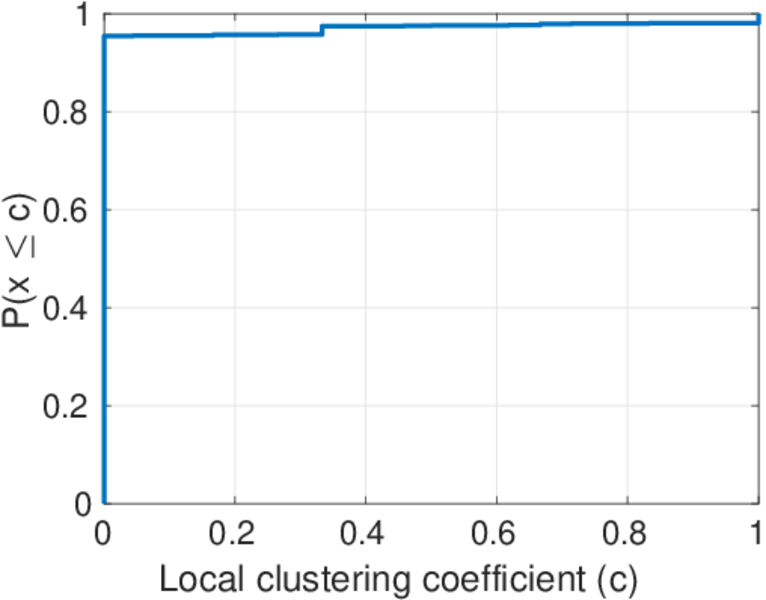
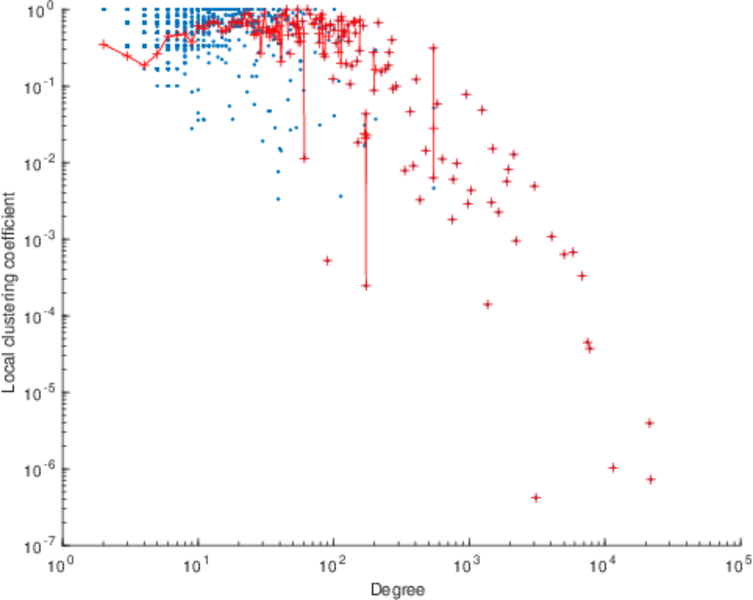
| Clustering coefficient | c = | 7.189 83 × 10−5
|
| Directed clustering coefficient | c± = | 0.011 875 9
|
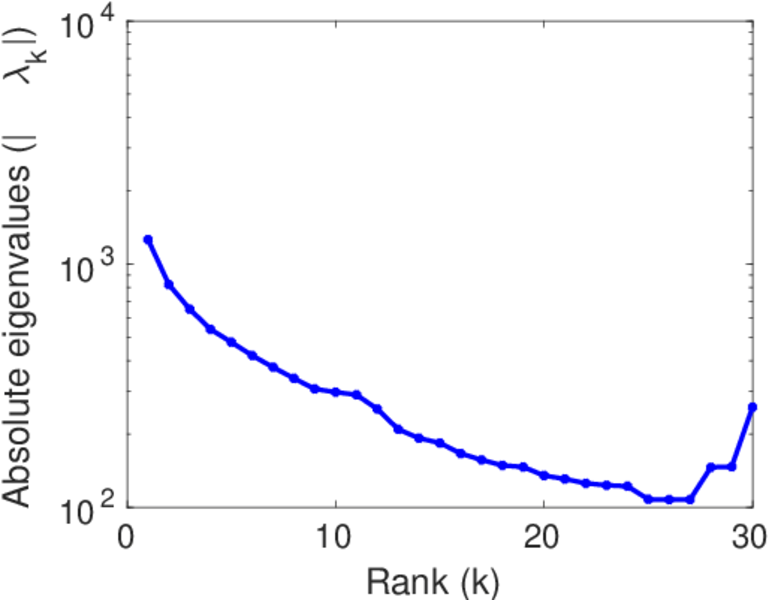
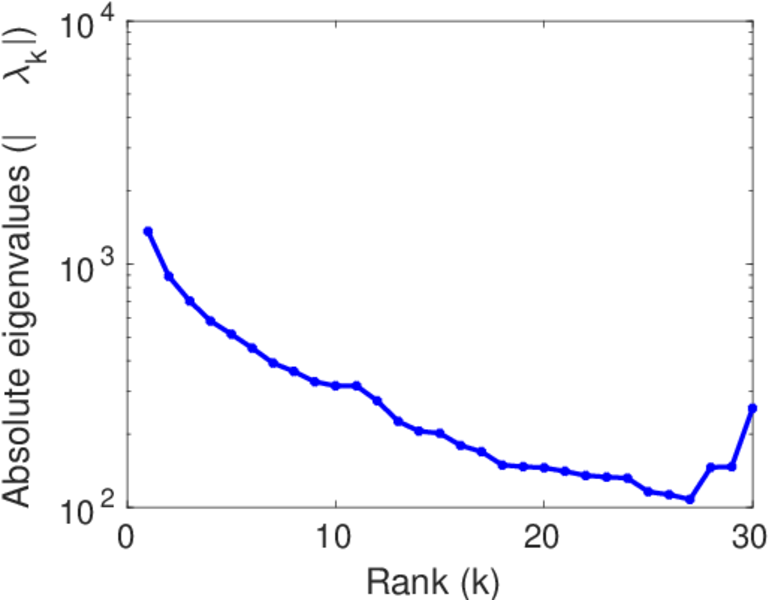
| Spectral norm | α = | 1,262.02
|
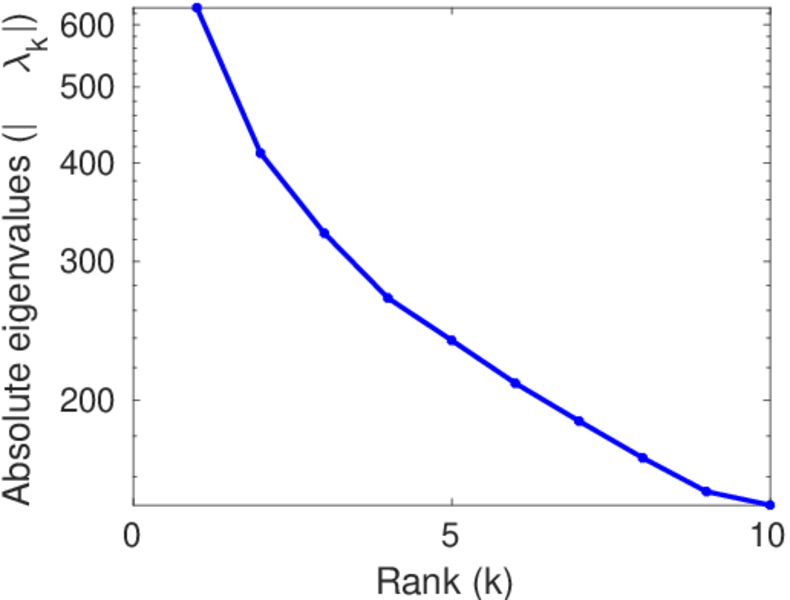
| Operator 2-norm | ν = | 640.447
|
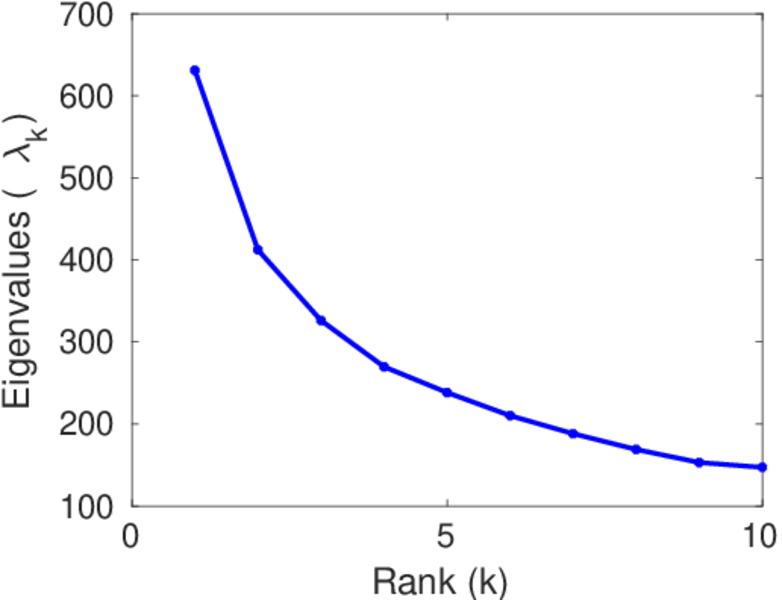
| Cyclic eigenvalue | π = | 616.099
|
| Algebraic connectivity | a = | 0.018 549 5
|
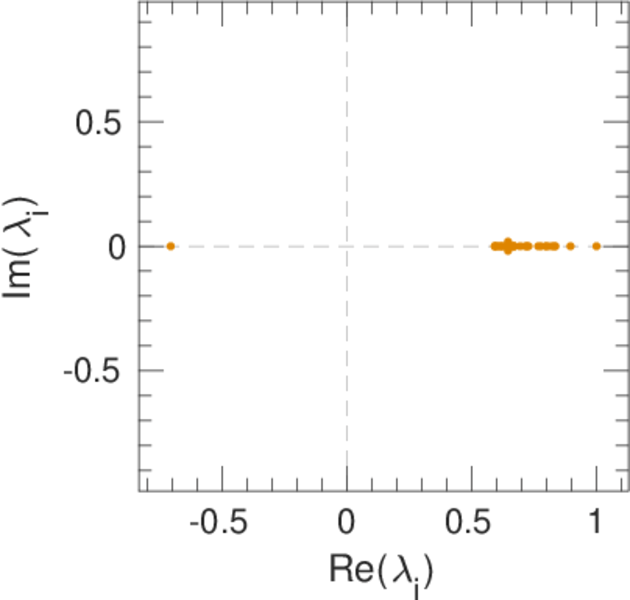
| Spectral separation | |λ1[A] / λ2[A]| = | 1.531 08
|
| Reciprocity | y = | 0.037 529 2
|
| Non-bipartivity | bA = | 0.795 504
|
| Normalized non-bipartivity | bN = | 0.011 150 6
|
| Algebraic non-bipartivity | χ = | 0.024 876 4
|
| Spectral bipartite frustration | bK = | 0.002 638 66
|
| Controllability | C = | 82,034
|
| Relative controllability | Cr = | 0.978 891
|
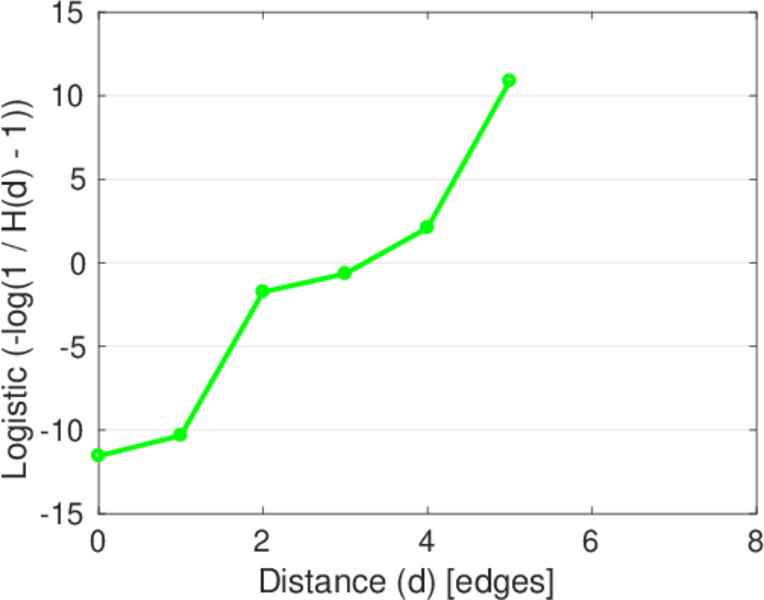
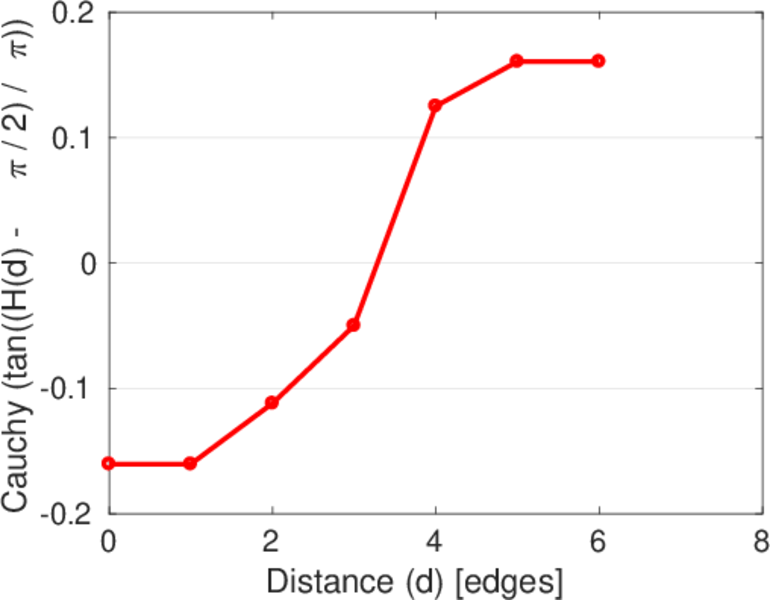
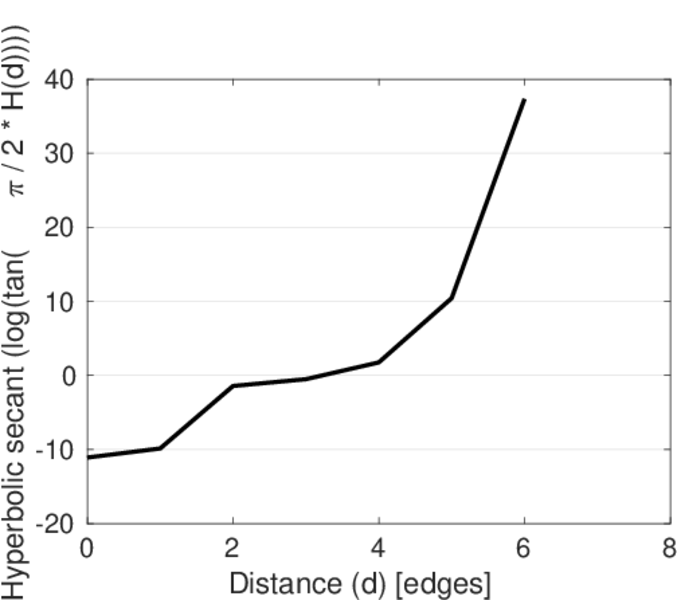
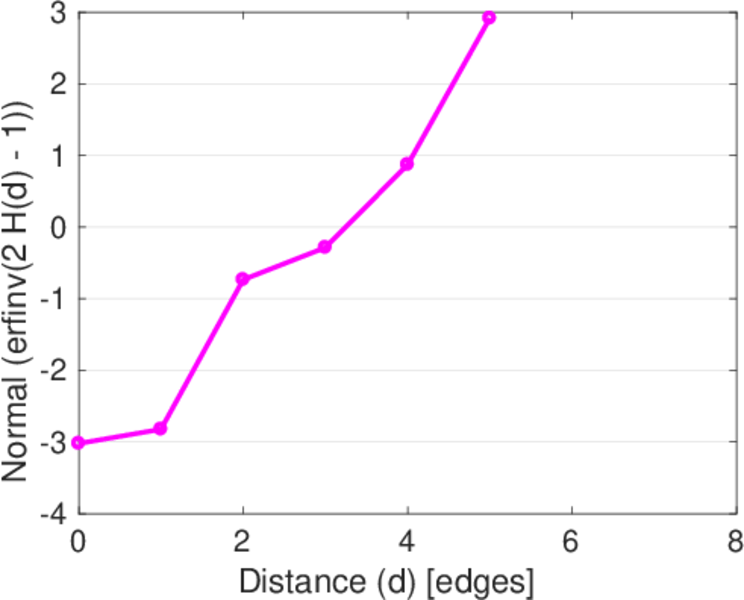
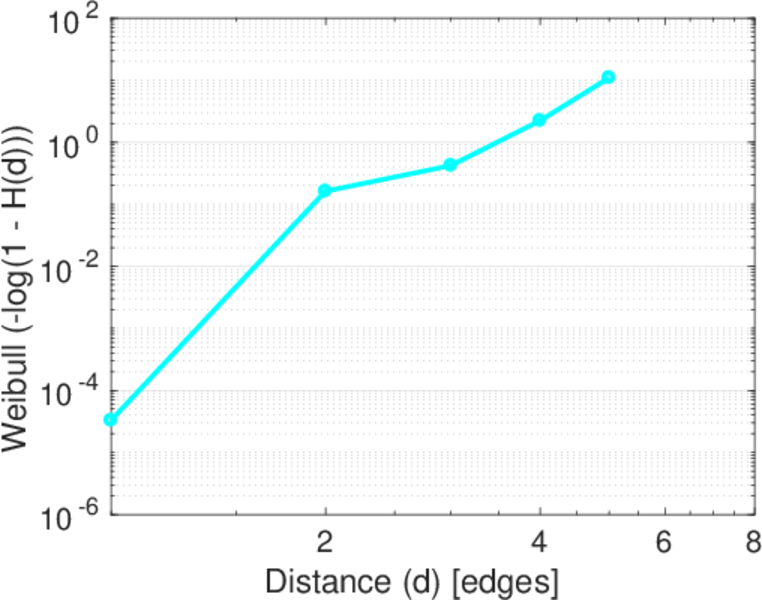
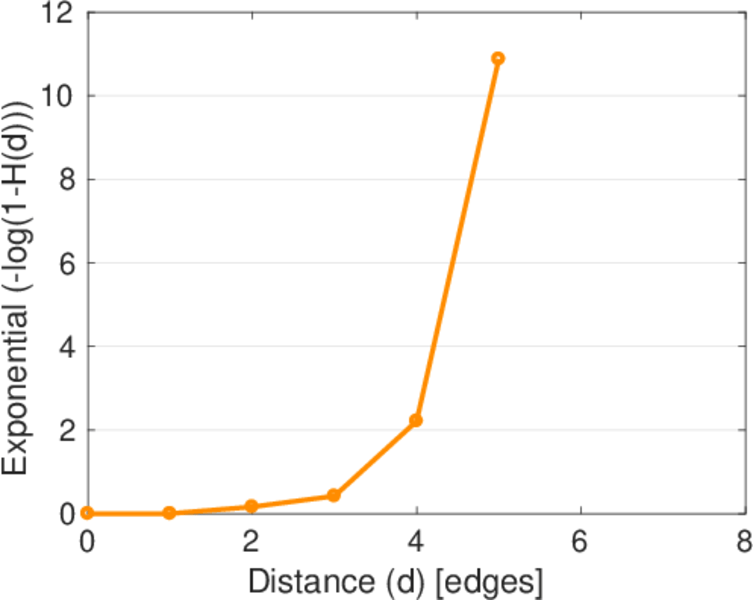
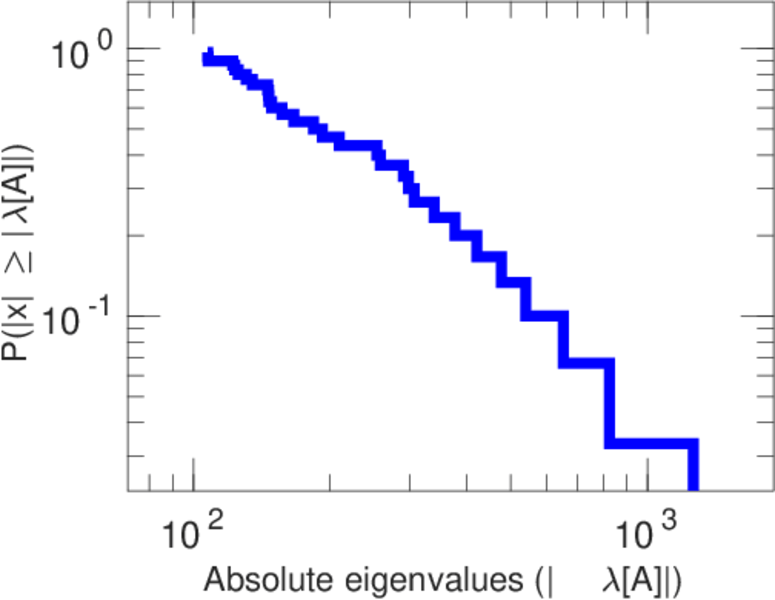
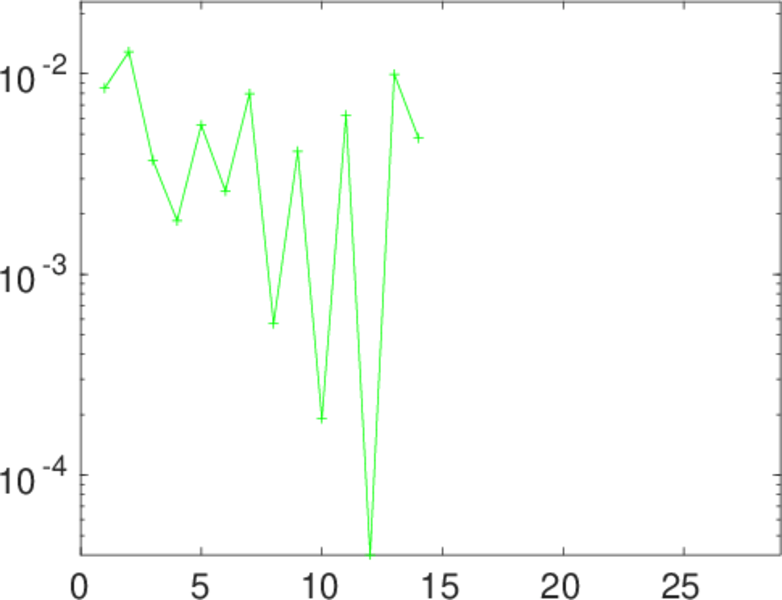
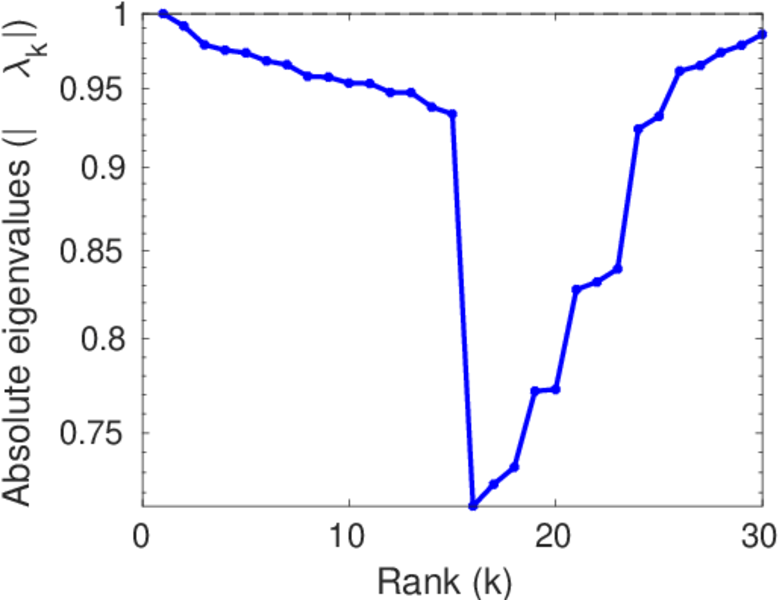
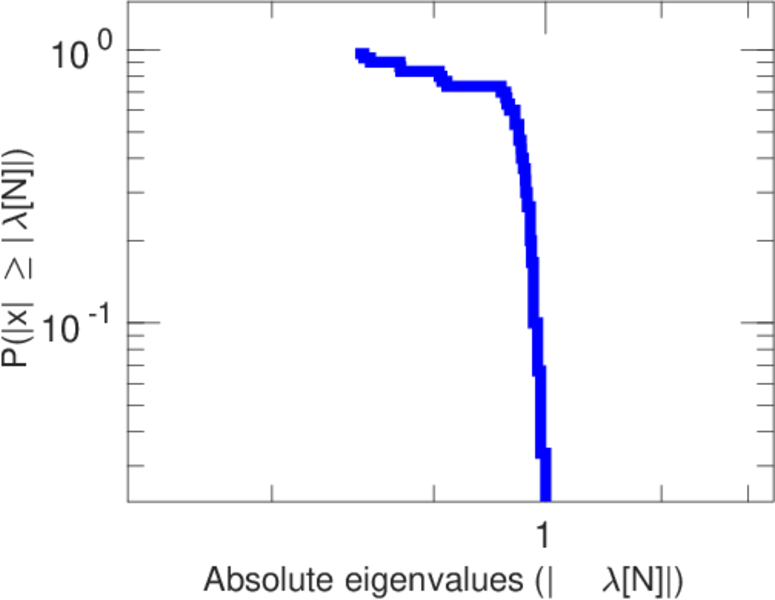
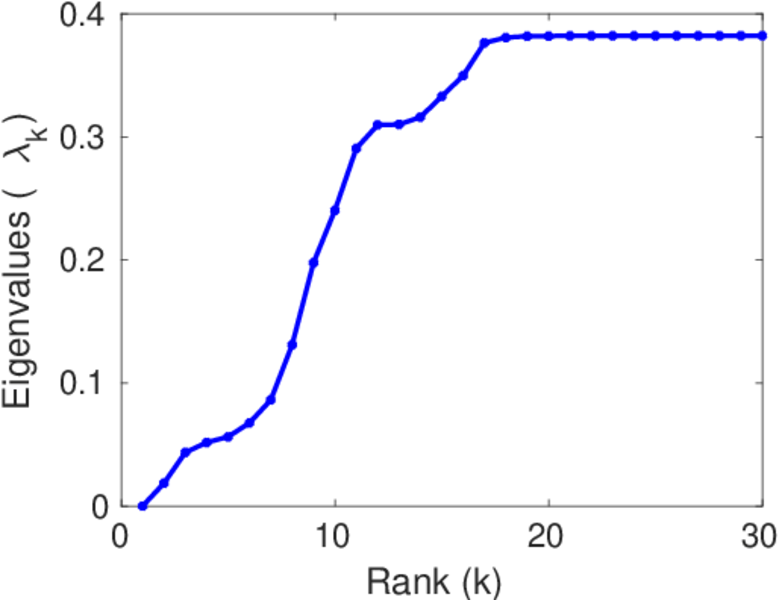
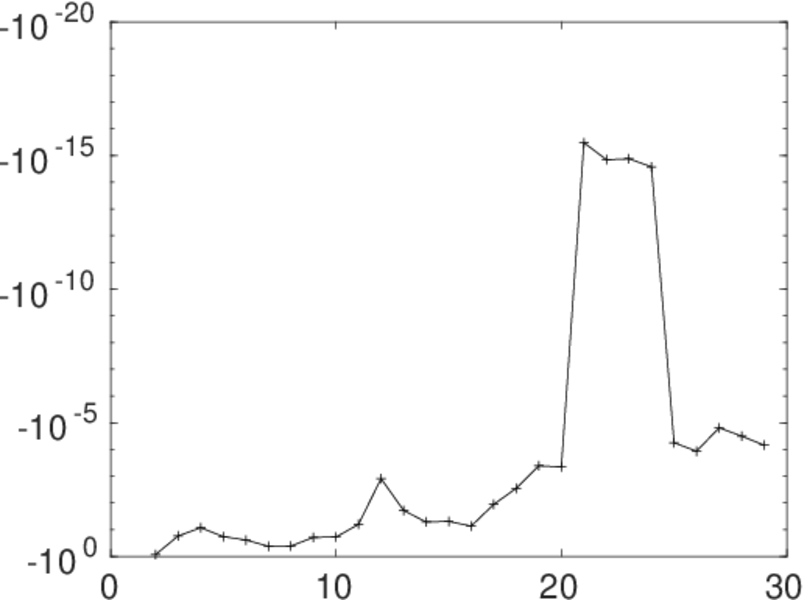
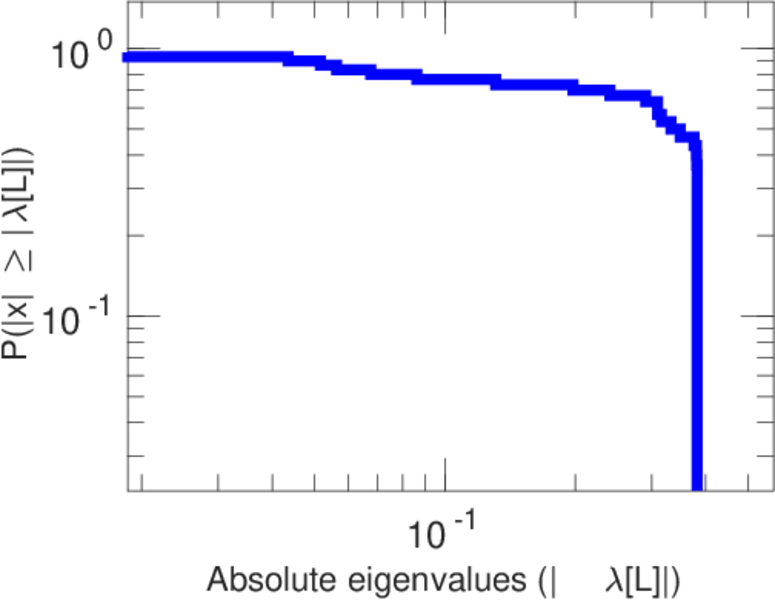
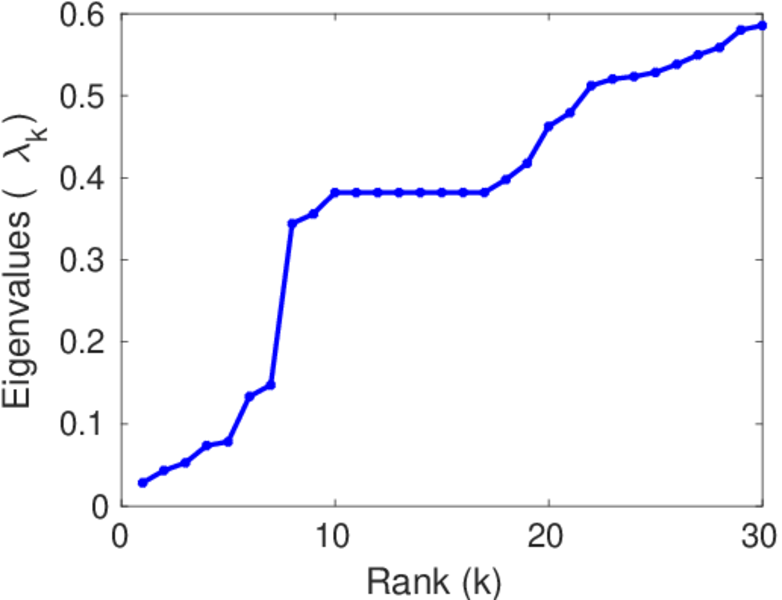
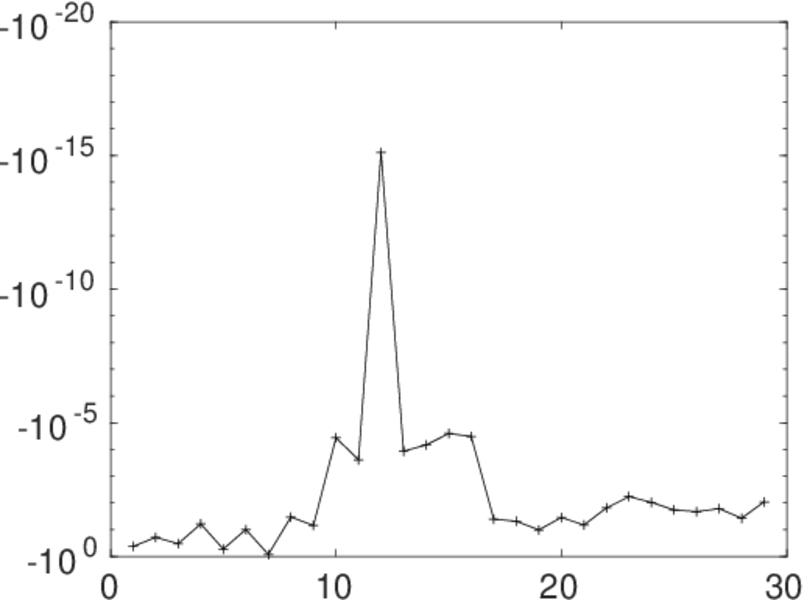
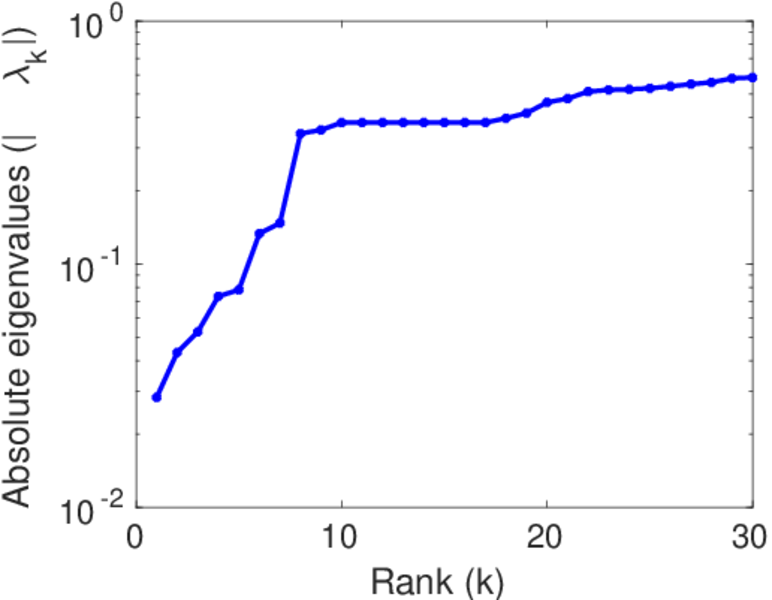
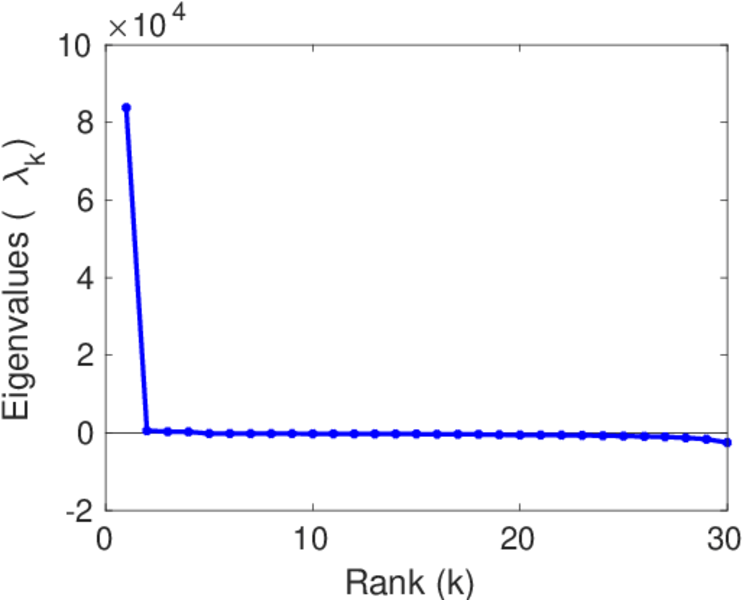
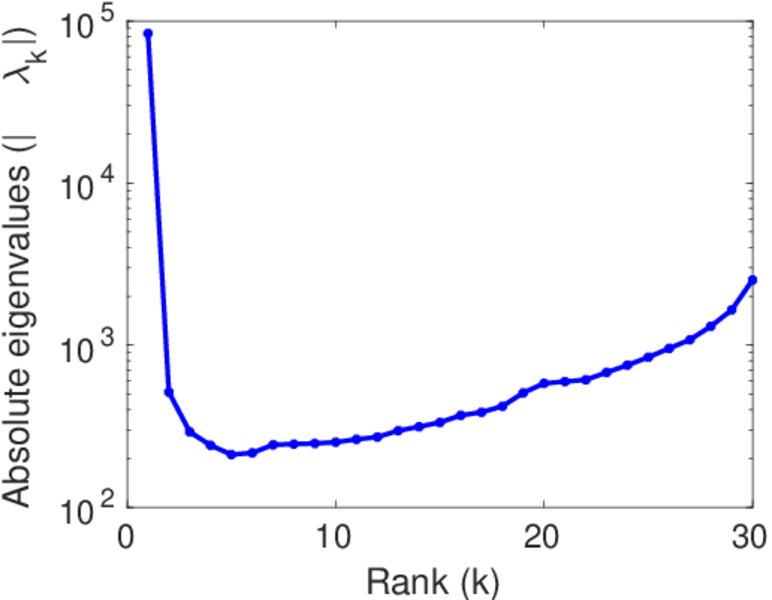
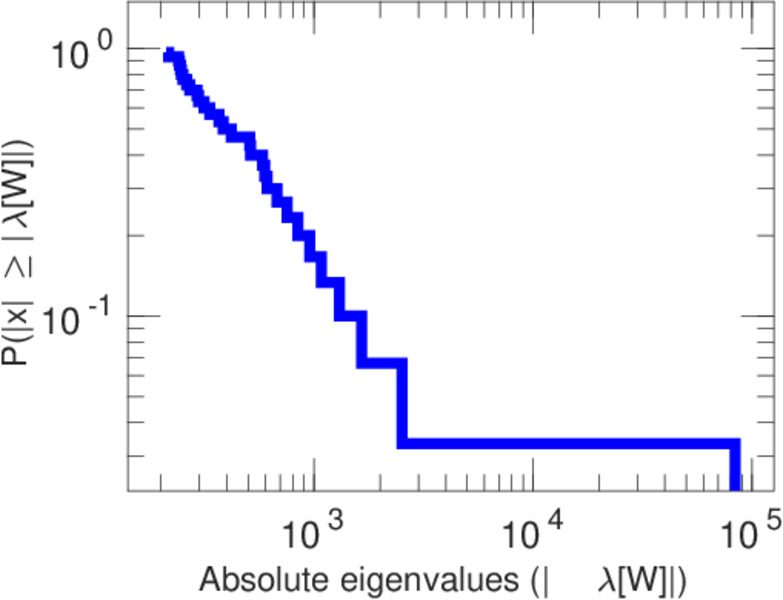
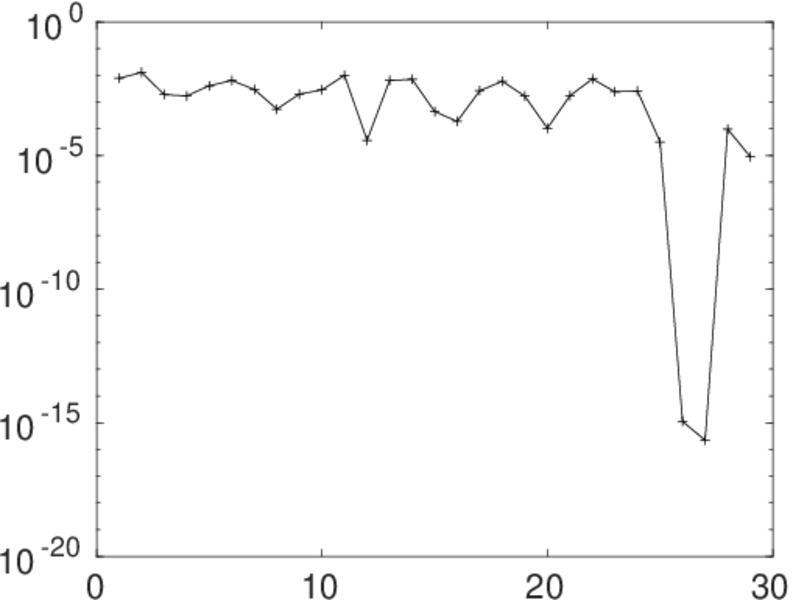
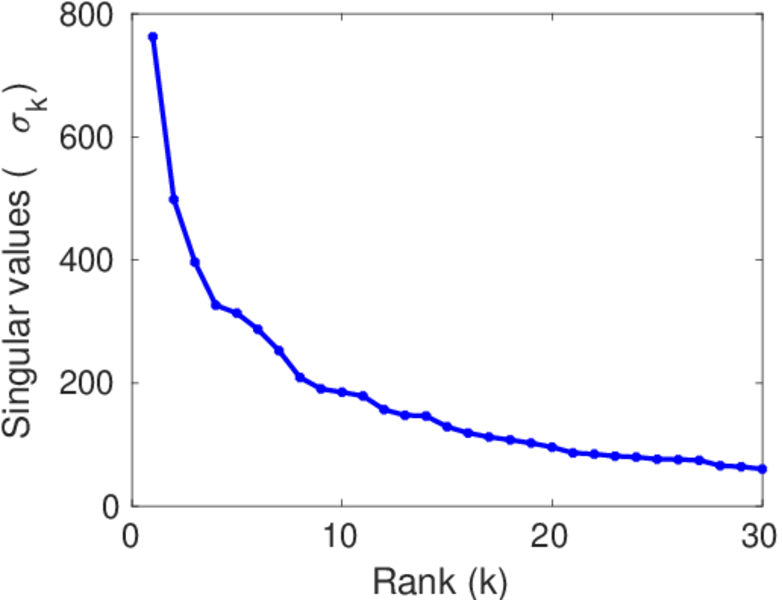
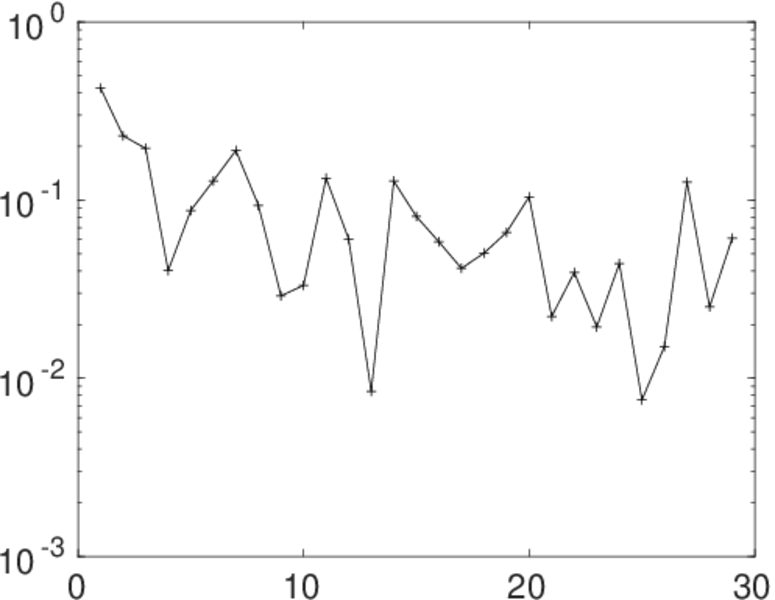
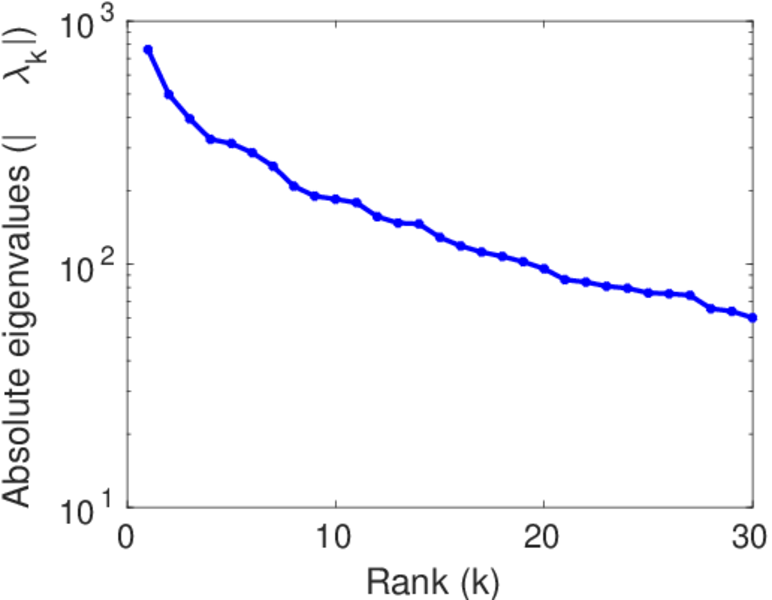
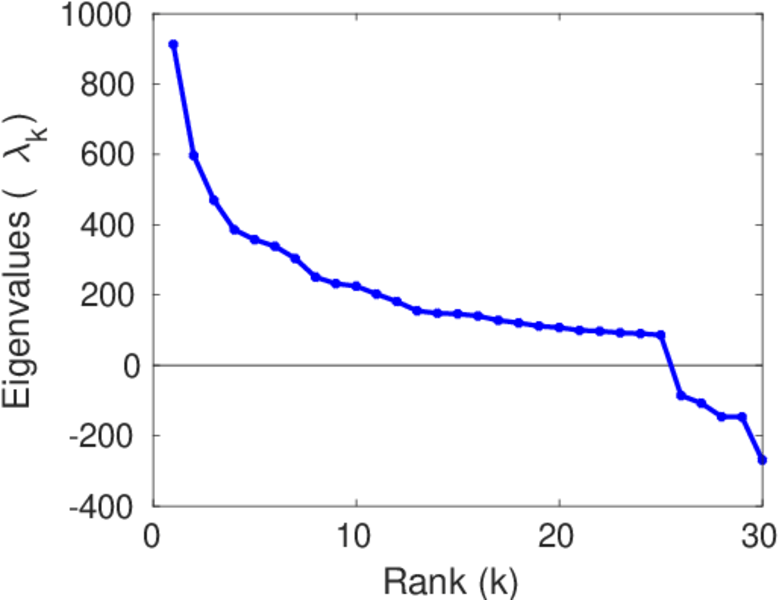
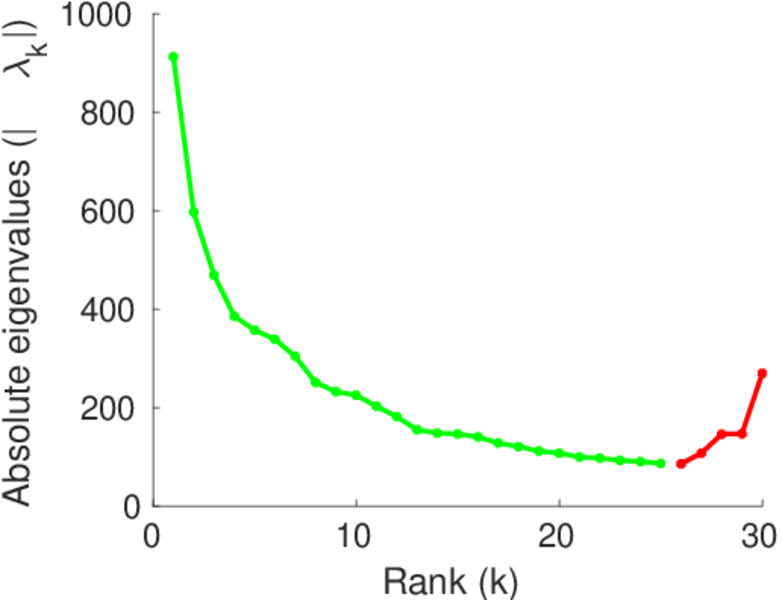
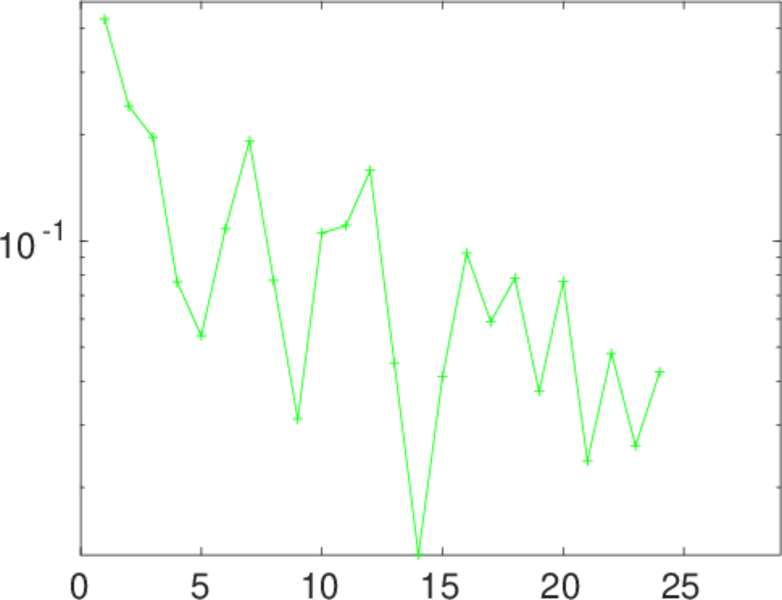
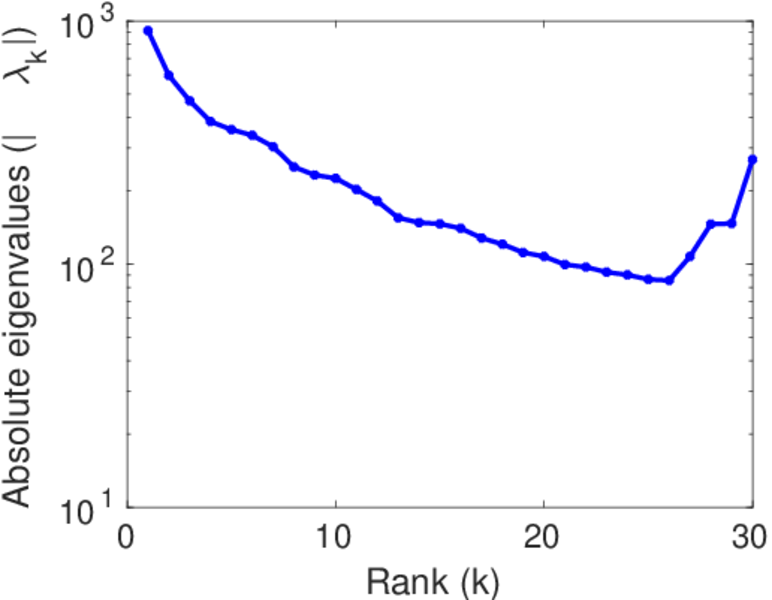
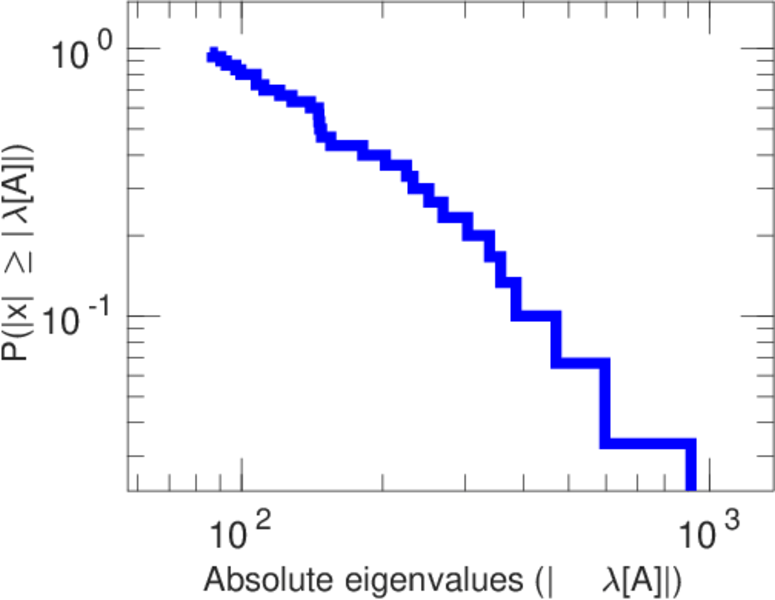
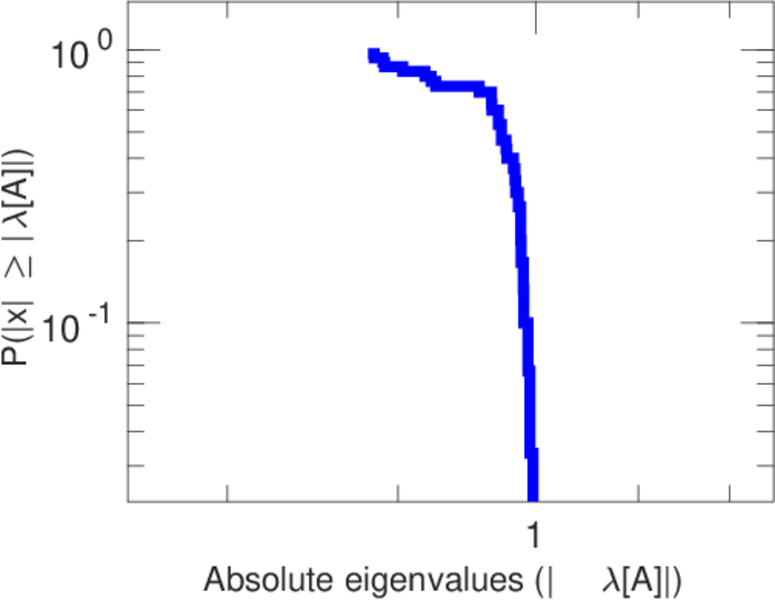
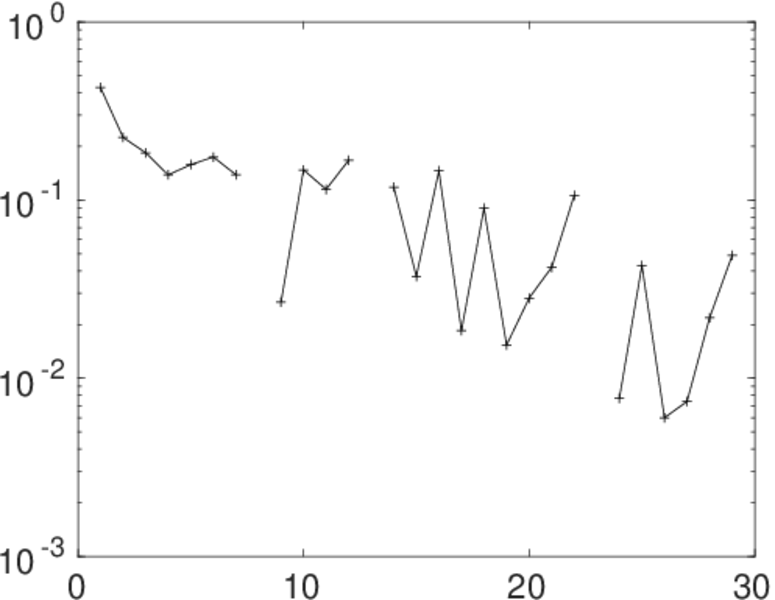
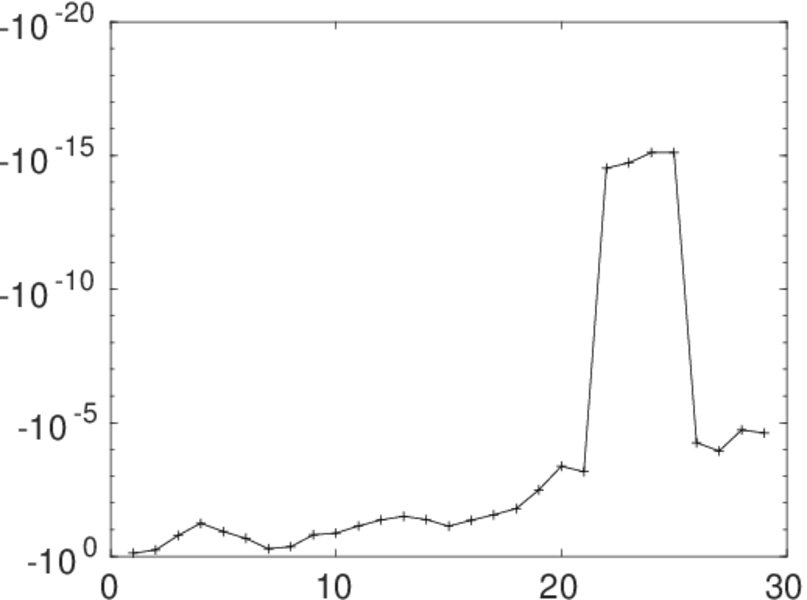
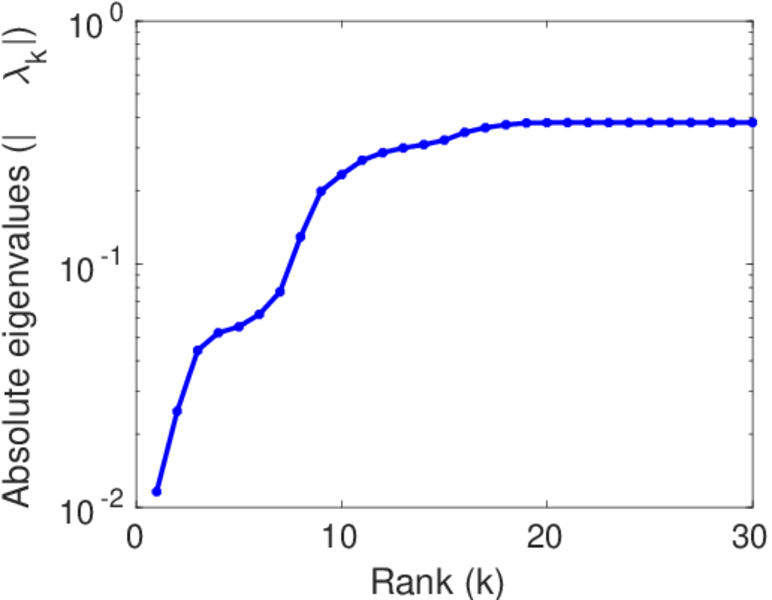
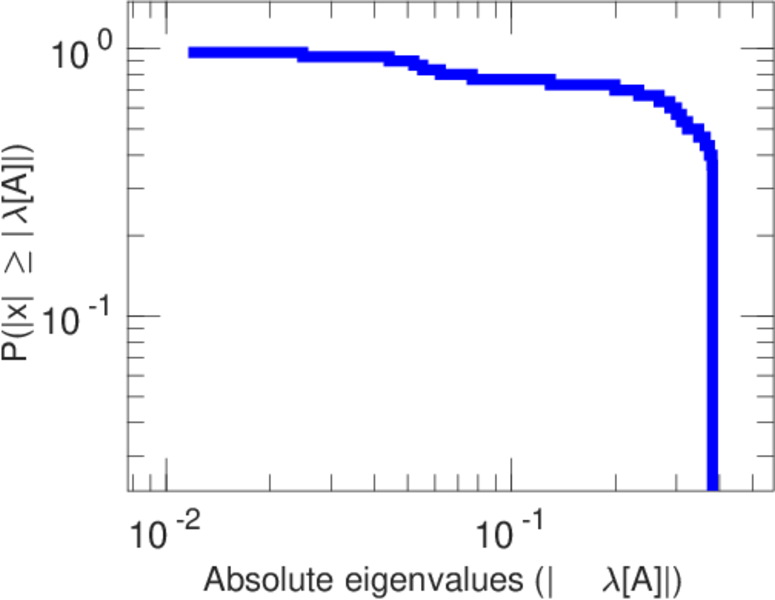
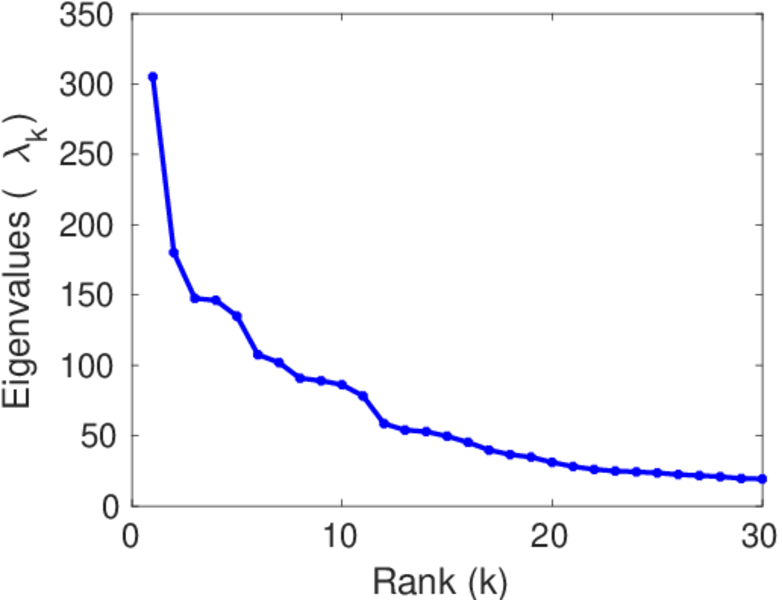
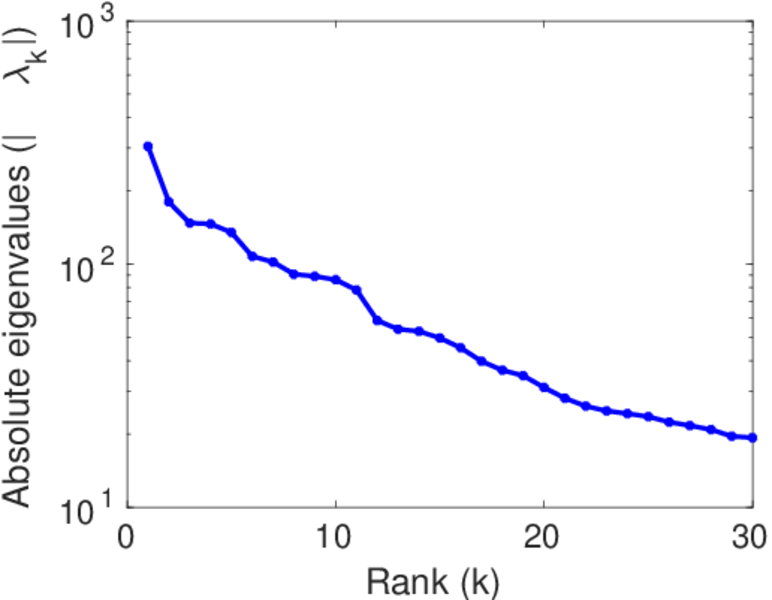
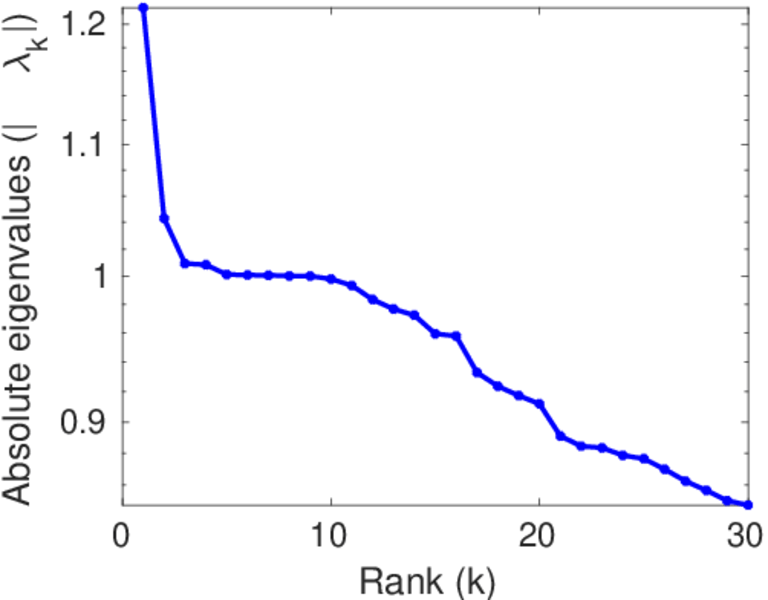
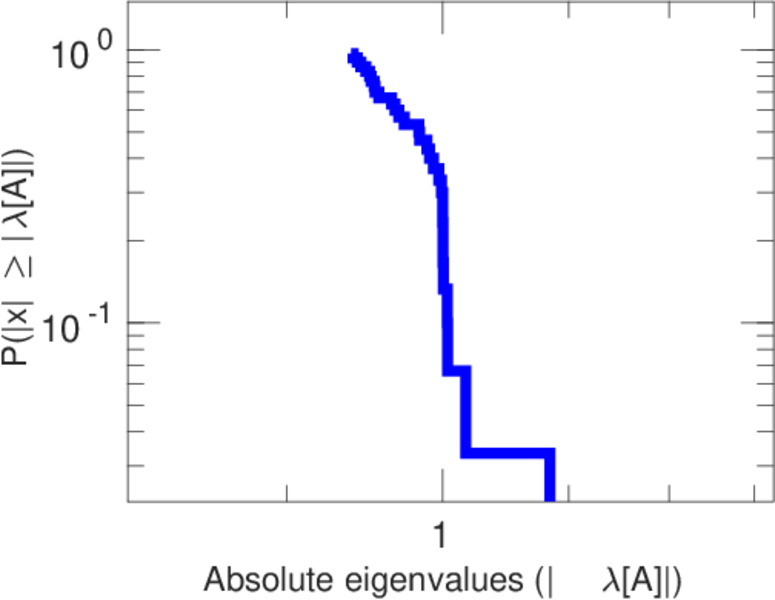
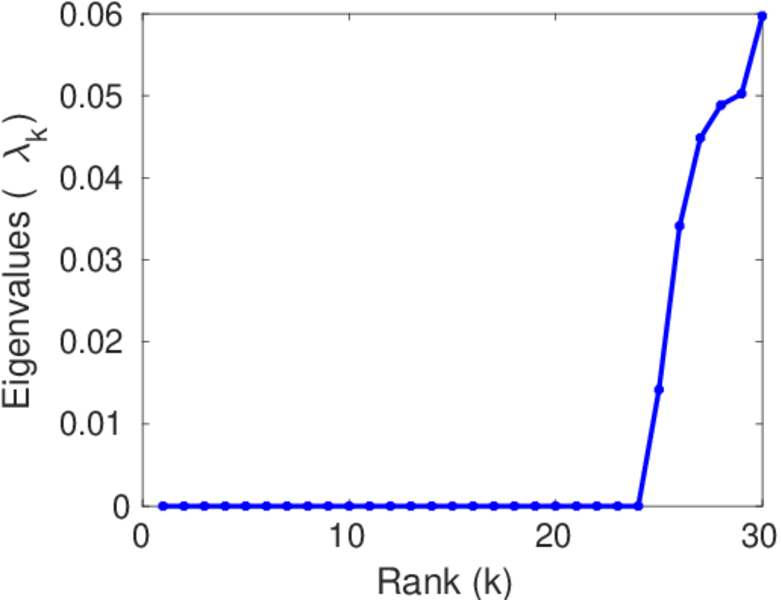
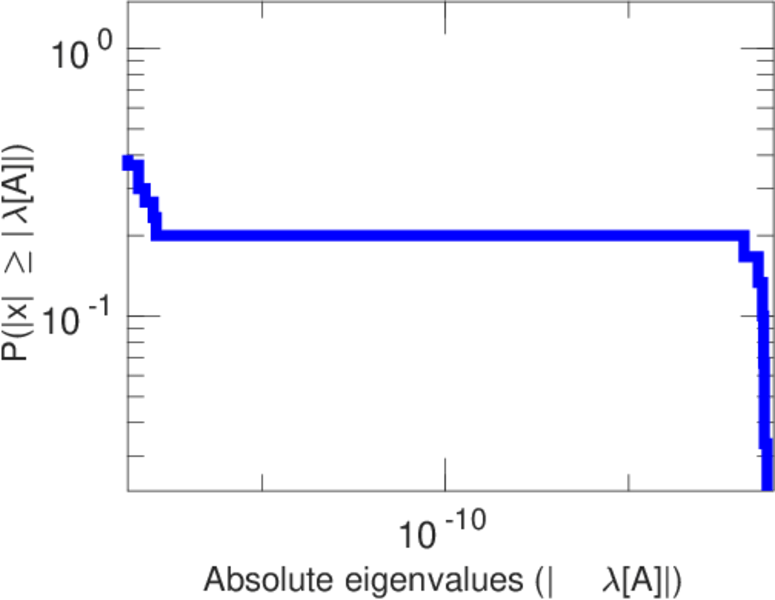
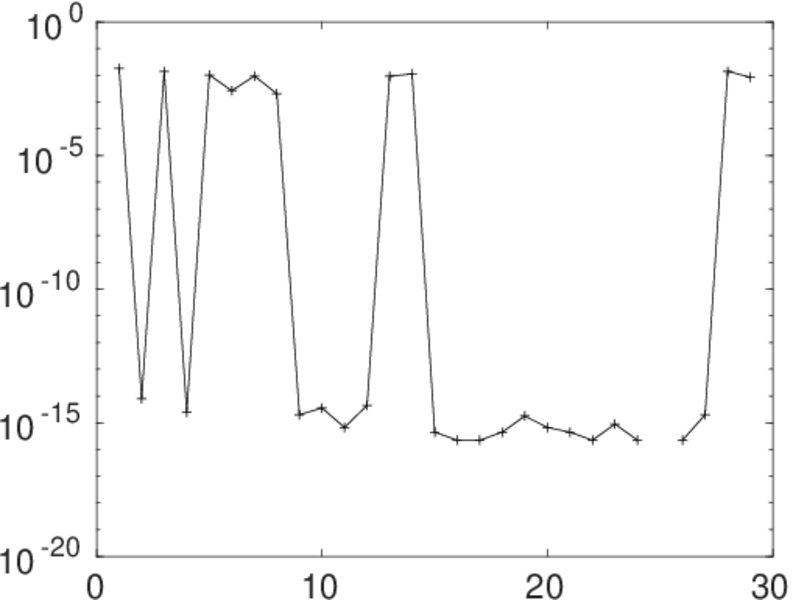
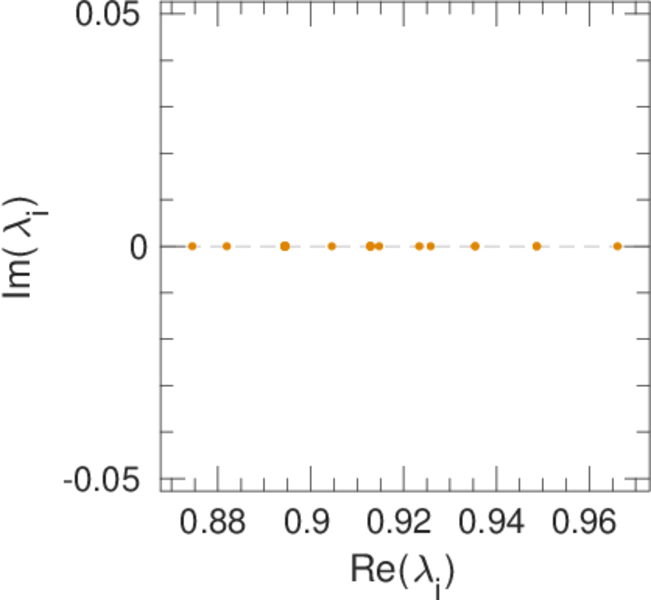
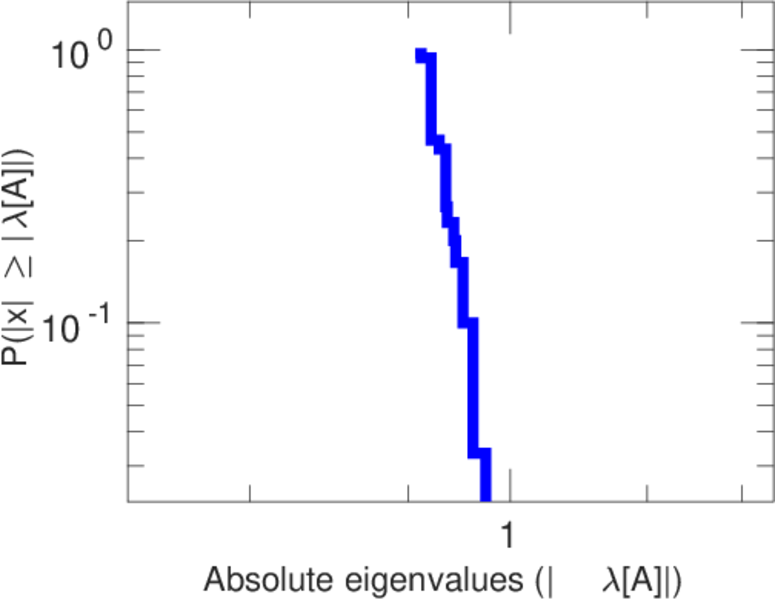
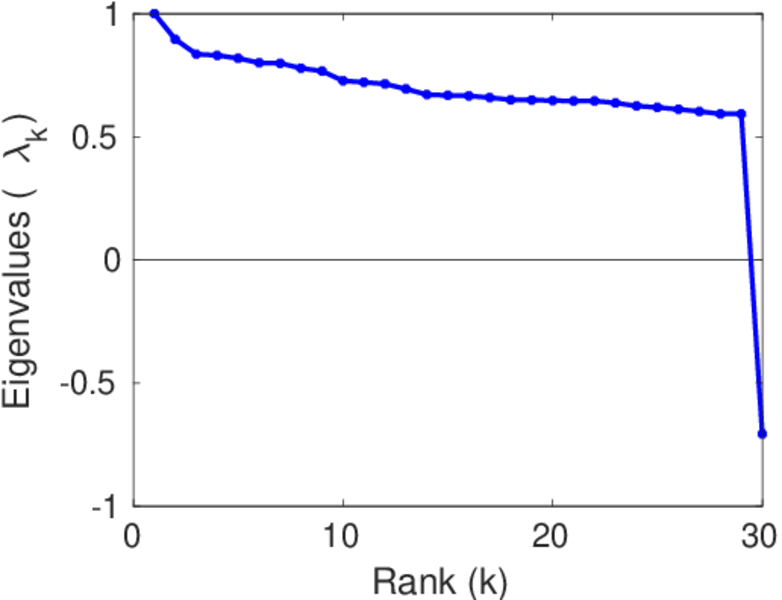
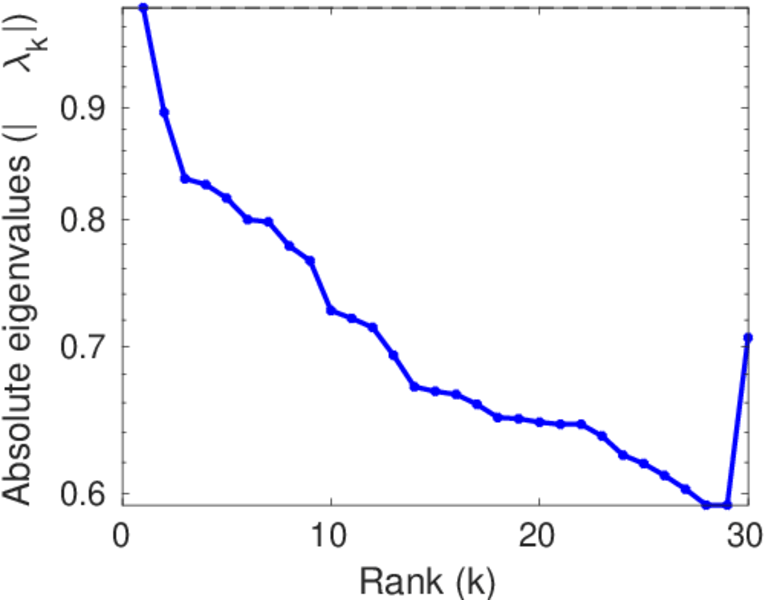
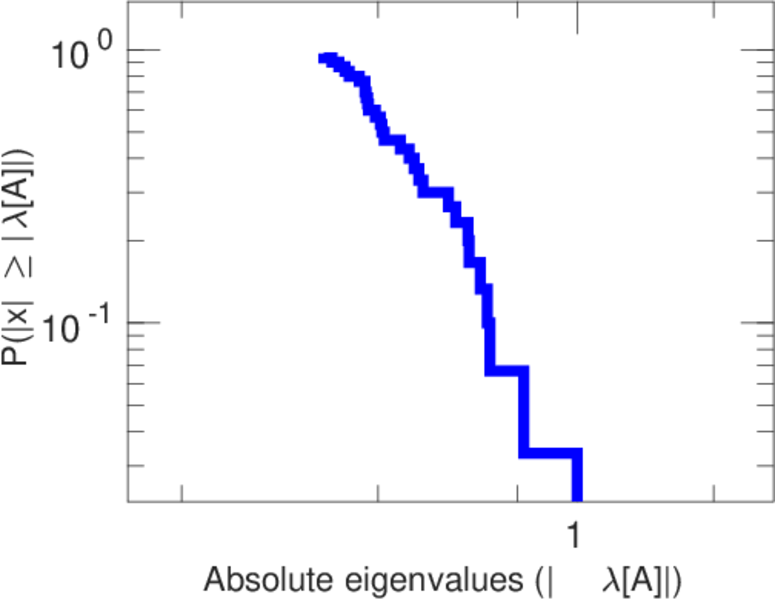
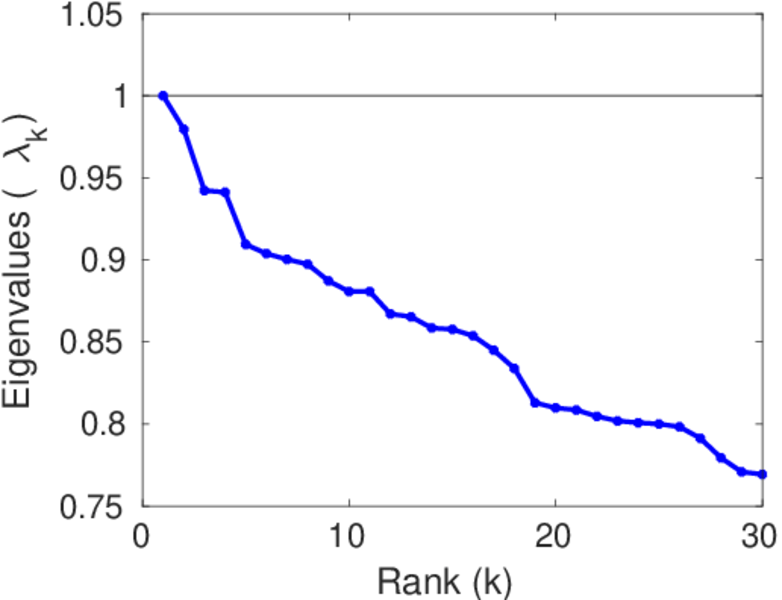
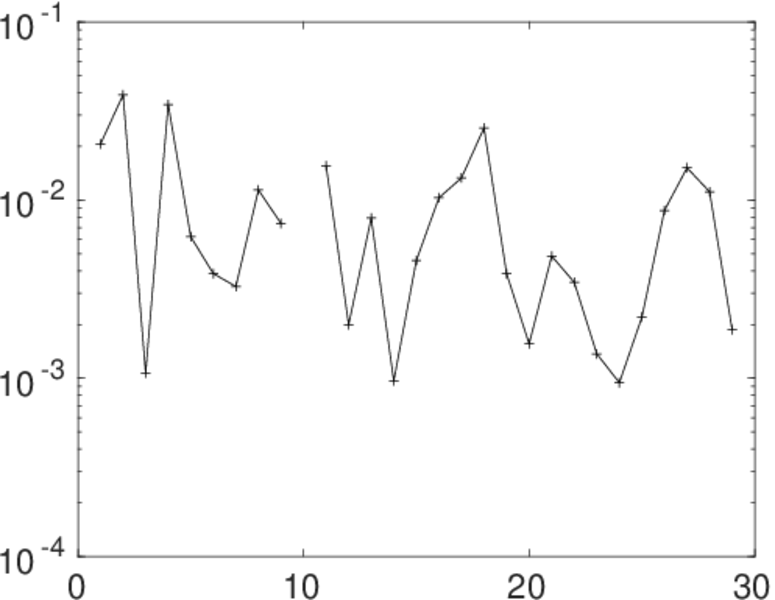
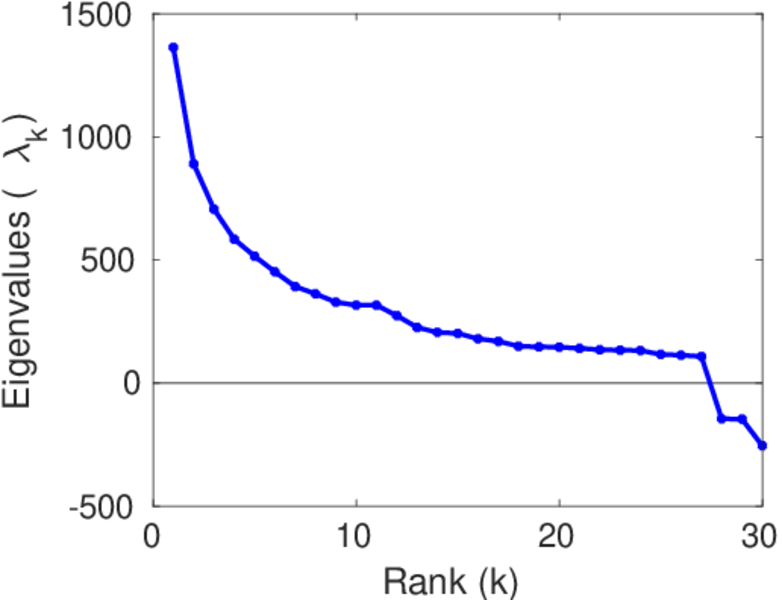
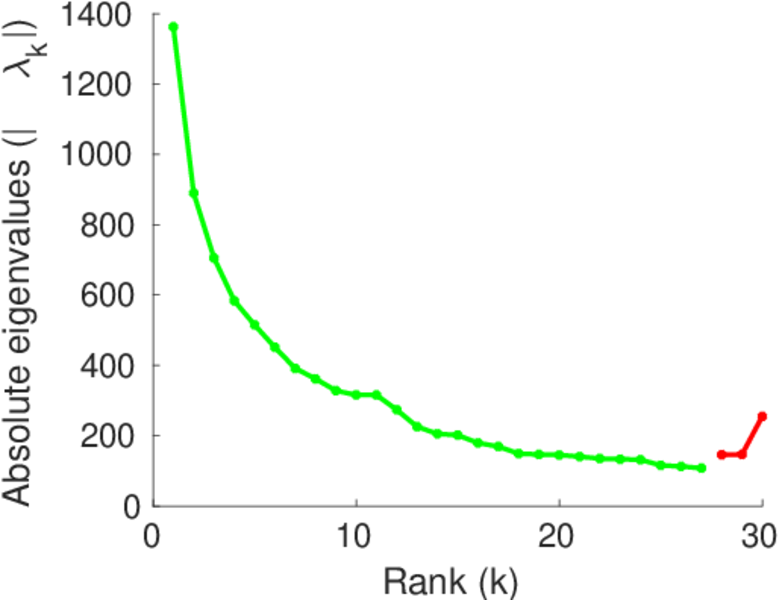
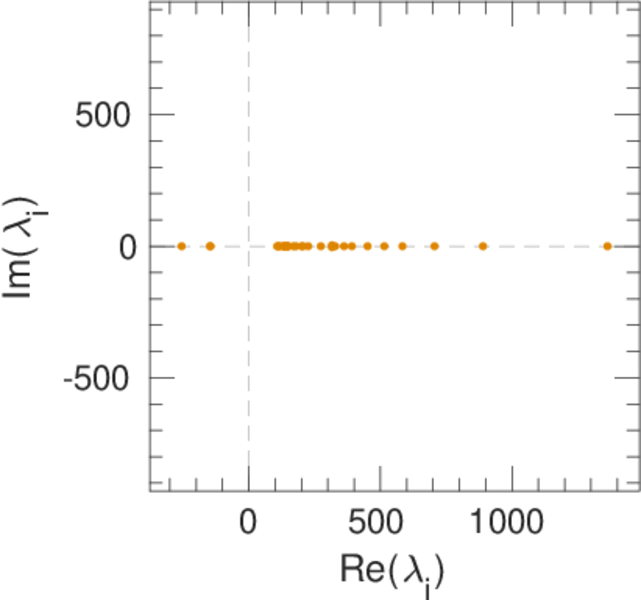
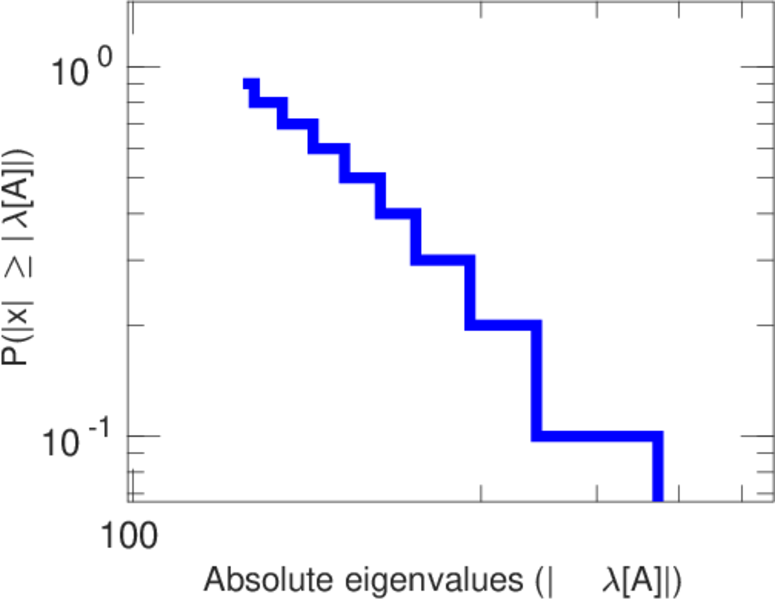
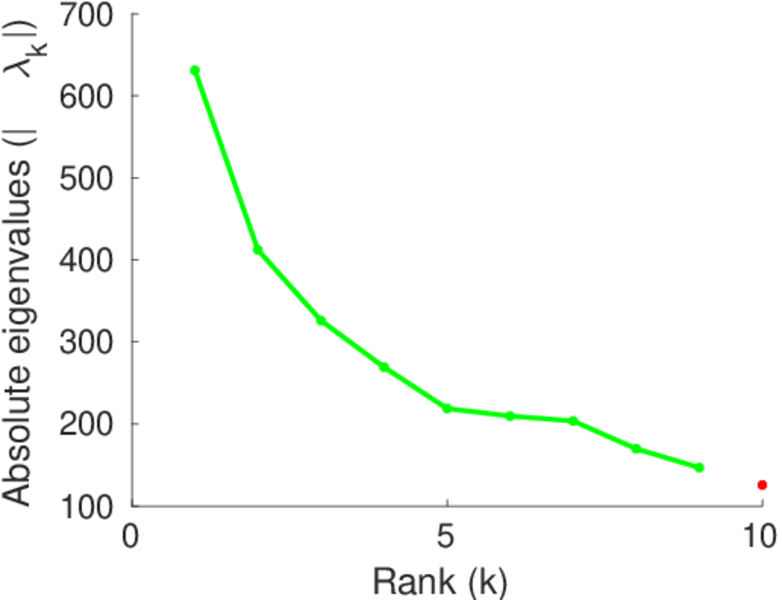
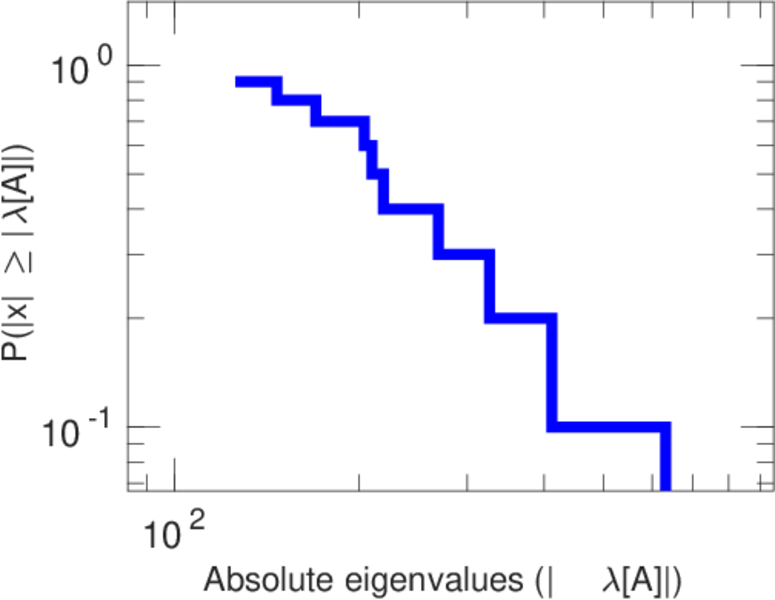
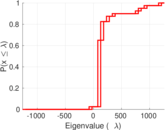
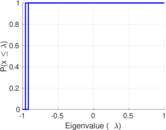
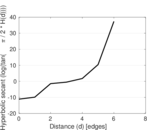
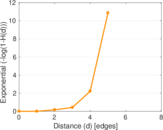
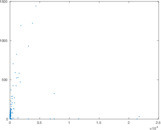
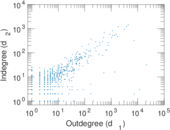
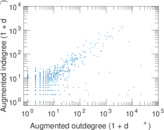
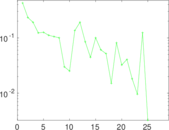
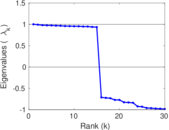
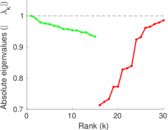
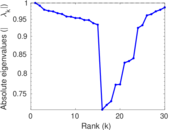
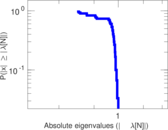
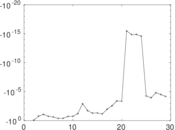
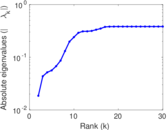
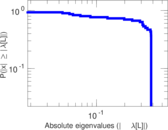
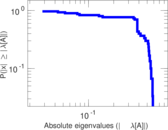
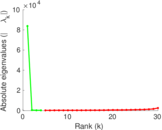
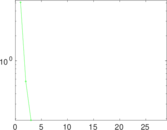
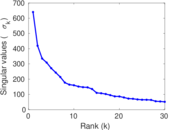
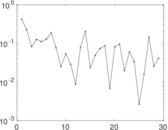
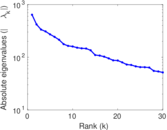
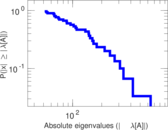
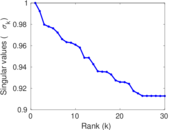
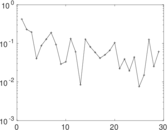
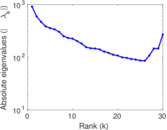
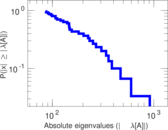
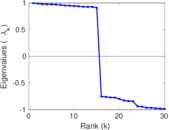
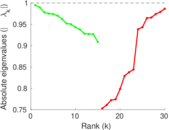
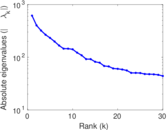
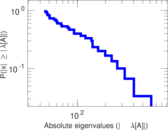
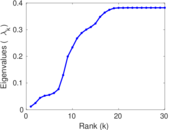
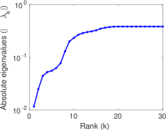
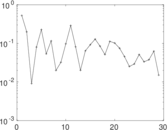
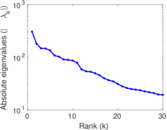
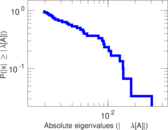
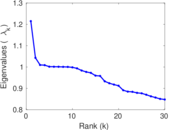
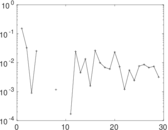
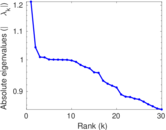
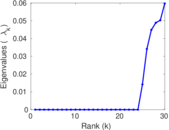
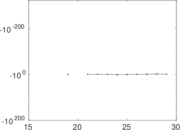
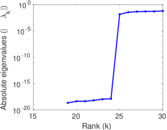
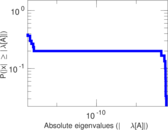
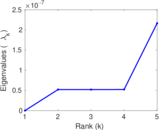
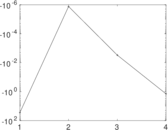
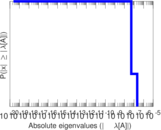
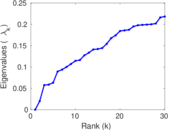
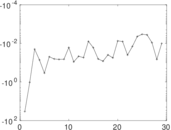
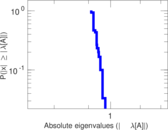
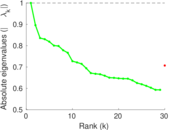
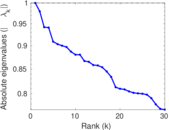
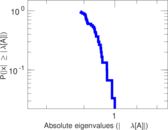
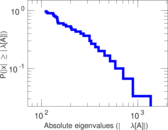
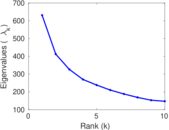
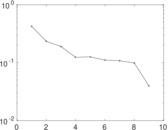
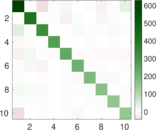
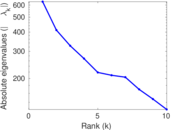
Plots


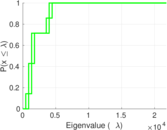
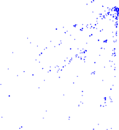


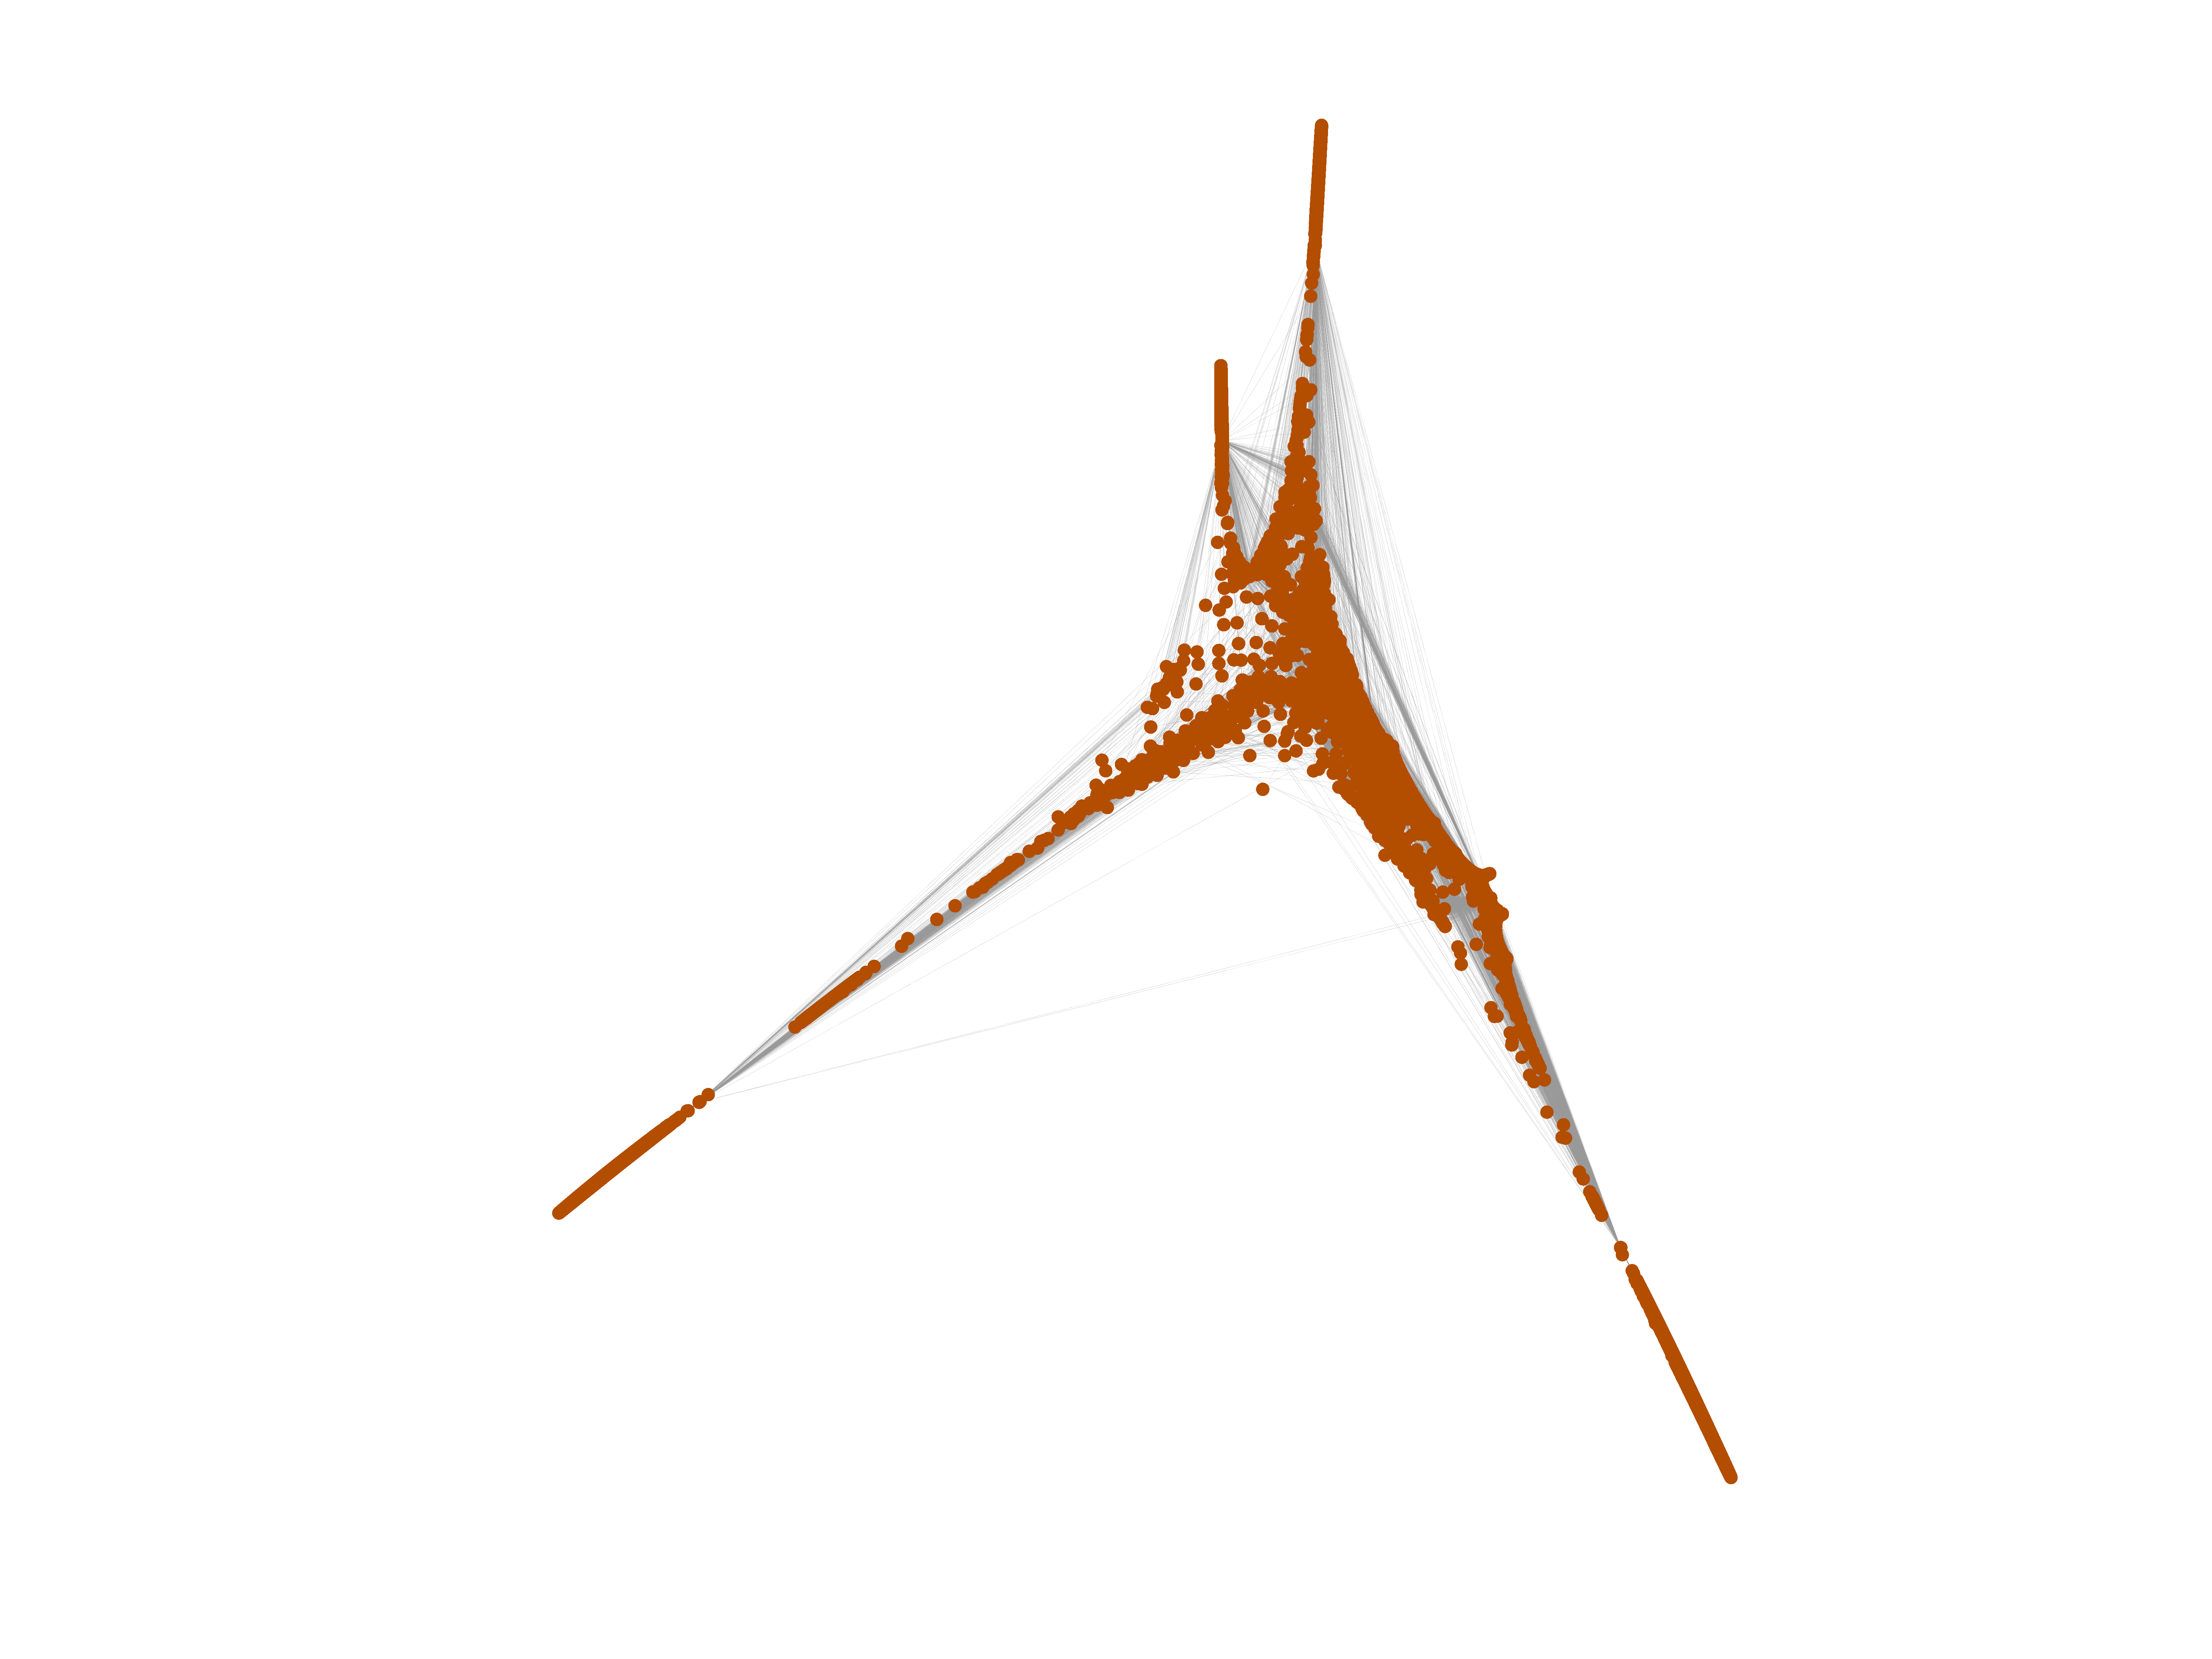
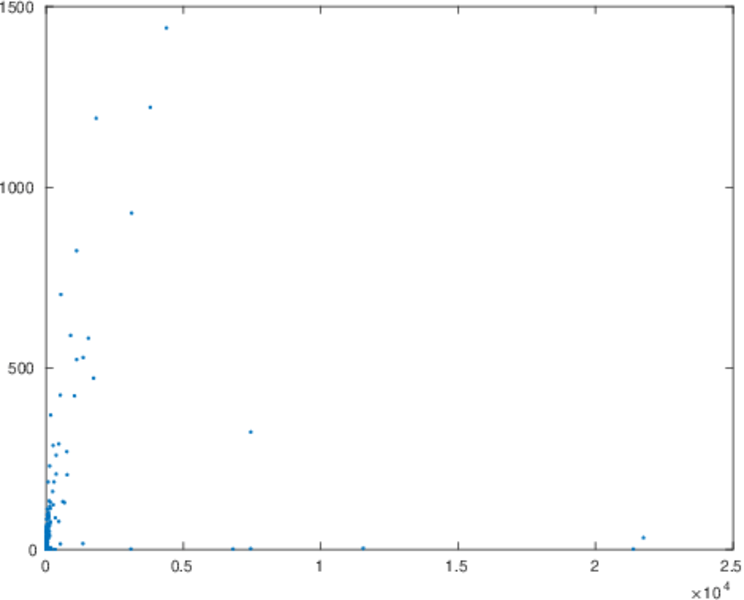
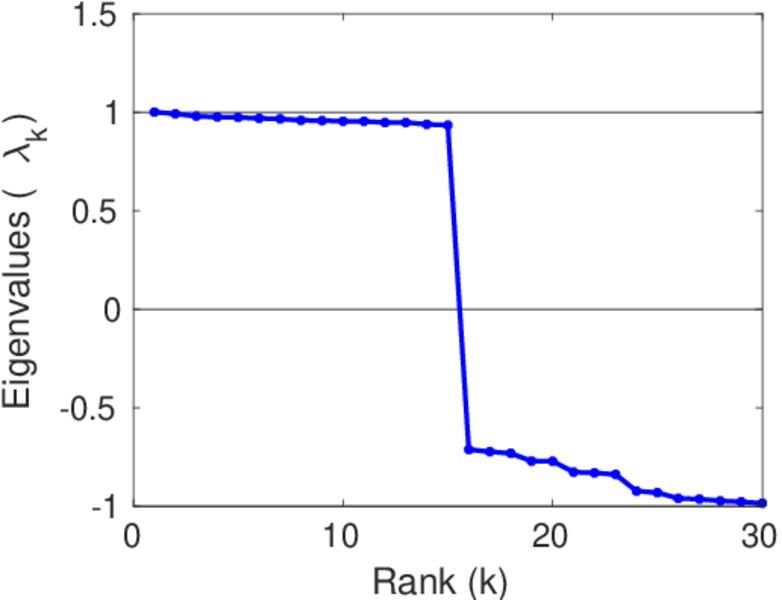
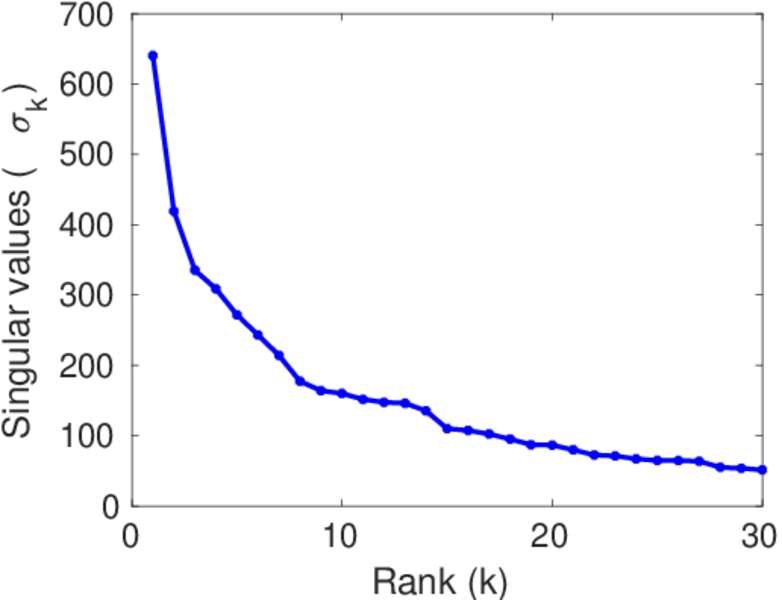
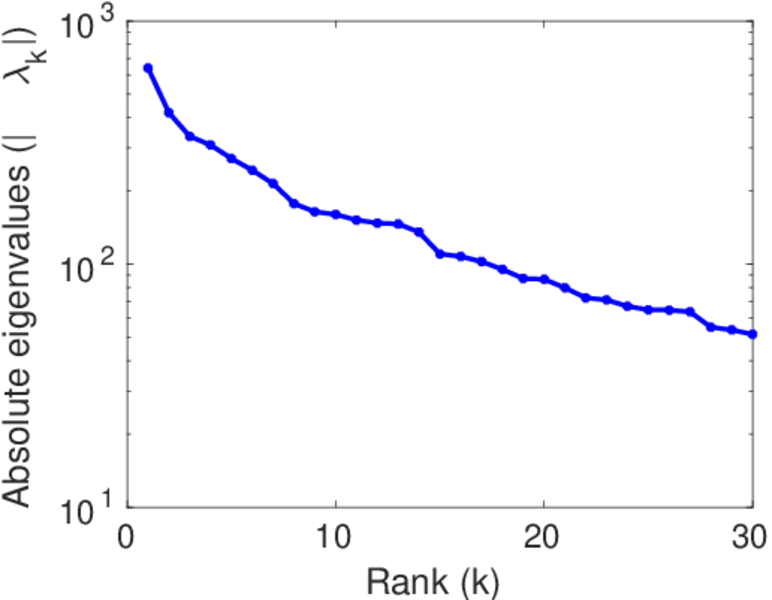
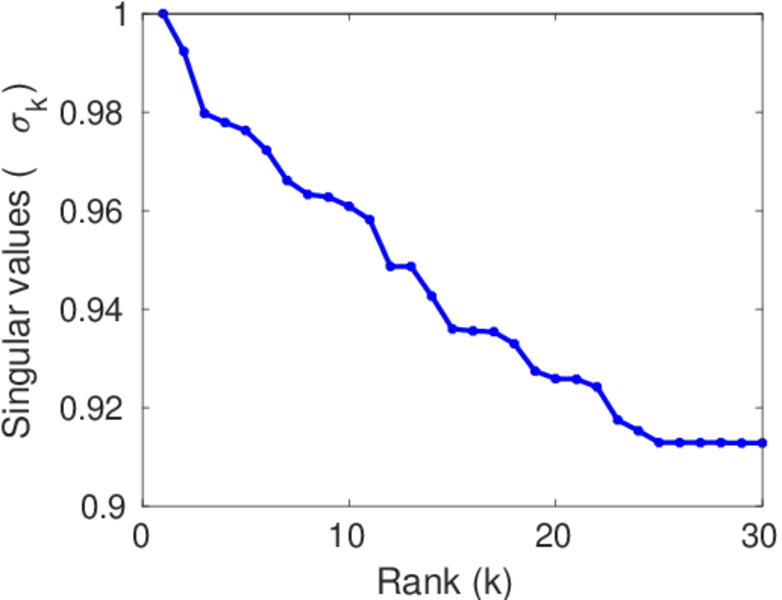
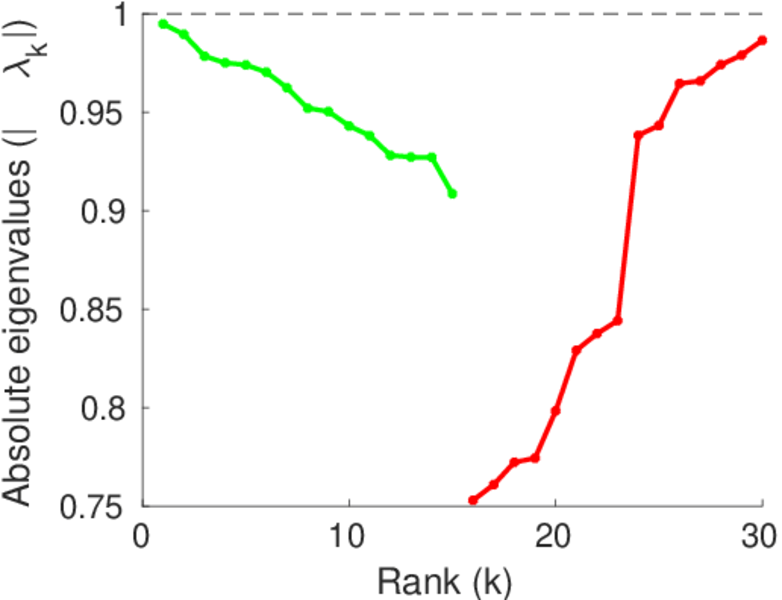
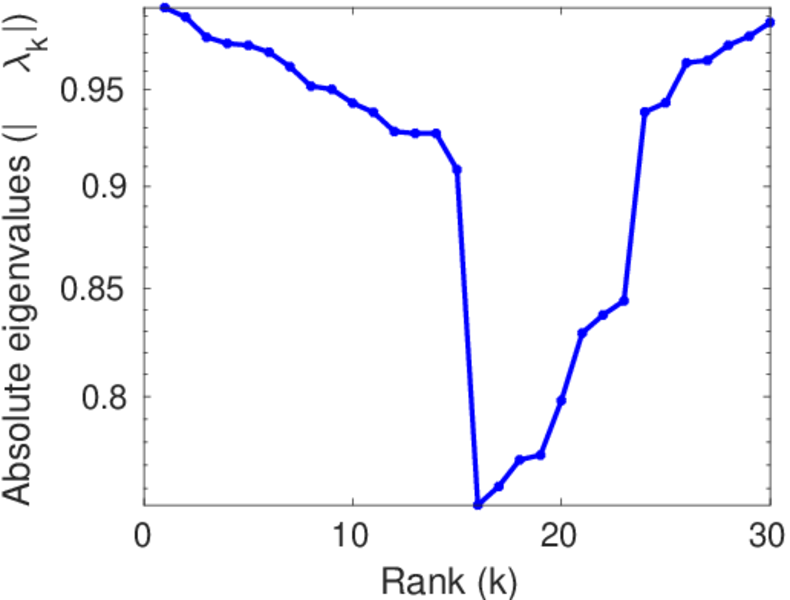
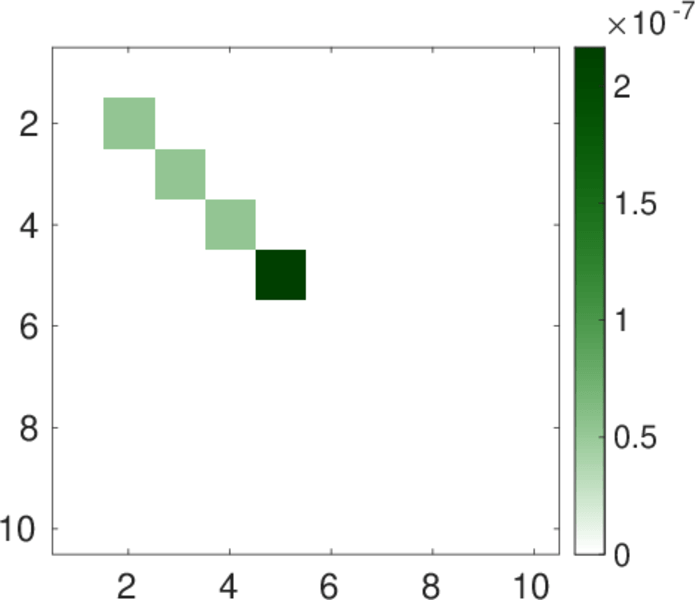
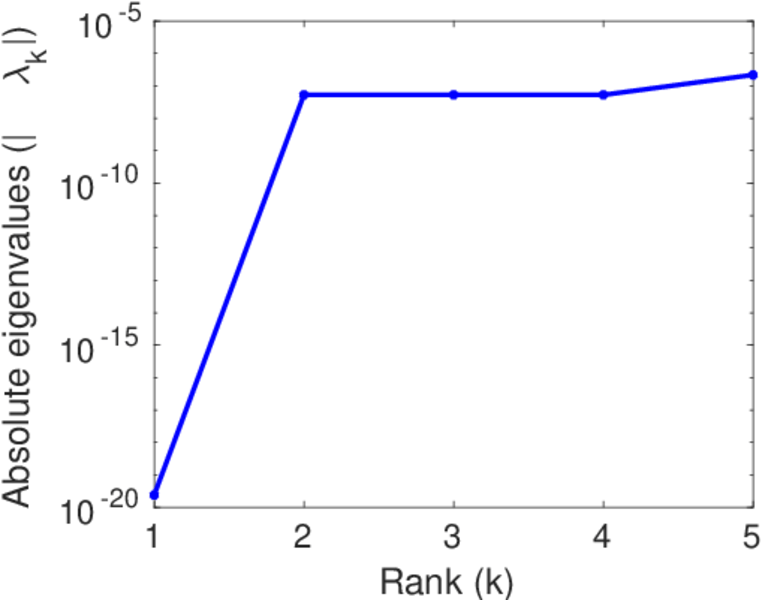
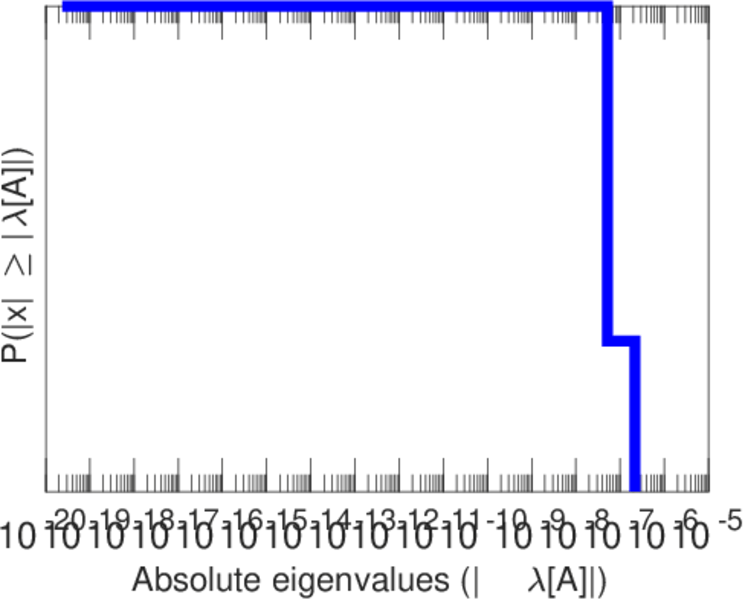
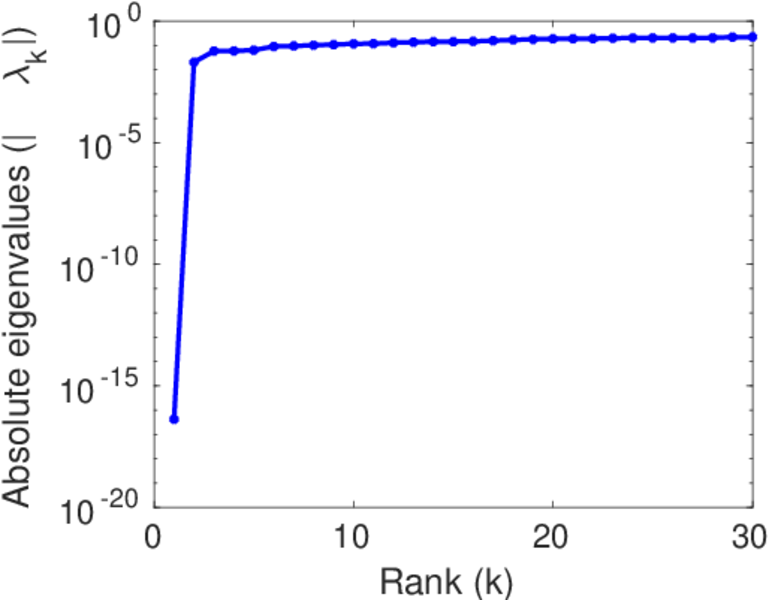
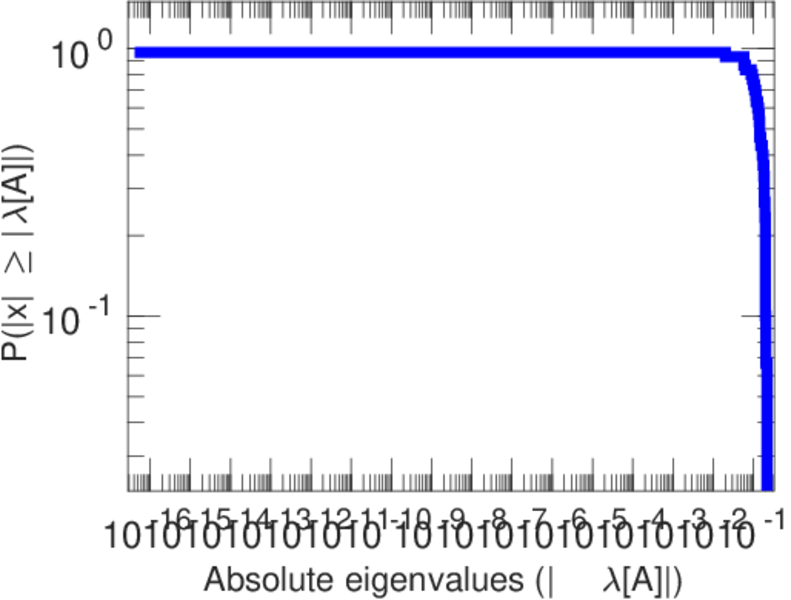
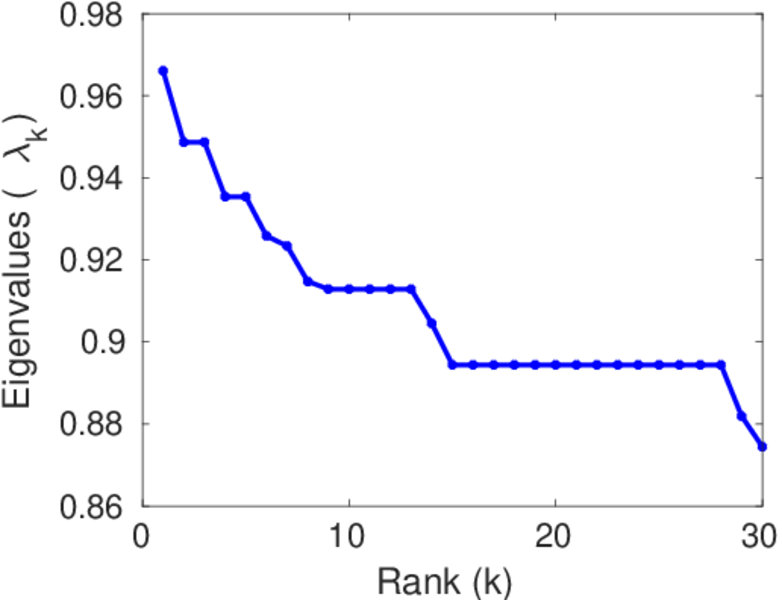
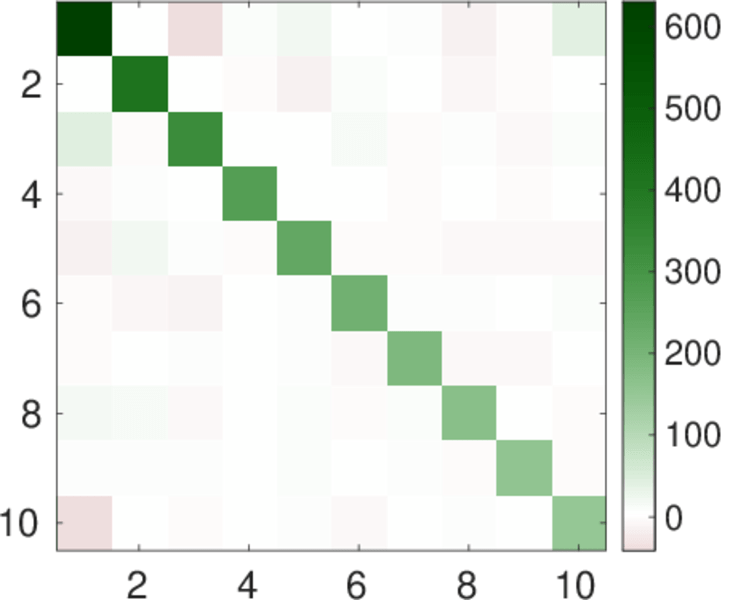
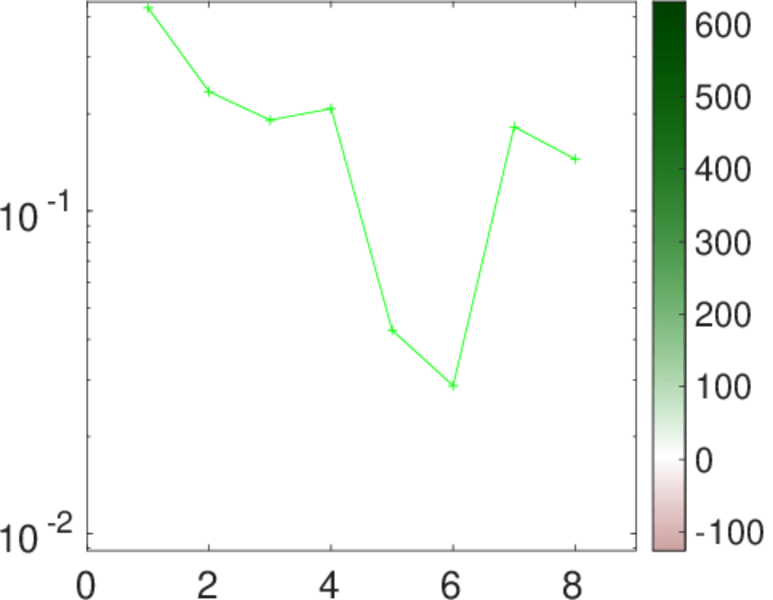
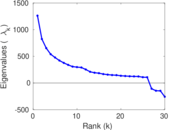
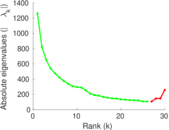
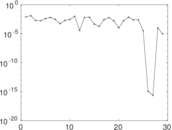
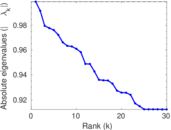
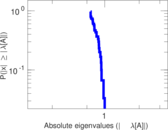
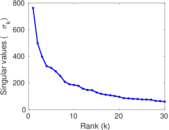
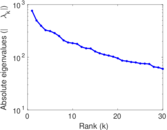
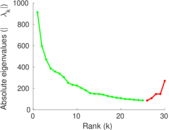
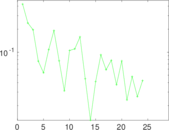
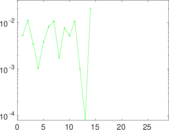
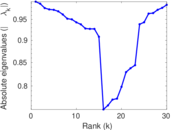
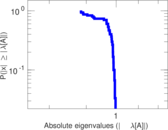
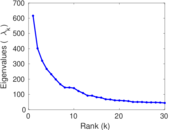
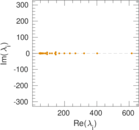
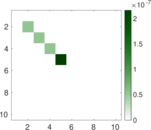
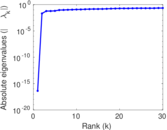
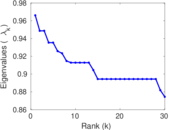
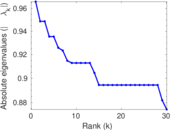
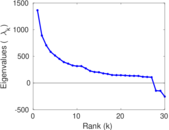
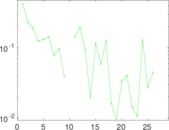
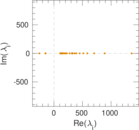
Matrix decompositions plots


Downloads
References
|
[1]
|
Jérôme Kunegis.
KONECT – The Koblenz Network Collection.
In Proc. Int. Conf. on World Wide Web Companion, pages
1343–1350, 2013.
[ http ]
|
|
[2]
|
Jun Sun, Jérôme Kunegis, and Steffen Staab.
Predicting user roles in social networks using transfer learning with
feature transformation.
In Proc. ICDM Workshop on Data Min. in Netw., 2016.
|
 KONECT ‣ Networks ‣
Buy Me a Coffee
KONECT ‣ Networks ‣
Buy Me a Coffee