Wikipedia talk (eu)
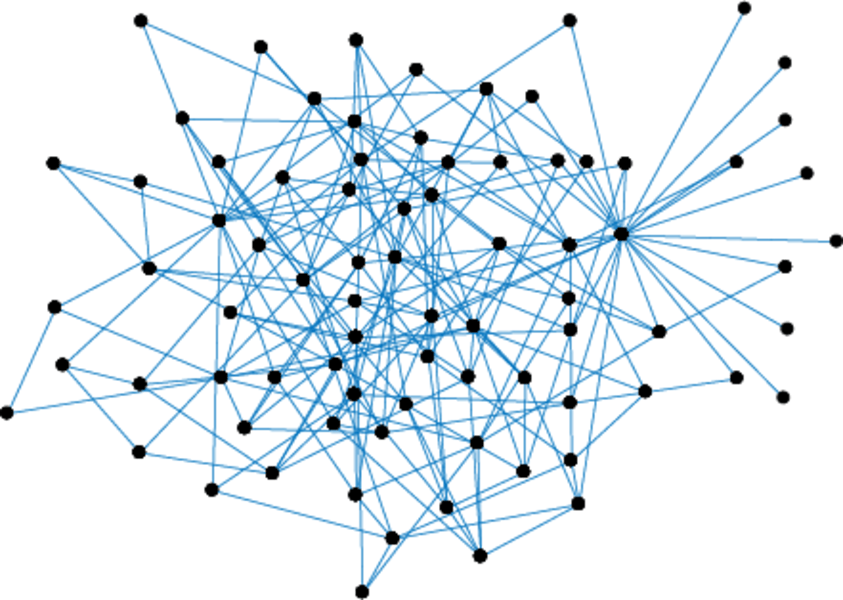
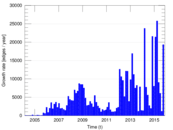
This is the communication network of the Basque Wikipedia. Nodes represent
users, and an edge from user A to user B denotes that user A wrote a message on
the talk page of user B at a certain timestamp.
Metadata
Statistics
| Size | n = | 40,993
|
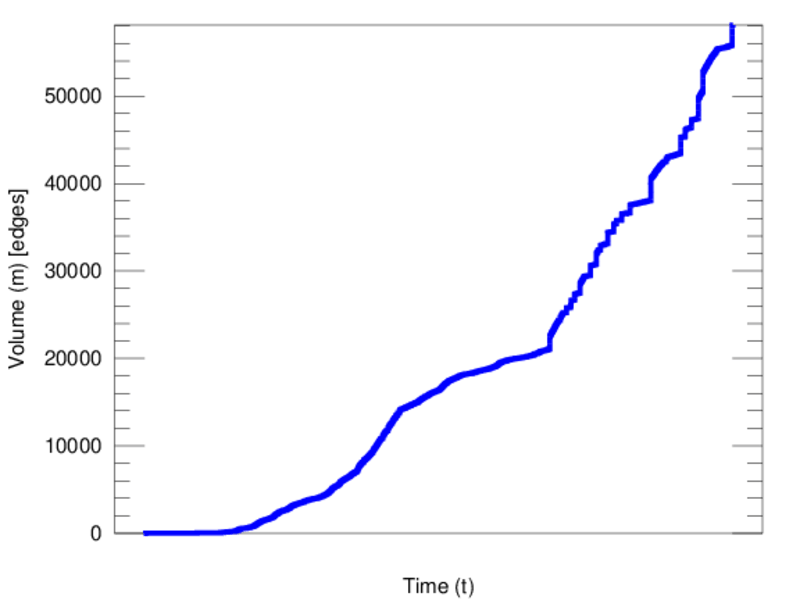
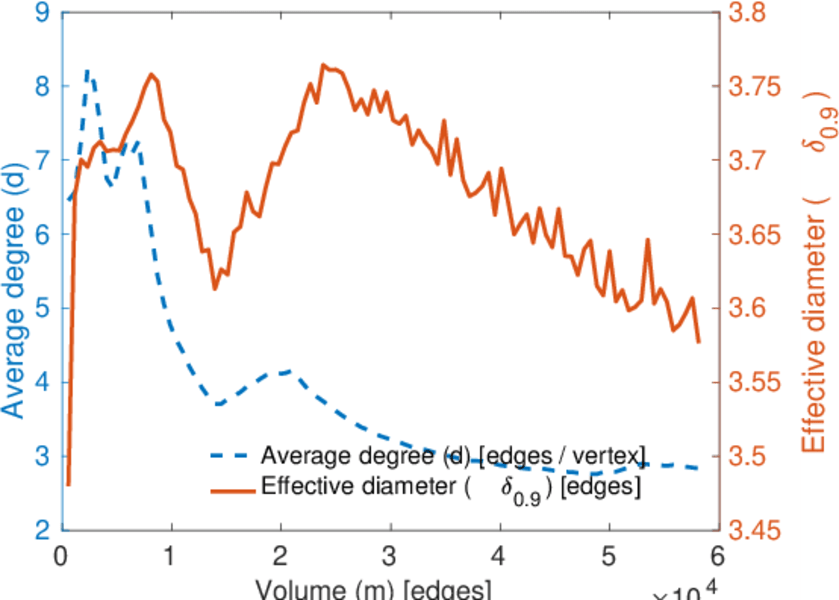
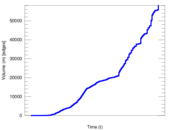
| Volume | m = | 58,120
|
| Unique edge count | m̿ = | 46,524
|
| Loop count | l = | 2,423
|
| Wedge count | s = | 452,599,778
|
| Claw count | z = | 4,296,627,707,315
|
| Cross count | x = | 31,495,070,549,626,512
|
| Triangle count | t = | 4,163
|
| Square count | q = | 688,013
|
| 4-Tour count | T4 = | 1,815,993,208
|
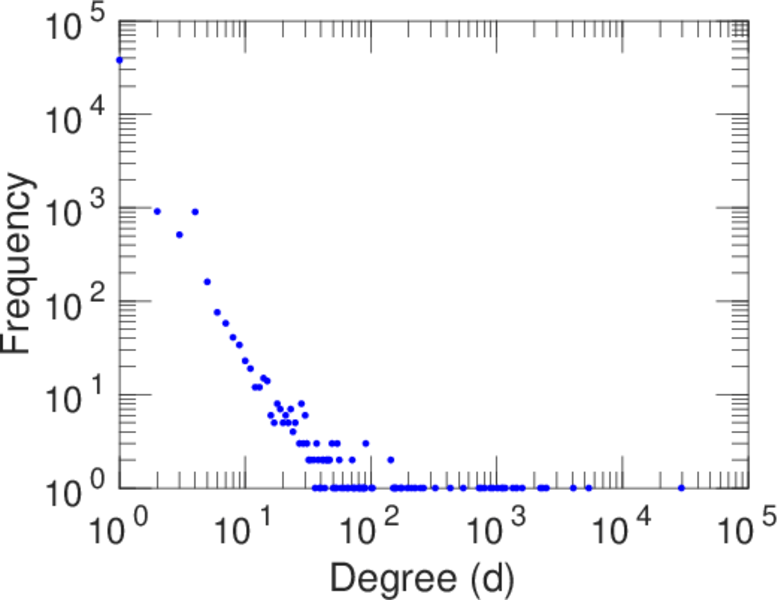
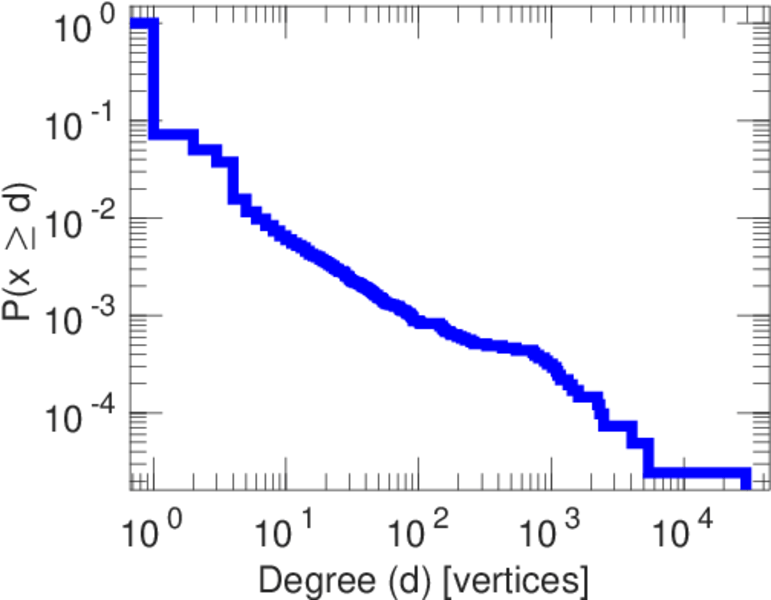
| Maximum degree | dmax = | 29,480
|
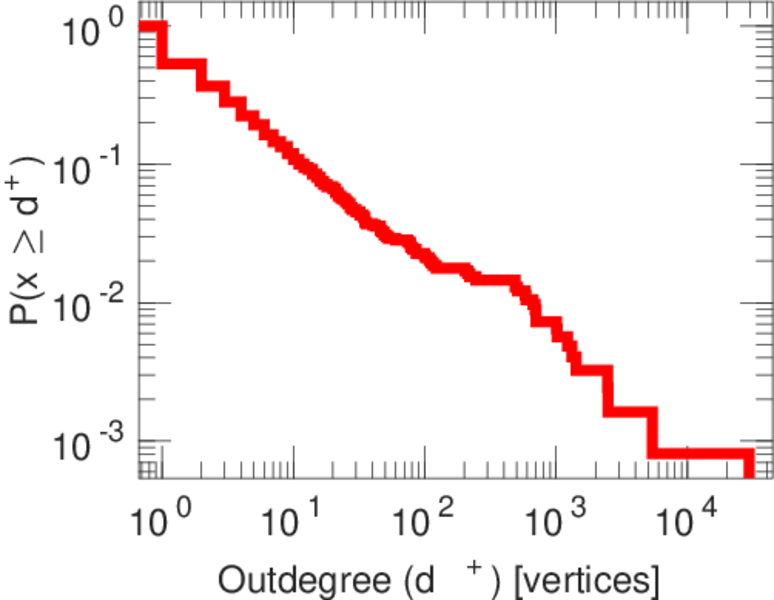
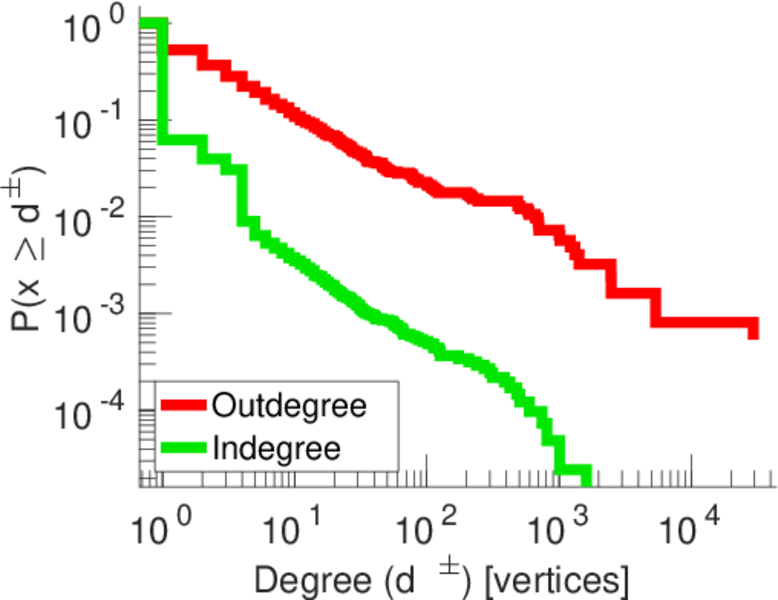
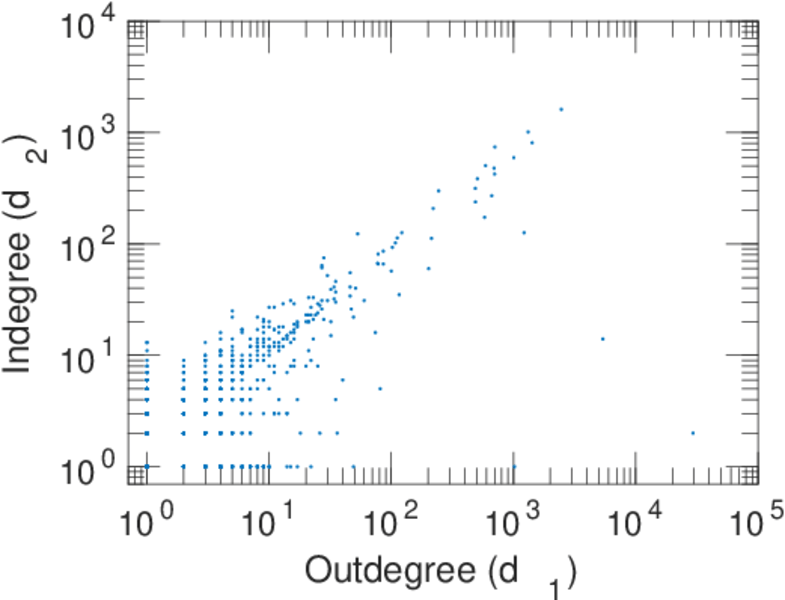
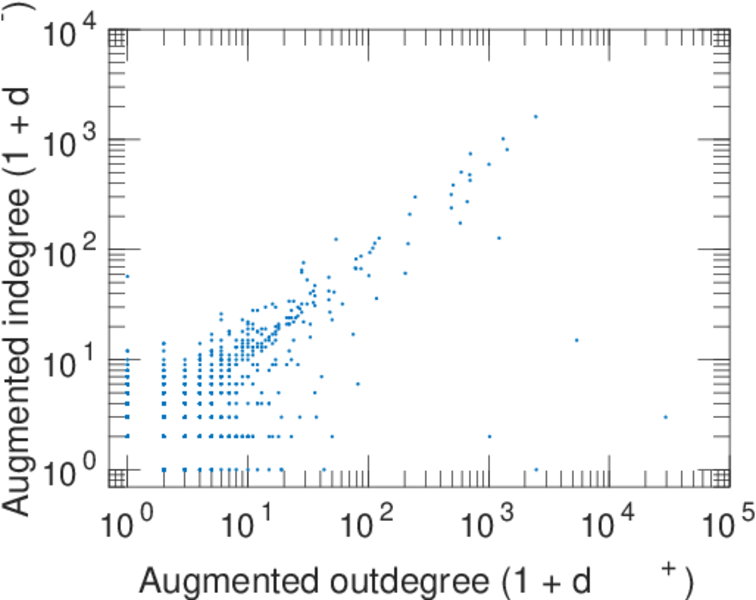
| Maximum outdegree | d+max = | 29,478
|
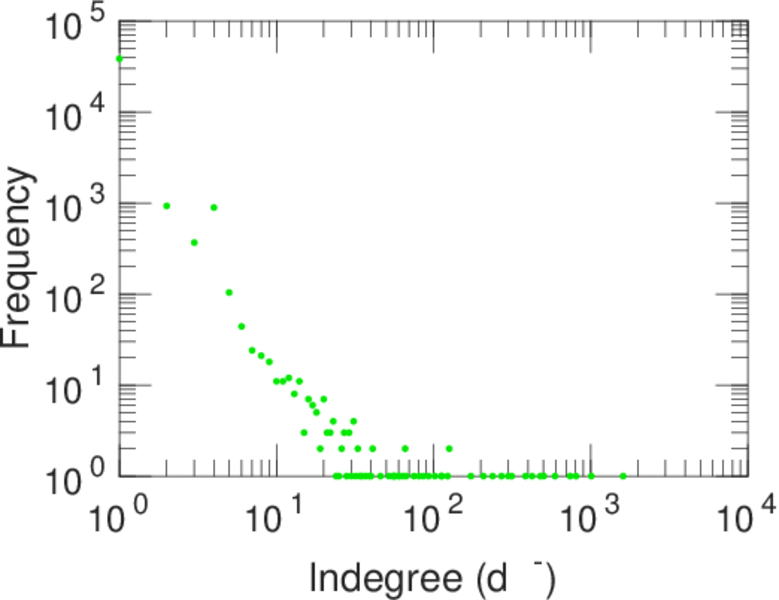
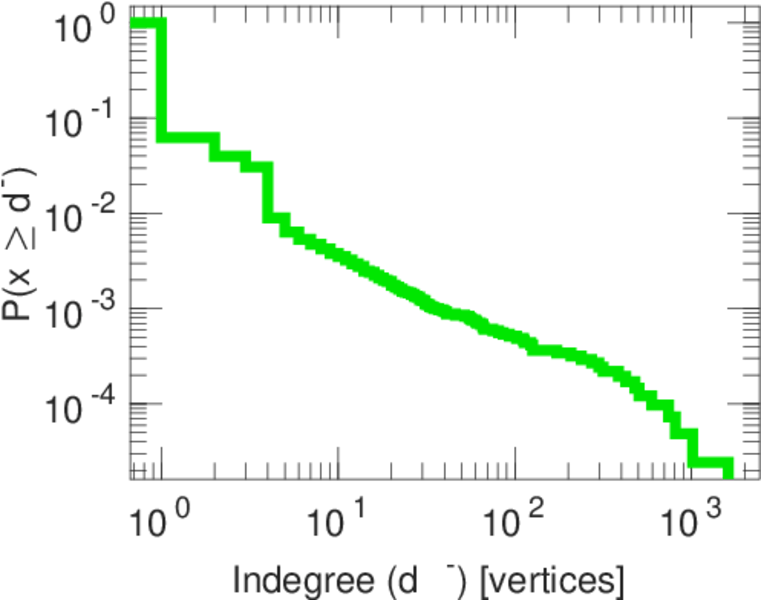
| Maximum indegree | d−max = | 1,612
|
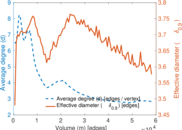
| Average degree | d = | 2.835 61
|
| Fill | p = | 2.768 58 × 10−5
|
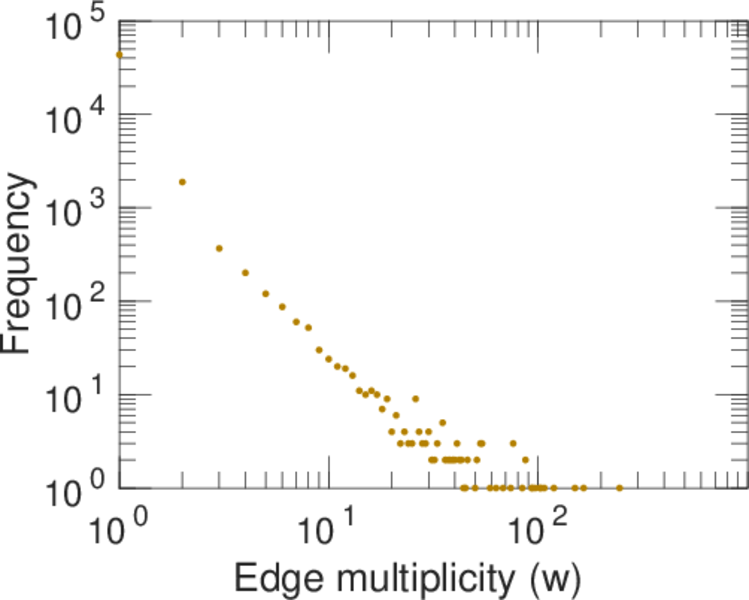
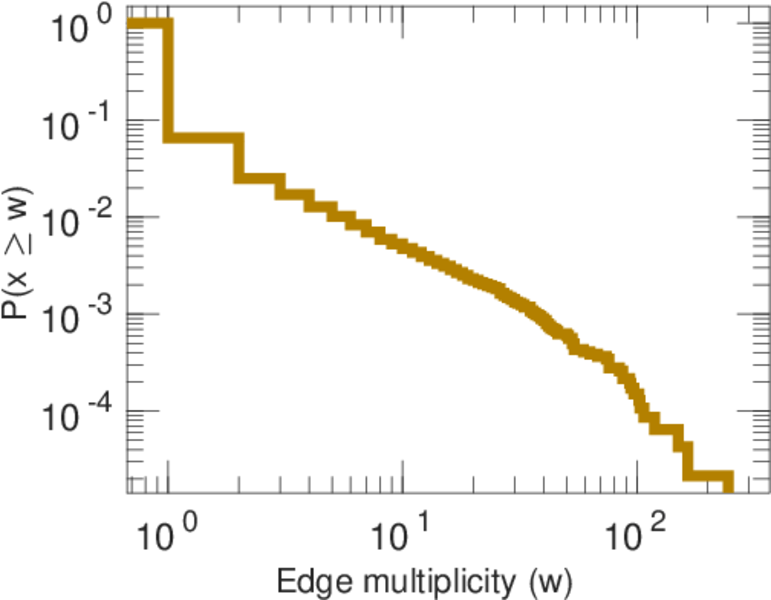
| Average edge multiplicity | m̃ = | 1.249 25
|
| Size of LCC | N = | 40,854
|
| Size of LSCC | Ns = | 617
|
| Relative size of LSCC | Nrs = | 0.015 051 4
|
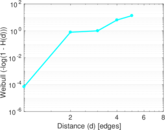
| Diameter | δ = | 7
|
| 50-Percentile effective diameter | δ0.5 = | 1.918 56
|
| 90-Percentile effective diameter | δ0.9 = | 3.734 08
|
| Median distance | δM = | 2
|
| Mean distance | δm = | 2.828 47
|
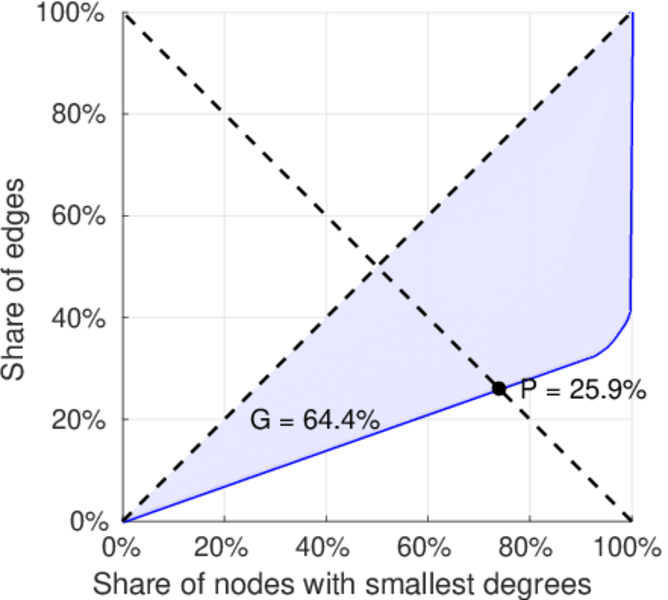
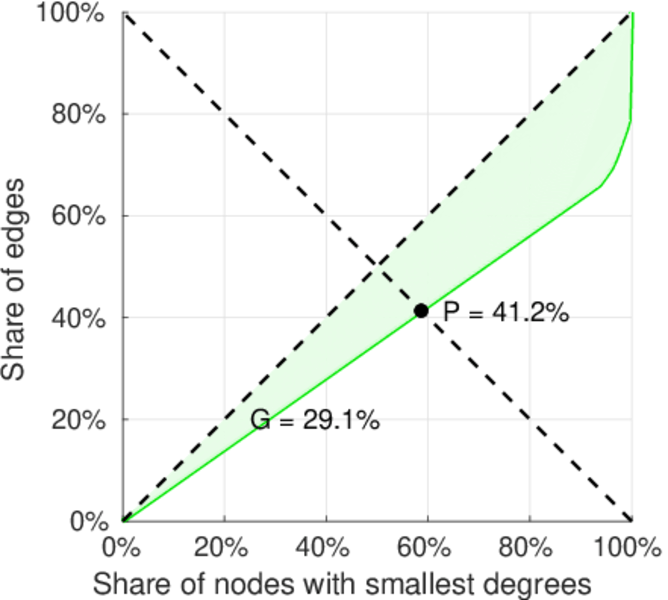
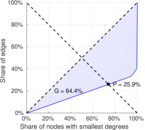
| Gini coefficient | G = | 0.643 616
|
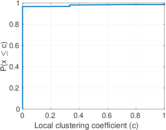
| Balanced inequality ratio | P = | 0.259 196
|
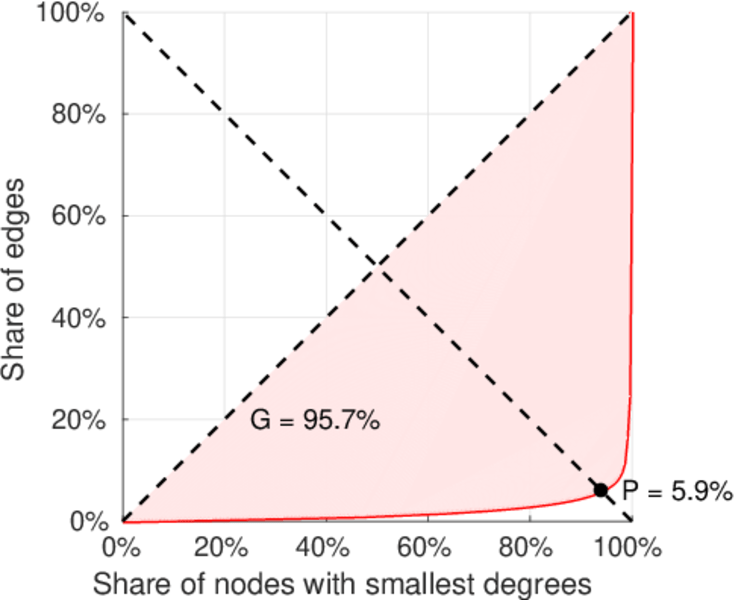
| Outdegree balanced inequality ratio | P+ = | 0.059 446 0
|
| Indegree balanced inequality ratio | P− = | 0.411 906
|
| Relative edge distribution entropy | Her = | 0.640 929
|
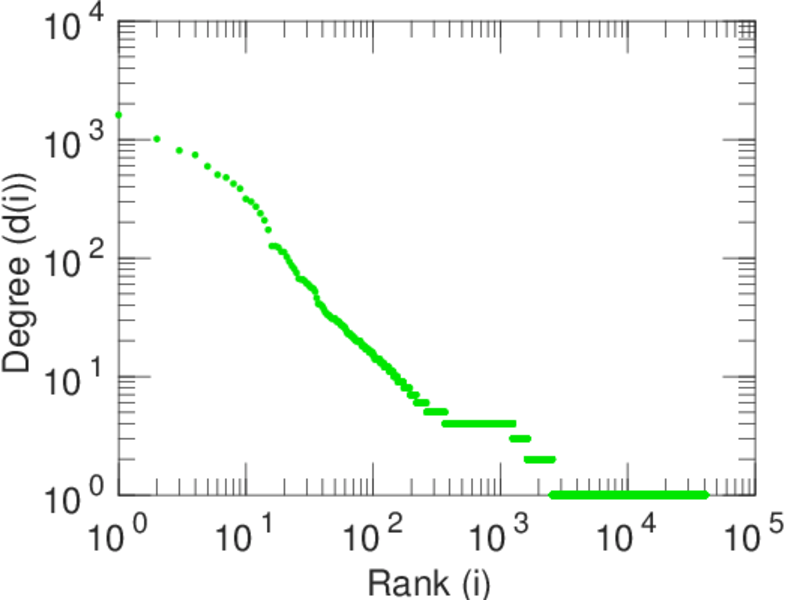
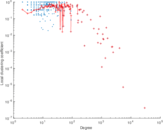
| Power law exponent | γ = | 16.004 6
|
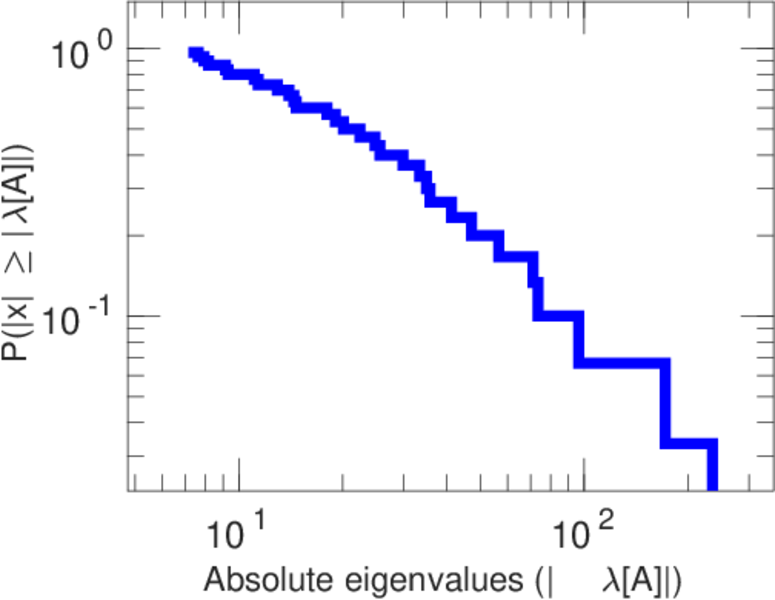
| Tail power law exponent | γt = | 3.951 00
|
| Tail power law exponent with p | γ3 = | 3.951 00
|
| p-value | p = | 0.000 00
|
| Outdegree tail power law exponent with p | γ3,o = | 2.081 00
|
| Outdegree p-value | po = | 0.000 00
|
| Indegree tail power law exponent with p | γ3,i = | 4.131 00
|
| Indegree p-value | pi = | 0.000 00
|
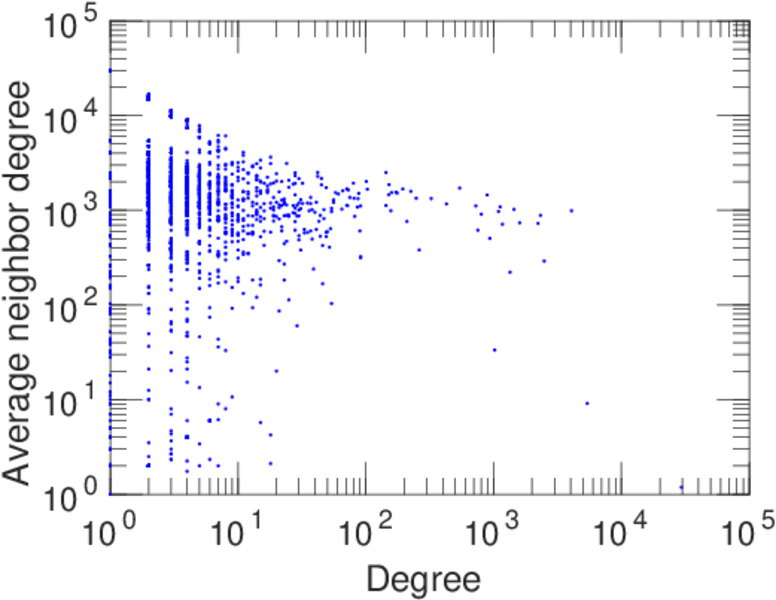
| Degree assortativity | ρ = | −0.546 059
|
| Degree assortativity p-value | pρ = | 0.000 00
|
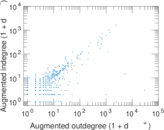
| In/outdegree correlation | ρ± = | +0.640 769
|
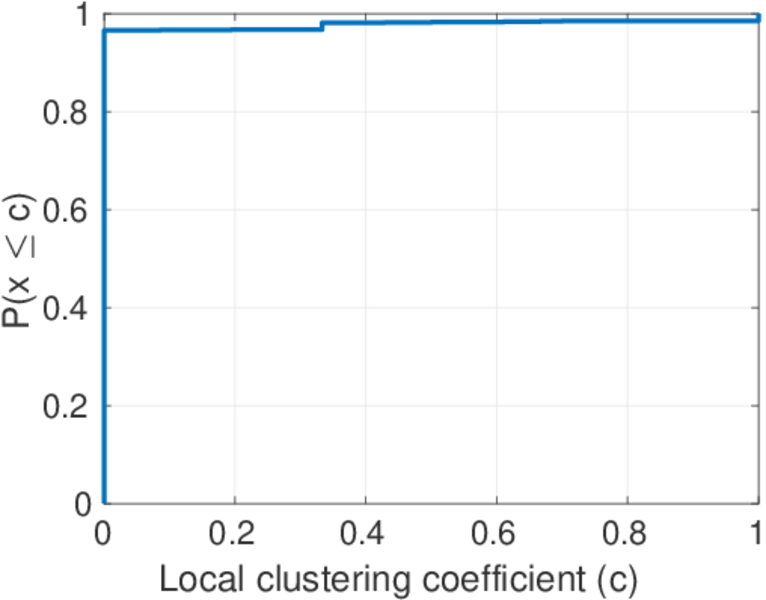
| Clustering coefficient | c = | 2.759 39 × 10−5
|
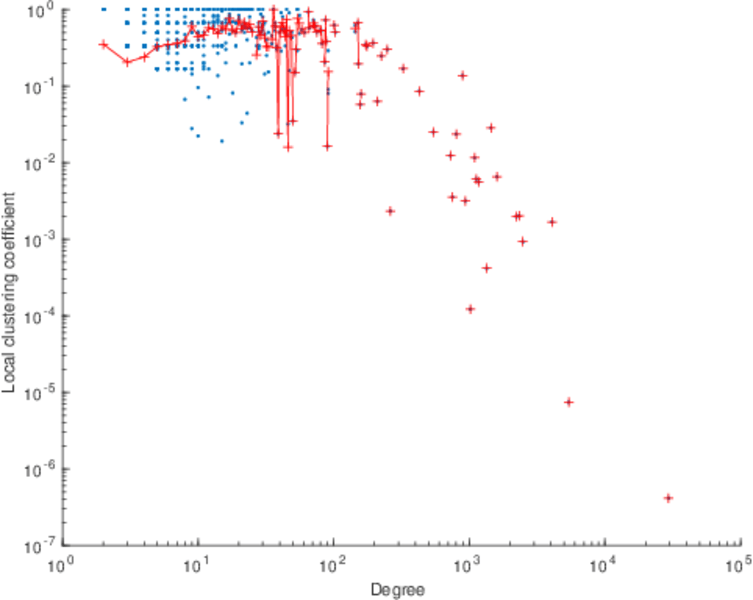
| Directed clustering coefficient | c± = | 0.017 571 5
|
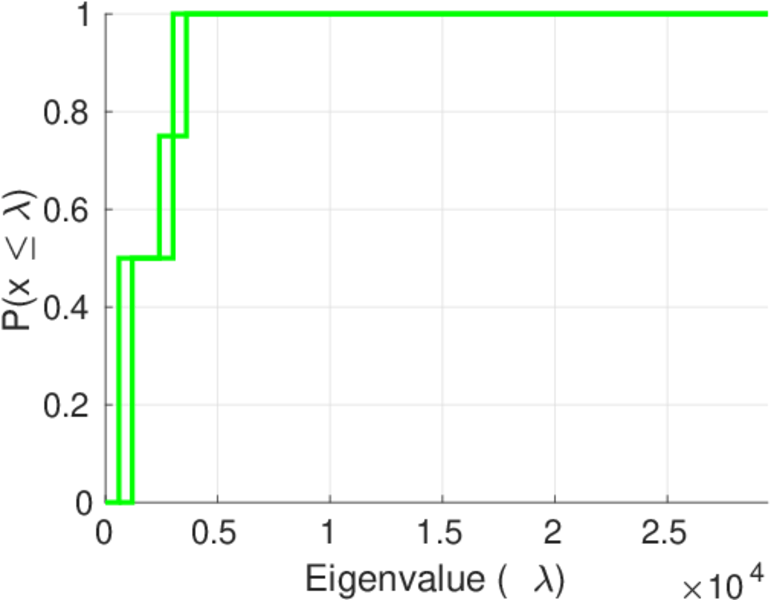
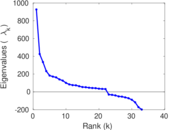
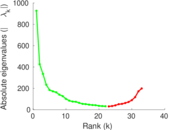
| Spectral norm | α = | 926.778
|
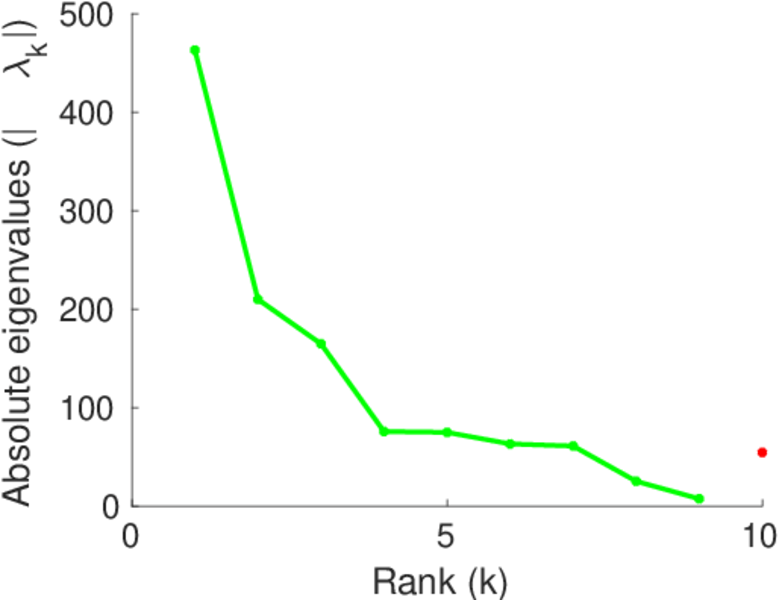
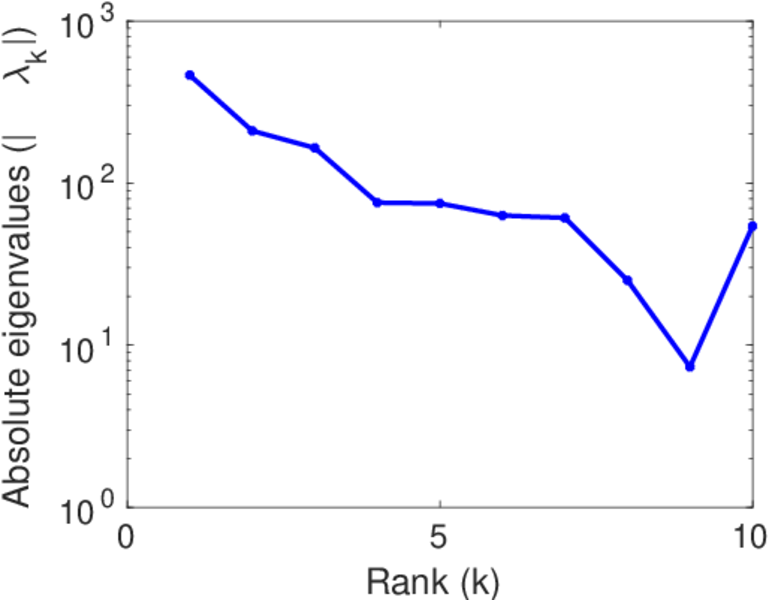
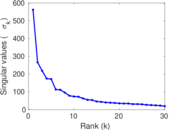
| Operator 2-norm | ν = | 473.976
|
| Cyclic eigenvalue | π = | 452.904
|
| Algebraic connectivity | a = | 0.015 719 6
|
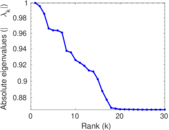
| Spectral separation | |λ1[A] / λ2[A]| = | 2.178 13
|
| Reciprocity | y = | 0.050 920 0
|
| Non-bipartivity | bA = | 0.785 650
|
| Normalized non-bipartivity | bN = | 0.003 538 48
|
| Algebraic non-bipartivity | χ = | 0.007 430 54
|
| Spectral bipartite frustration | bK = | 0.000 833 134
|
| Controllability | C = | 40,135
|
| Relative controllability | Cr = | 0.979 070
|
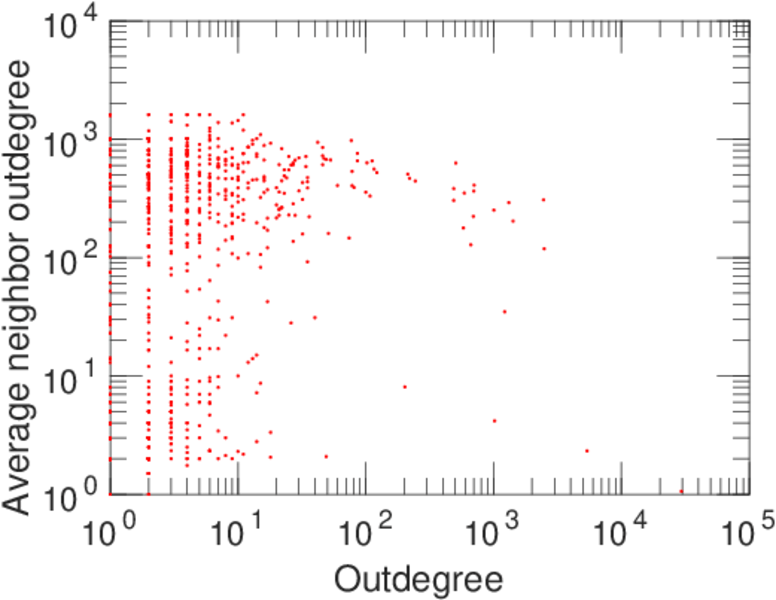
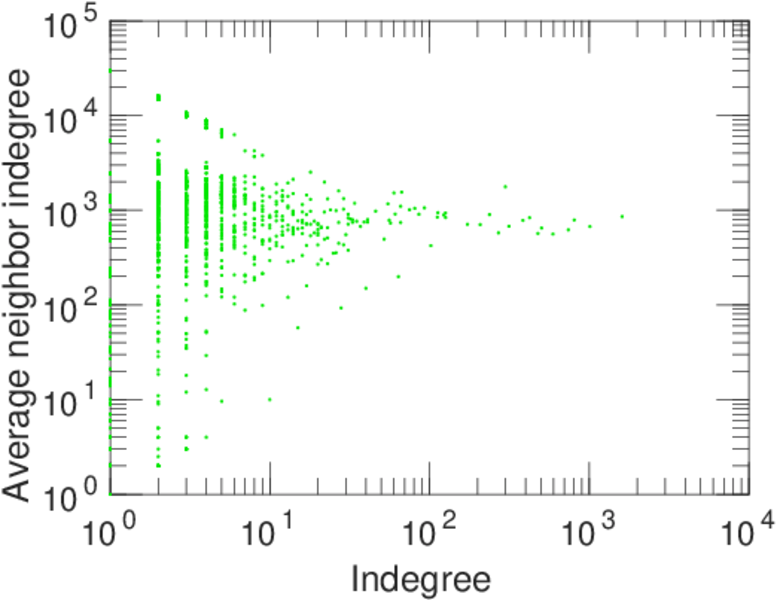
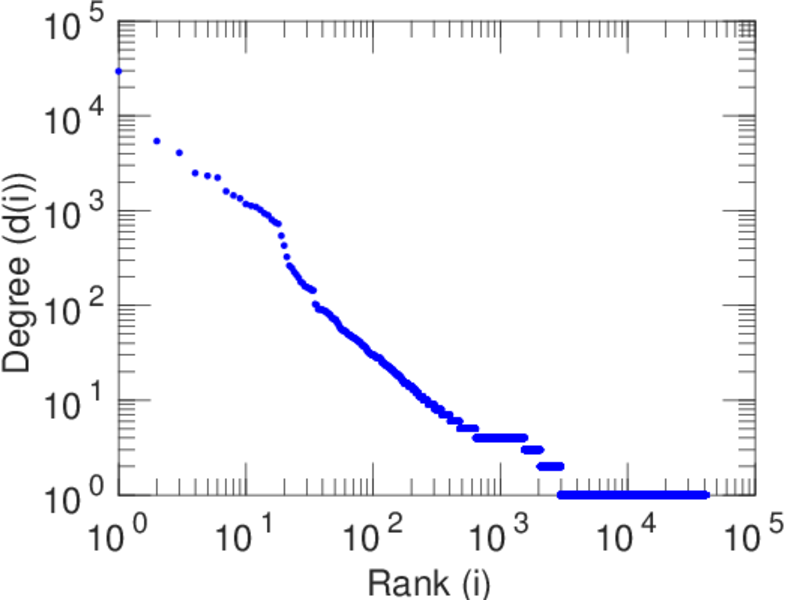
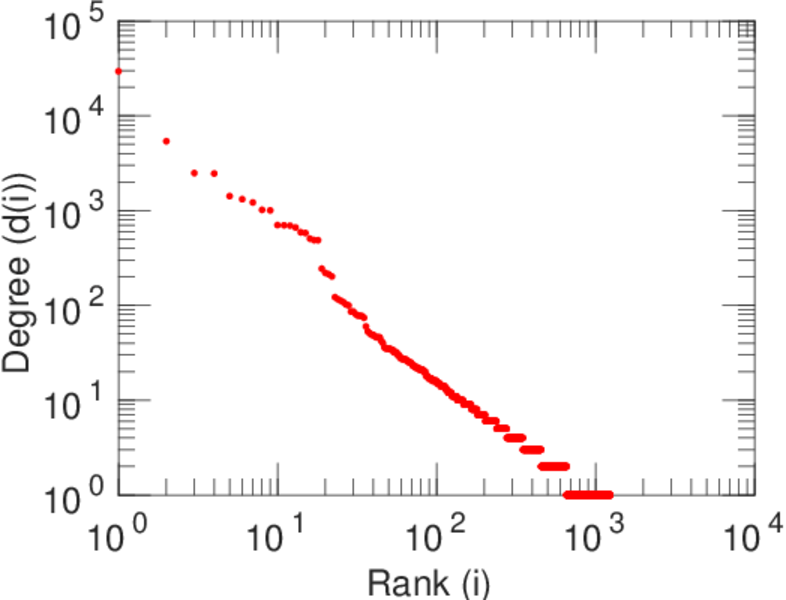
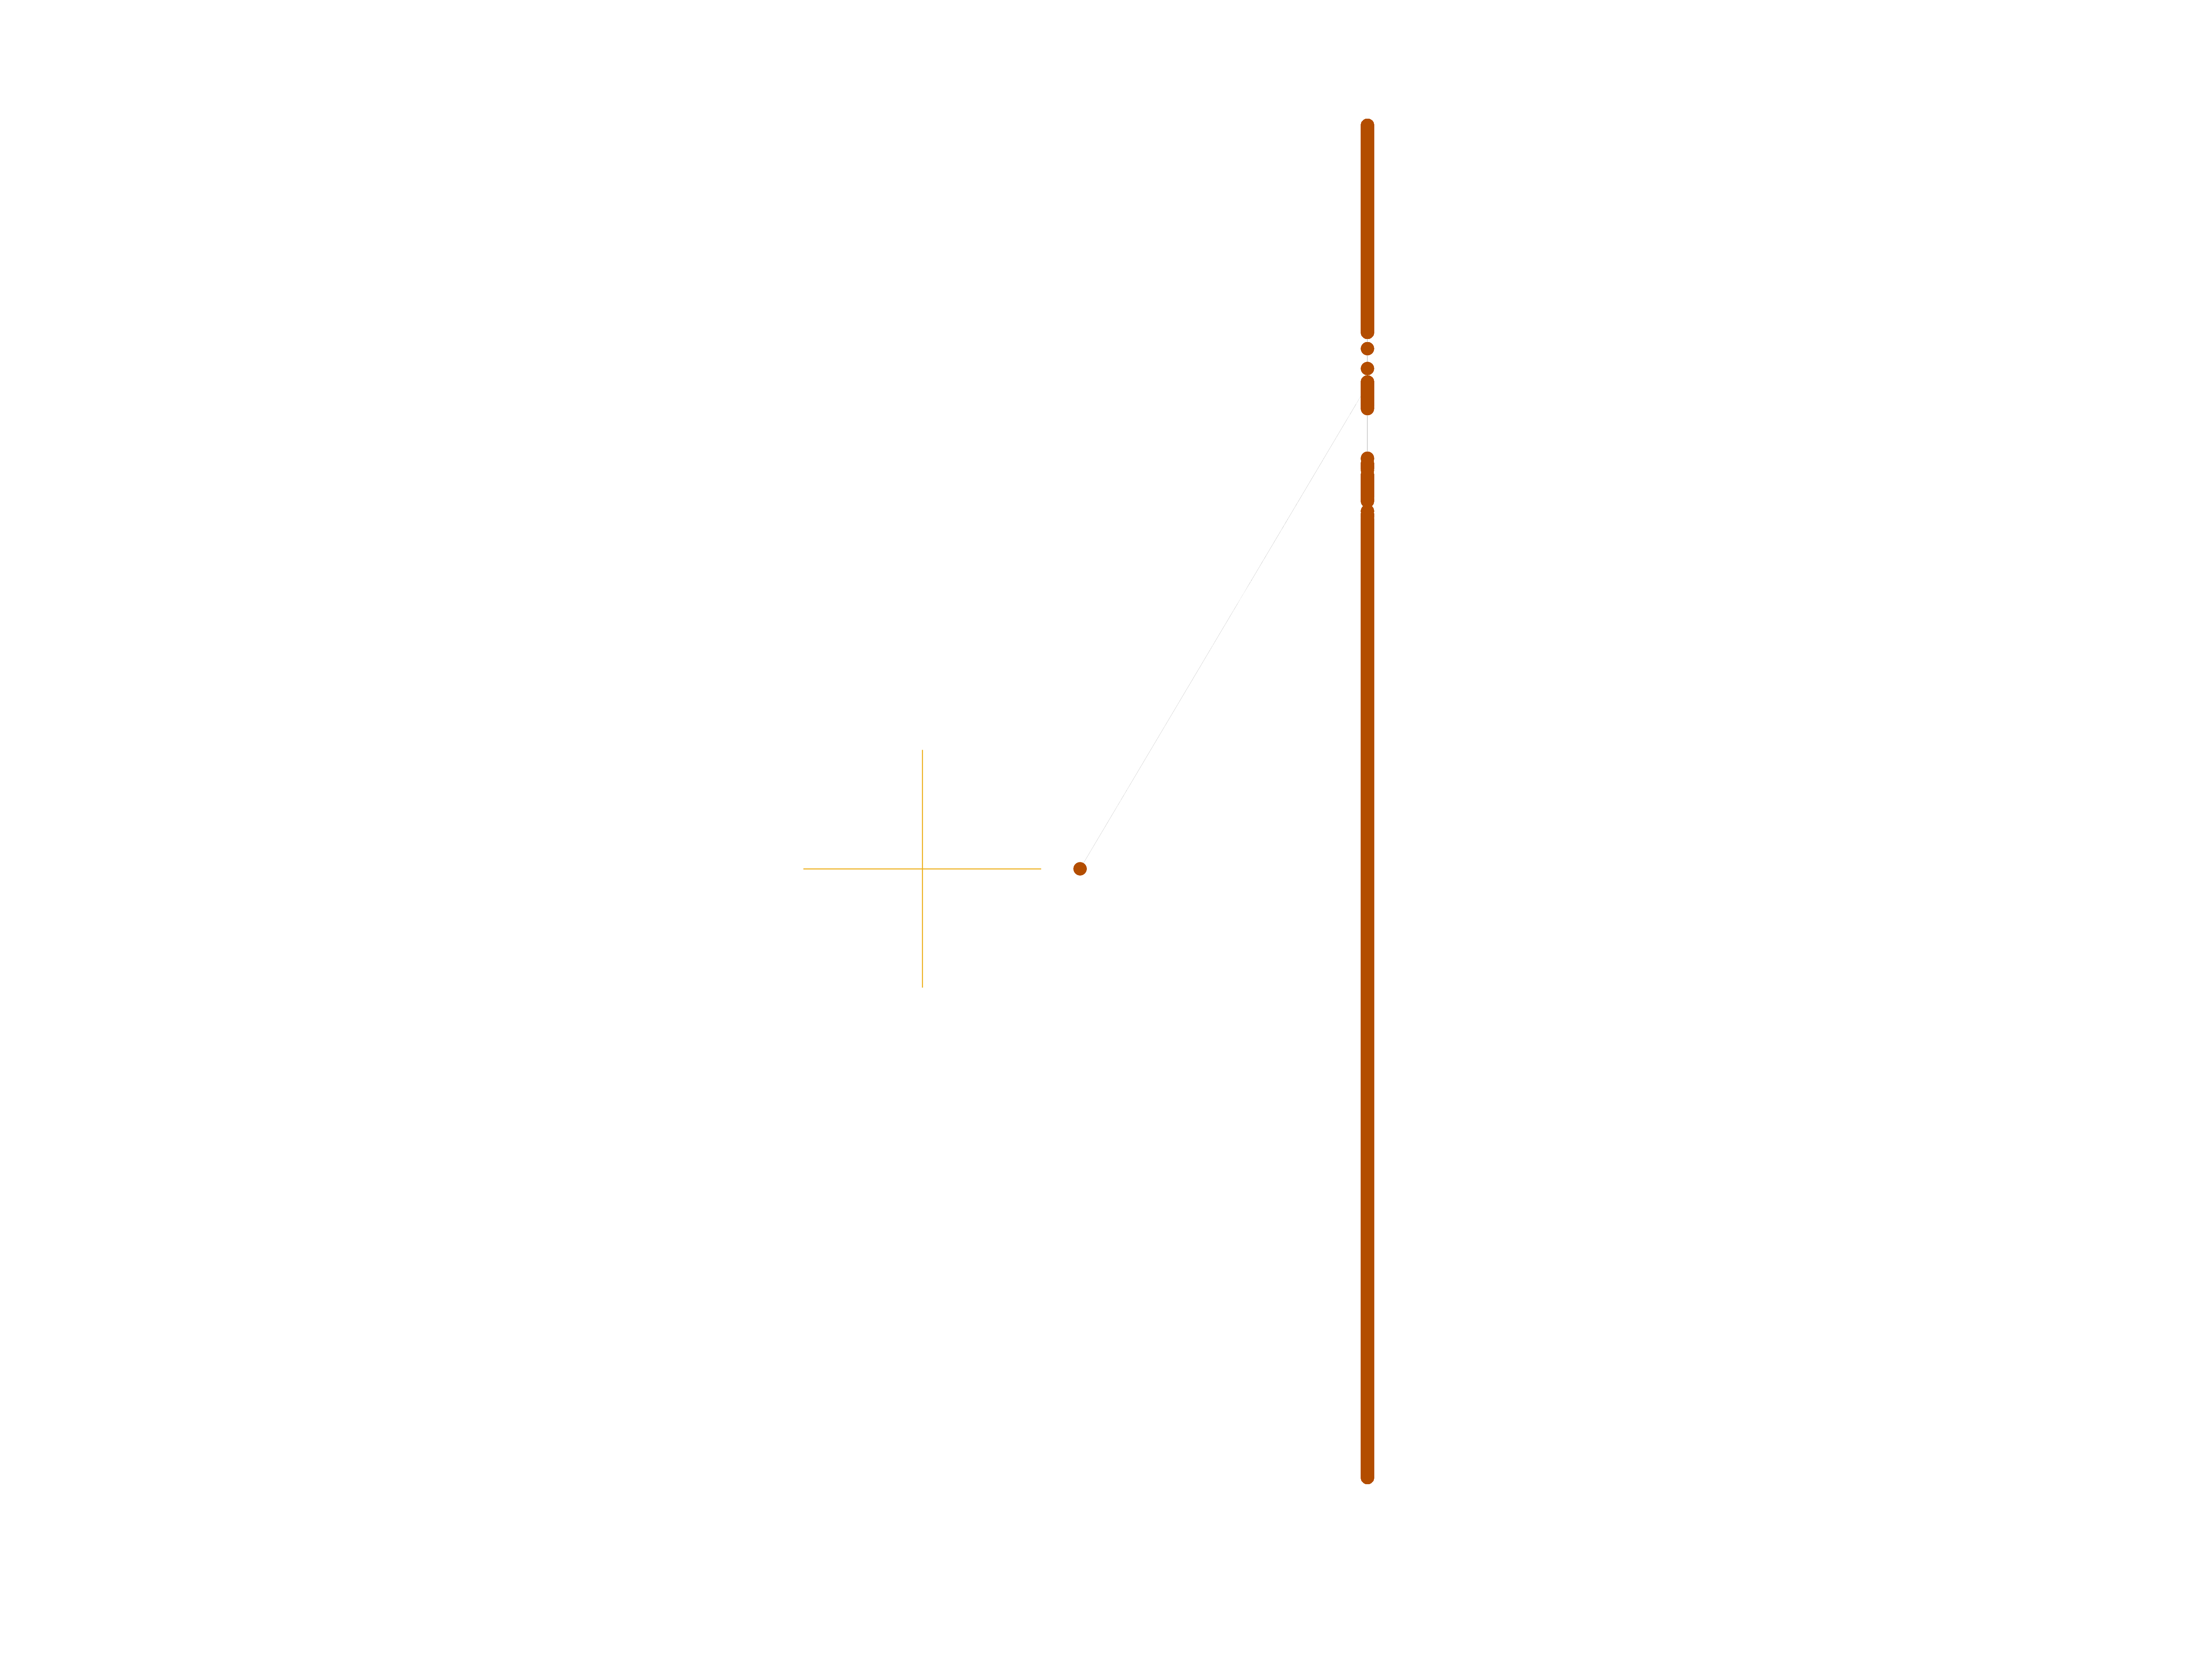
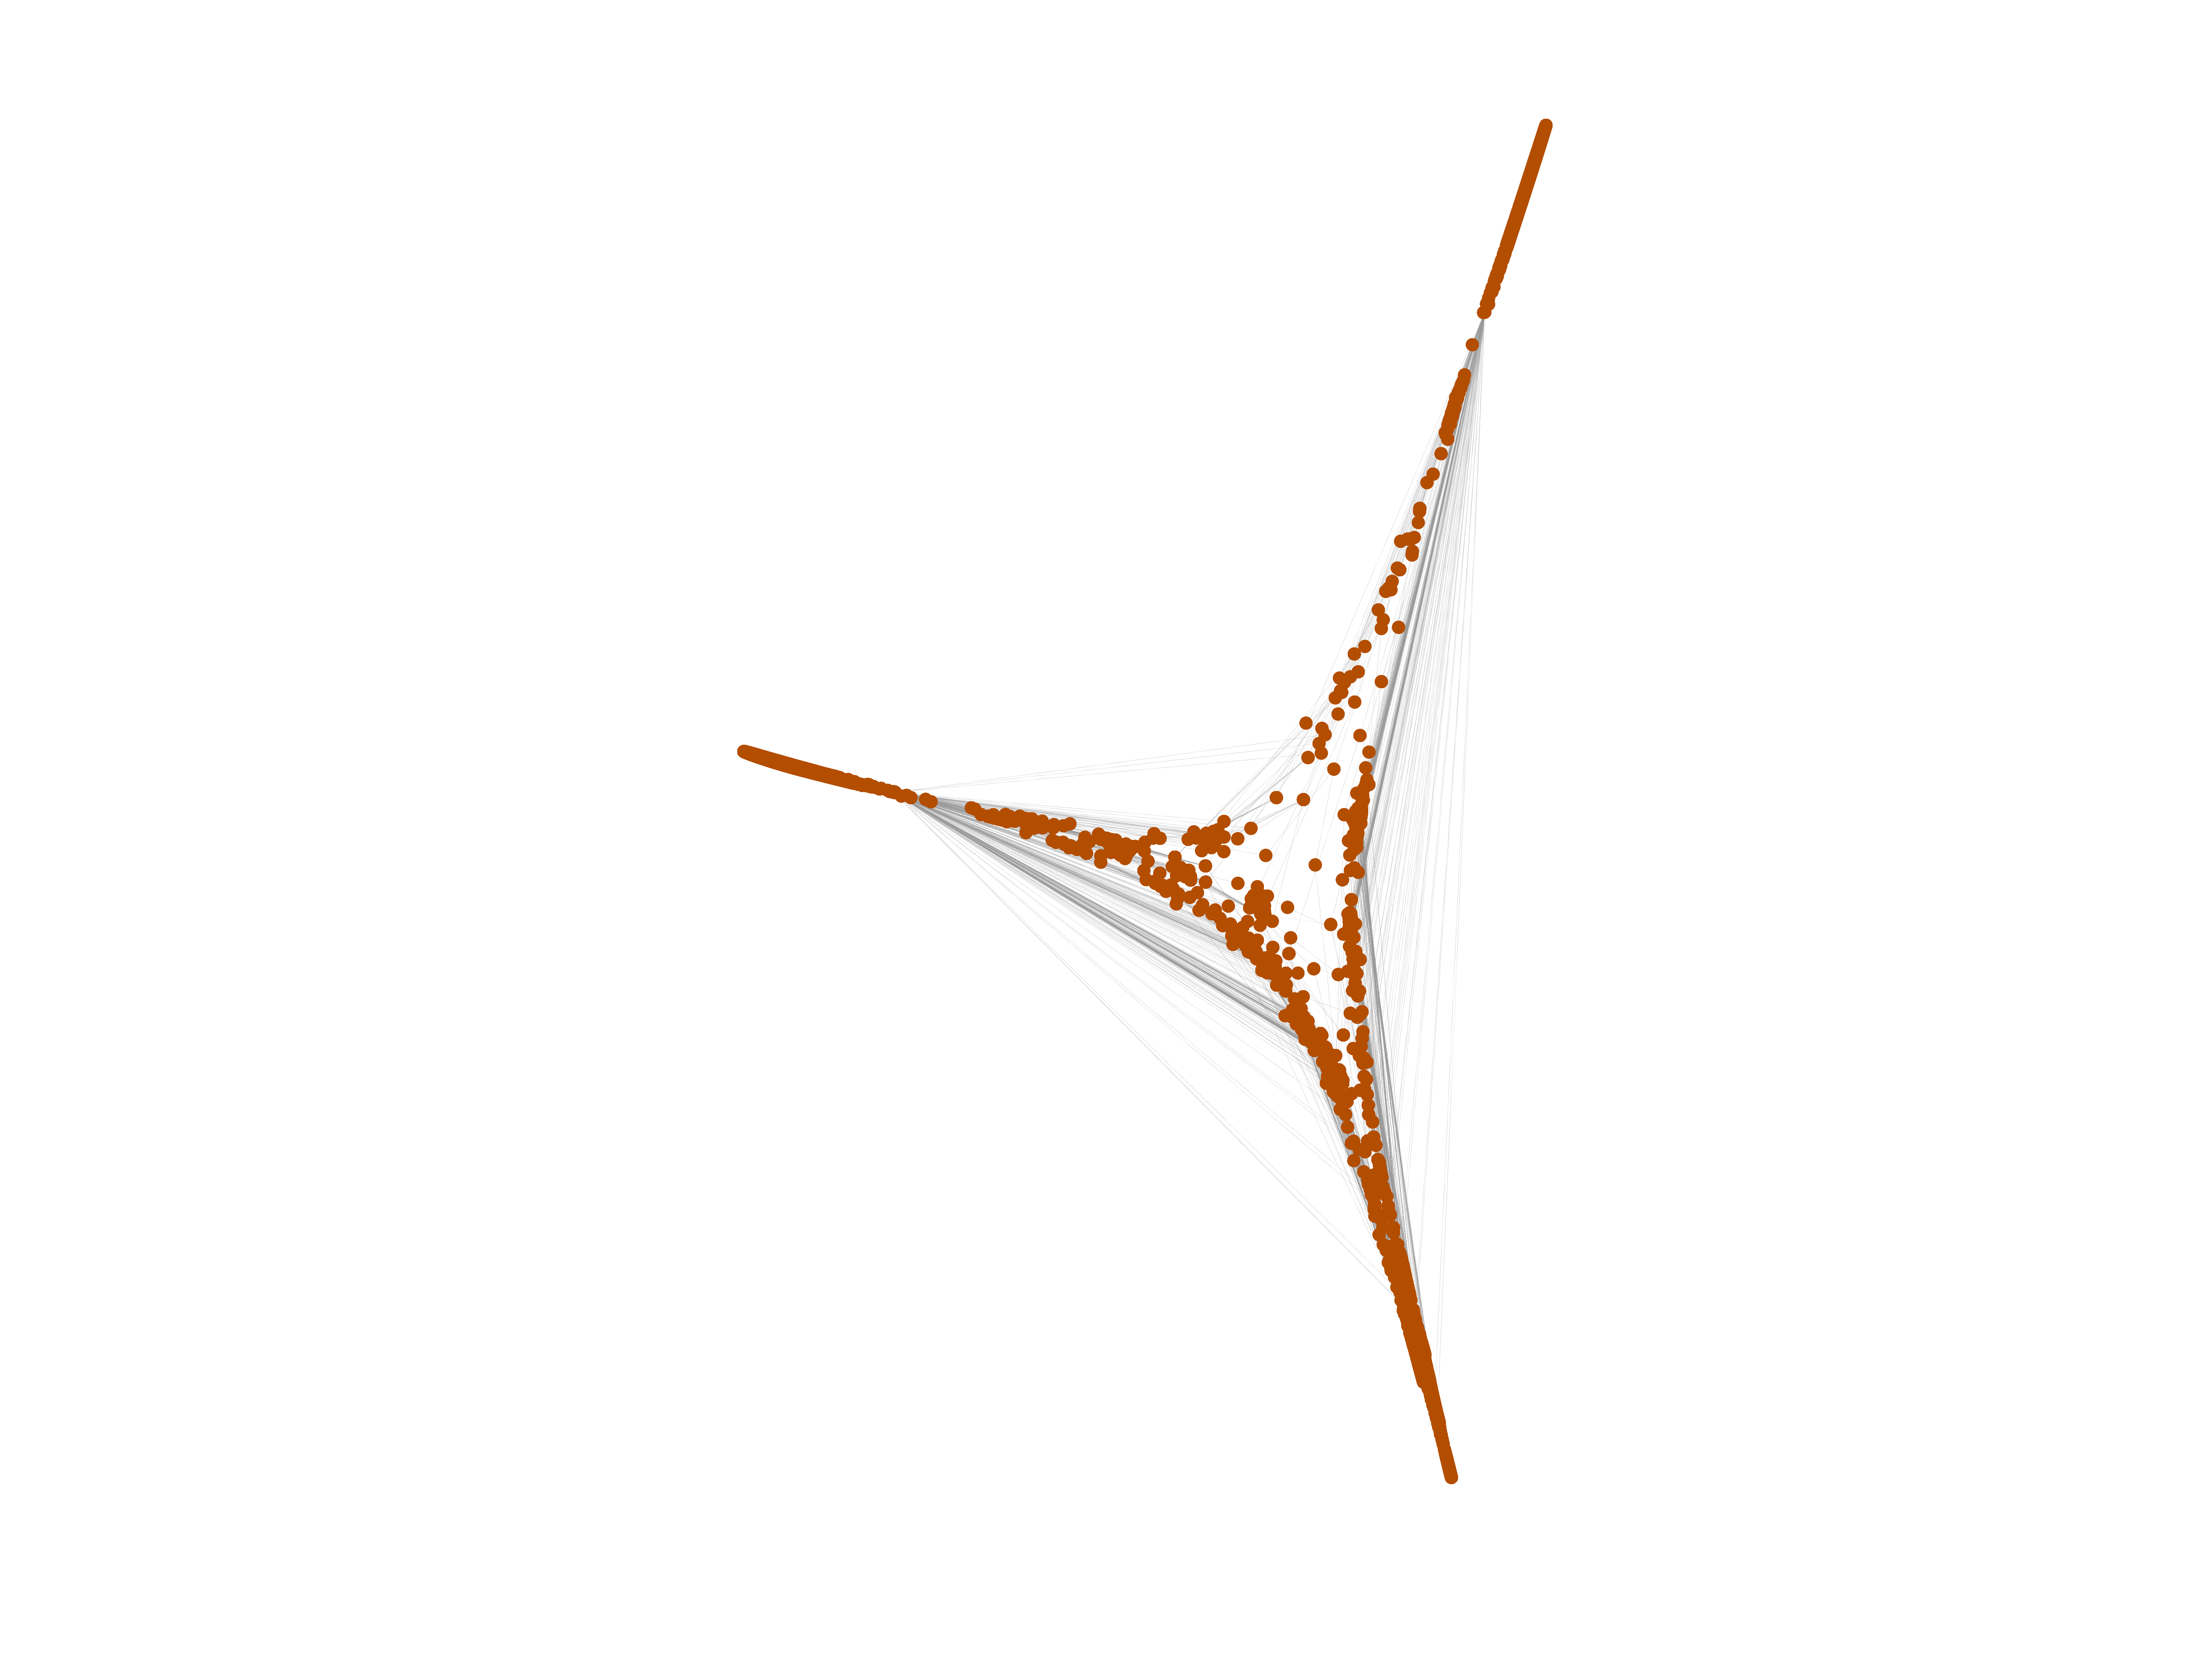
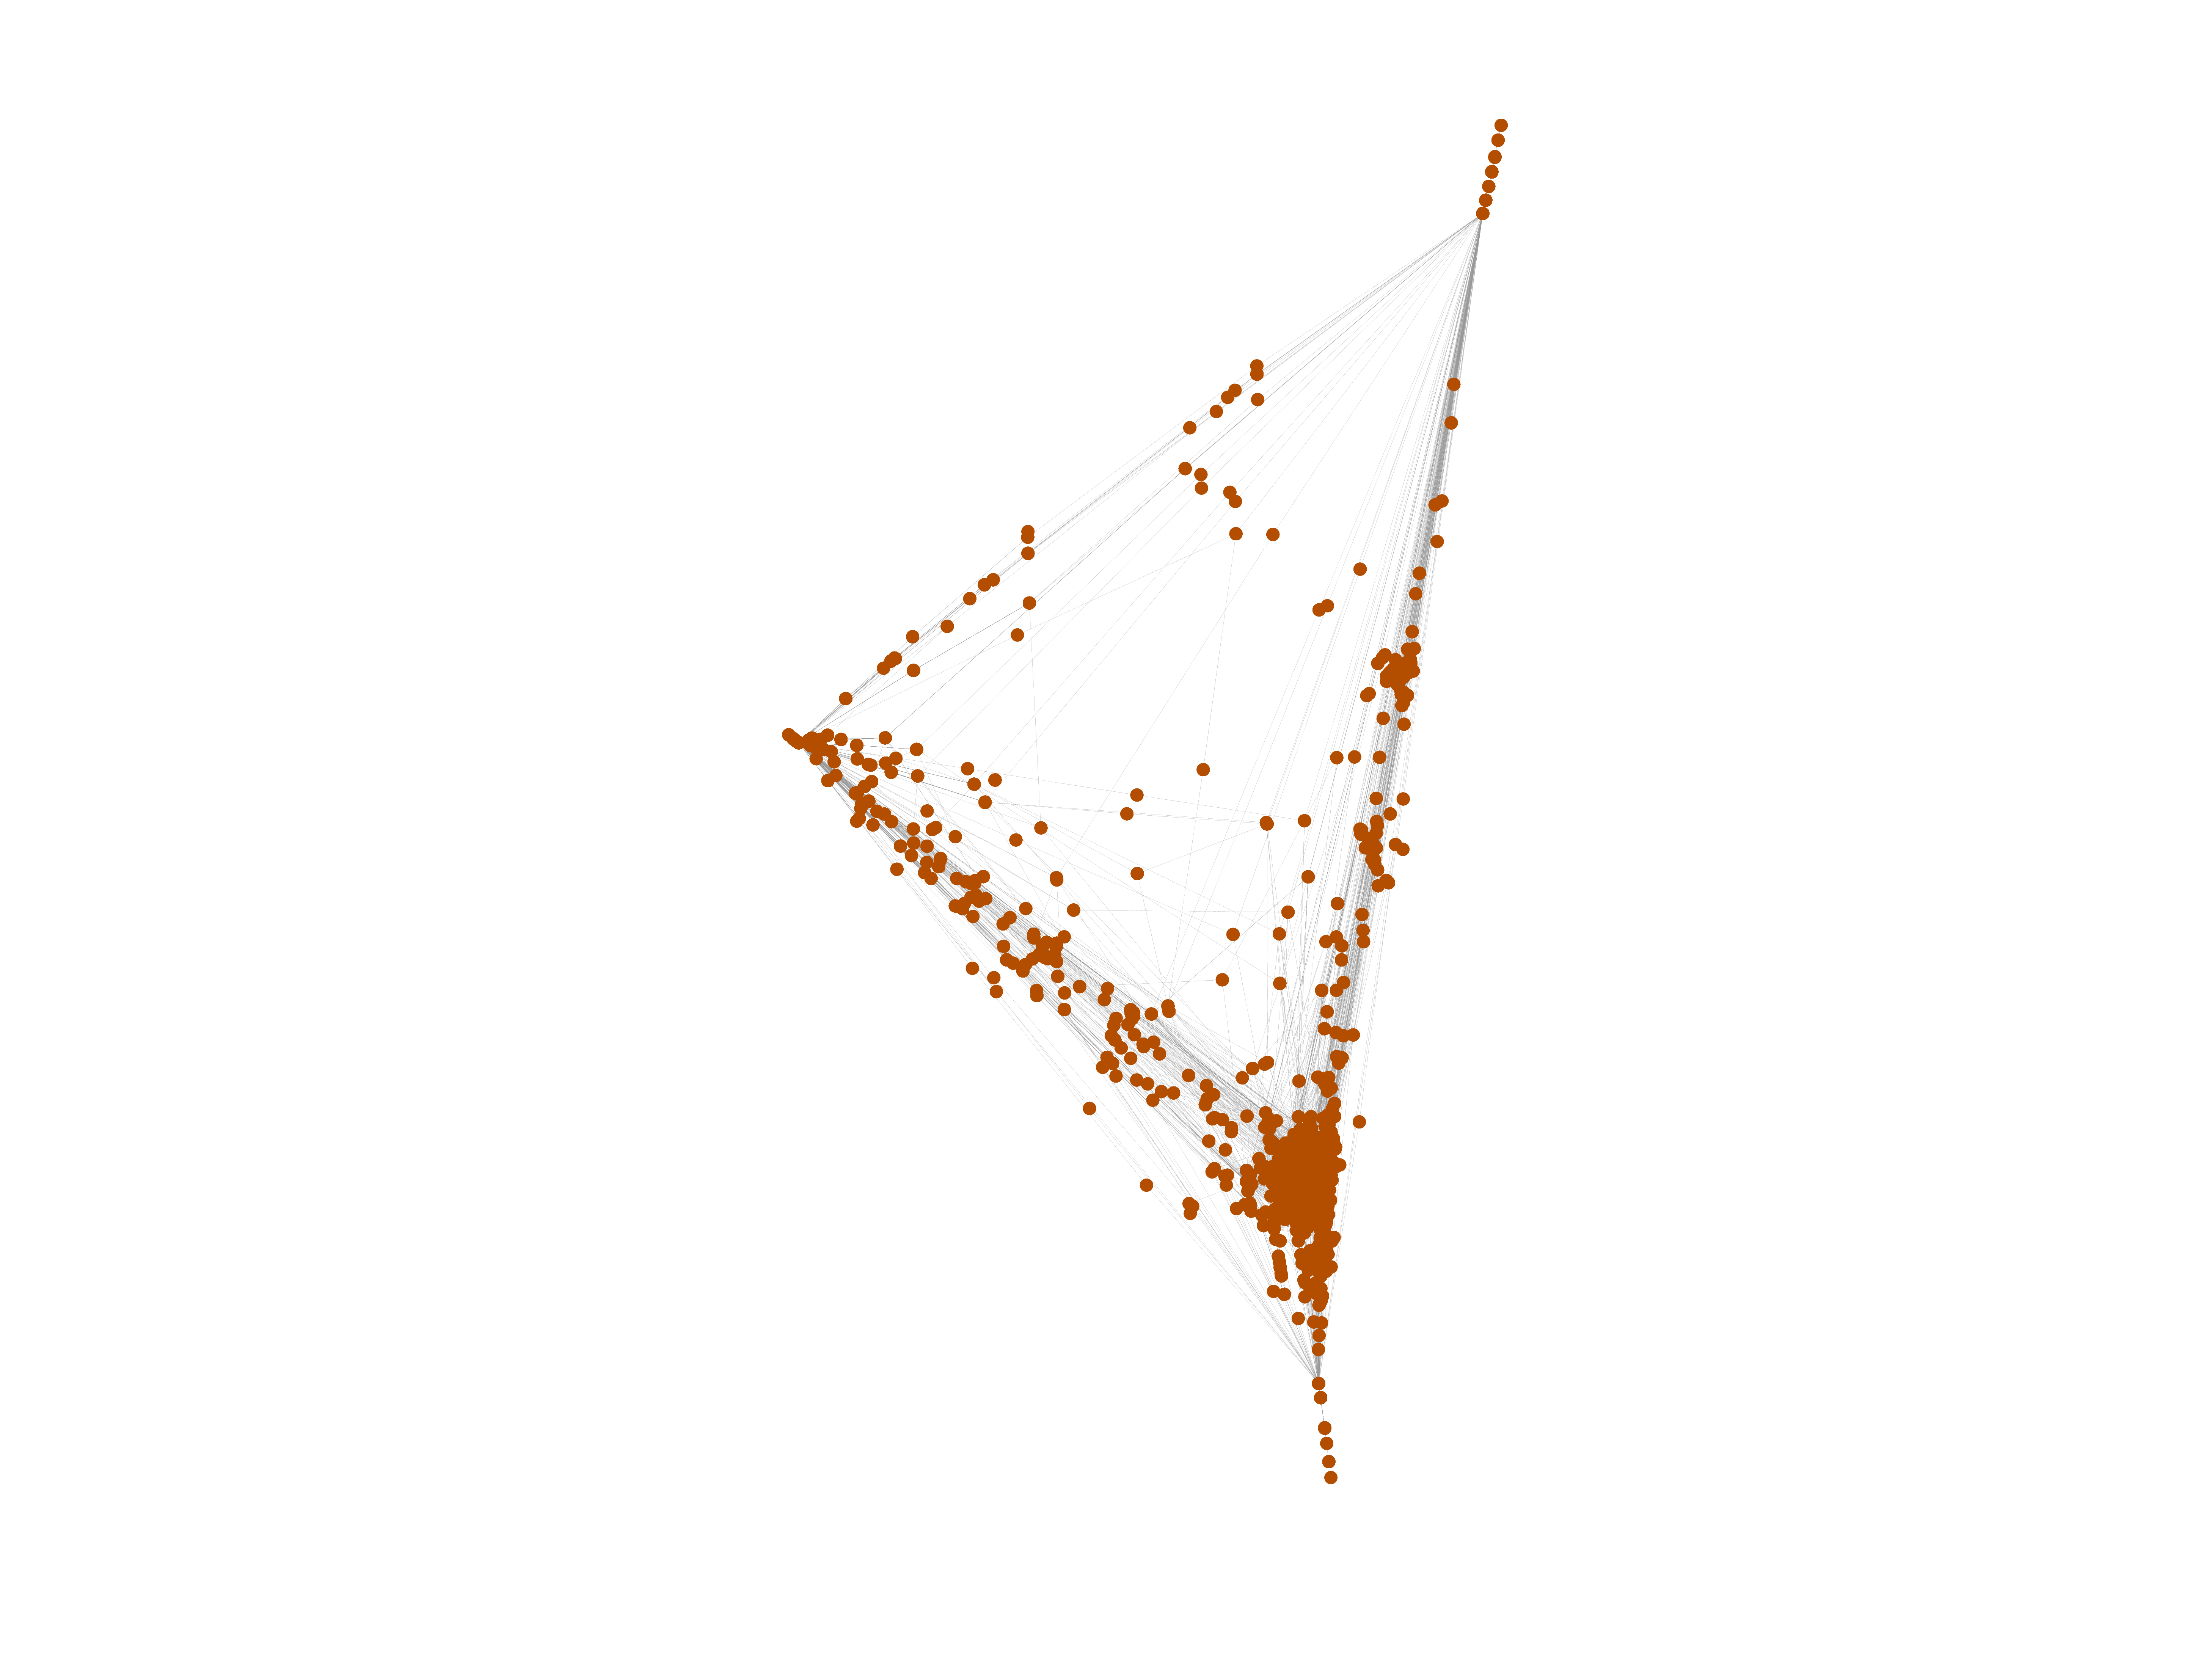
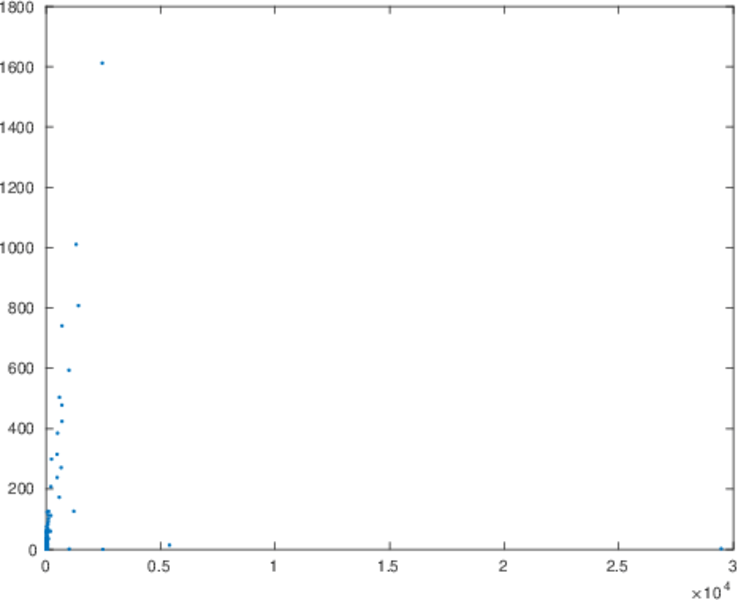
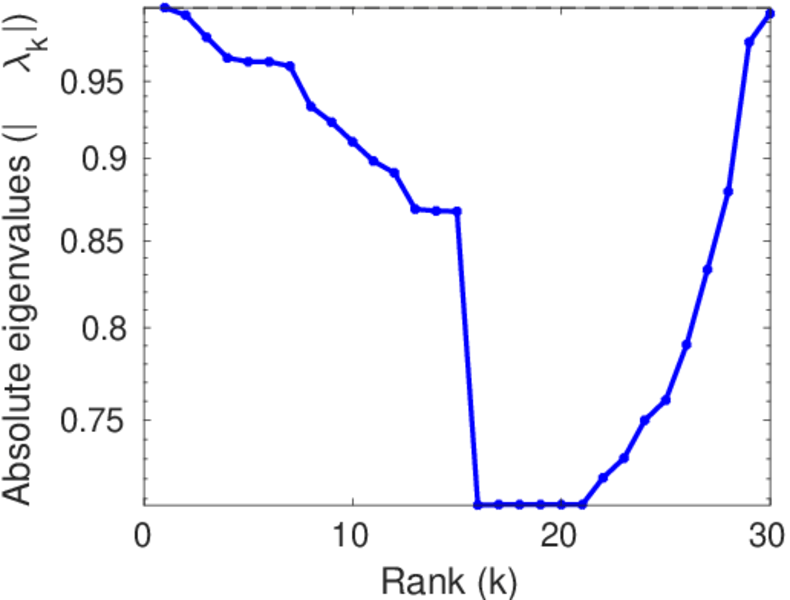
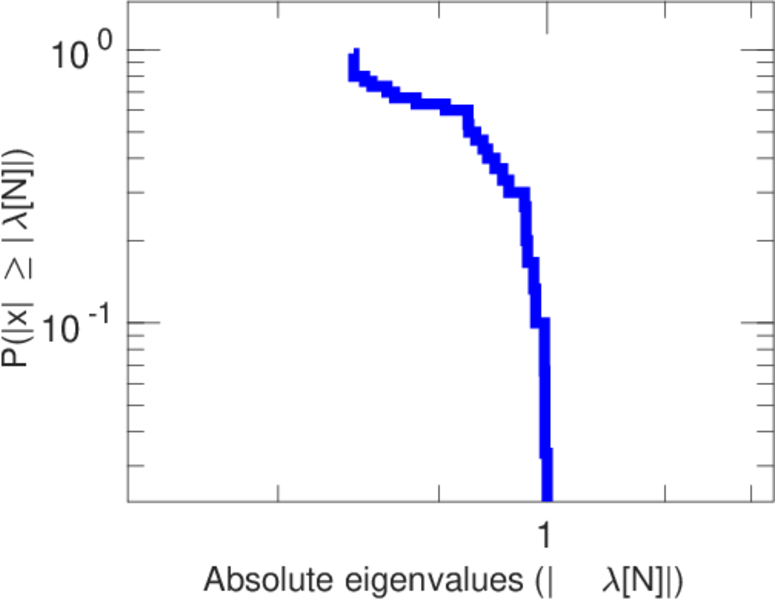
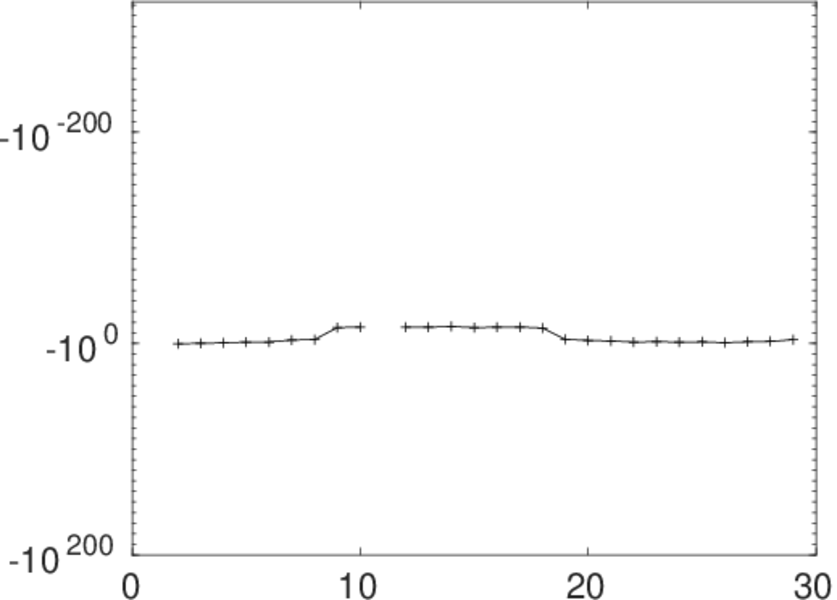
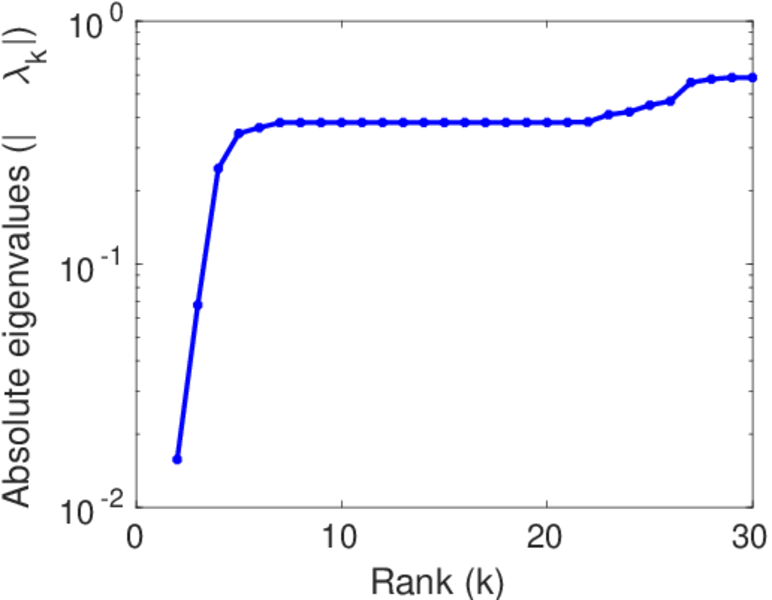
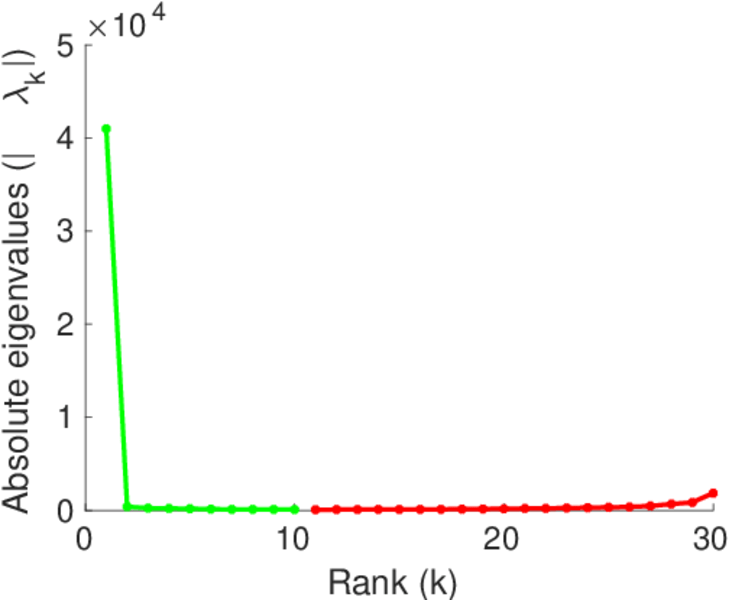
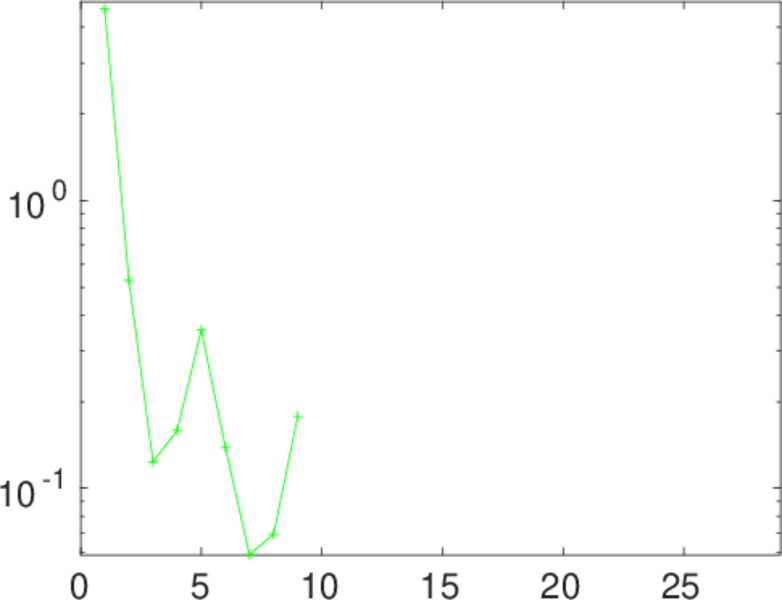
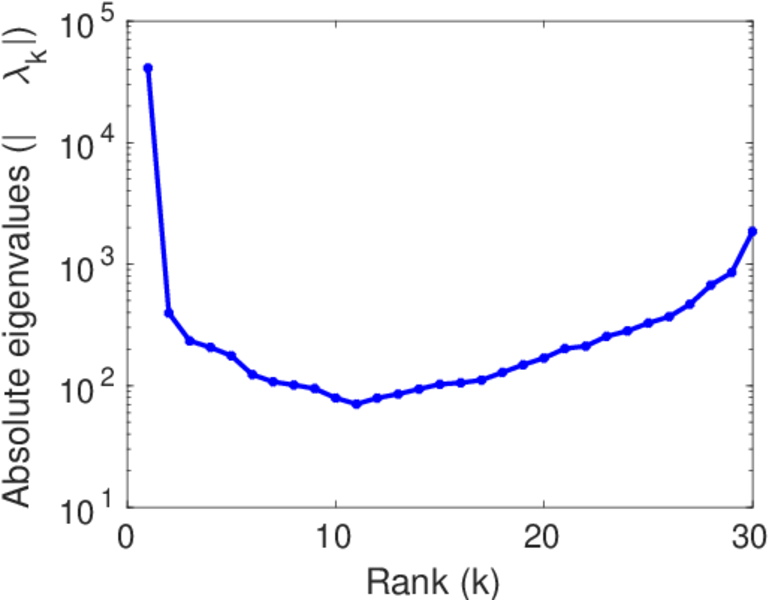
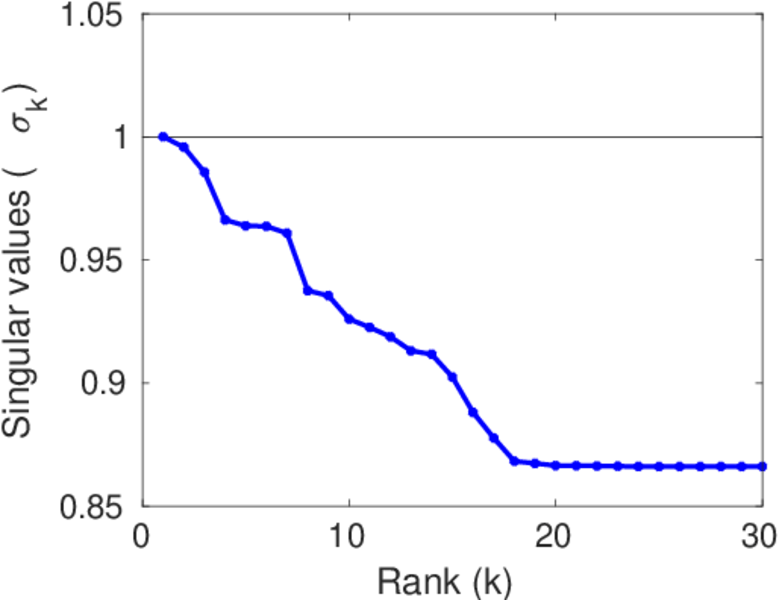
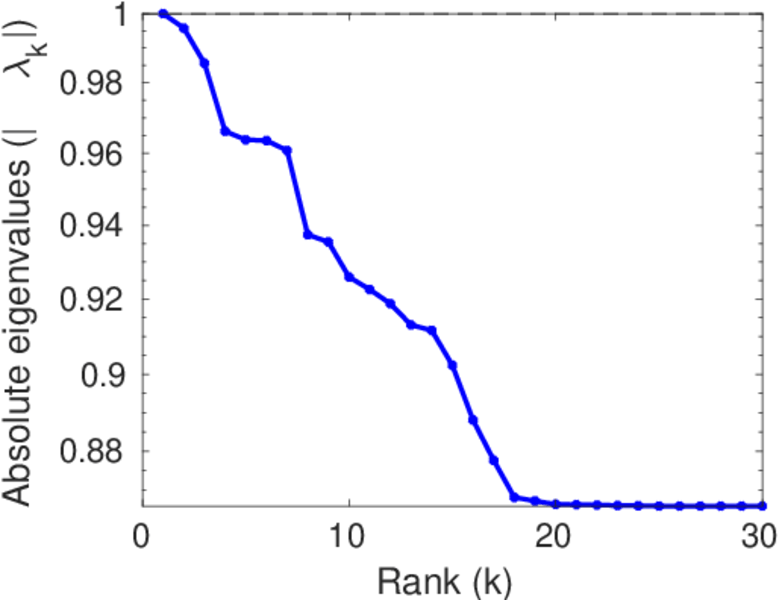
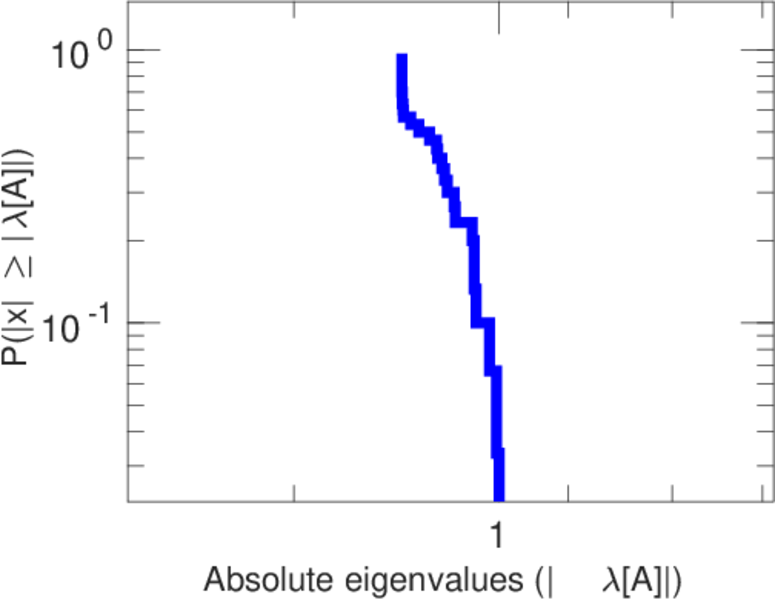
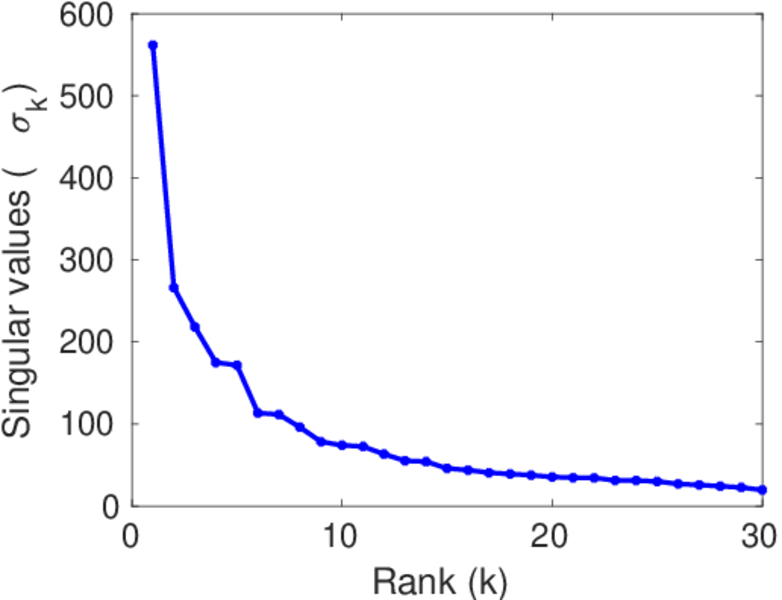
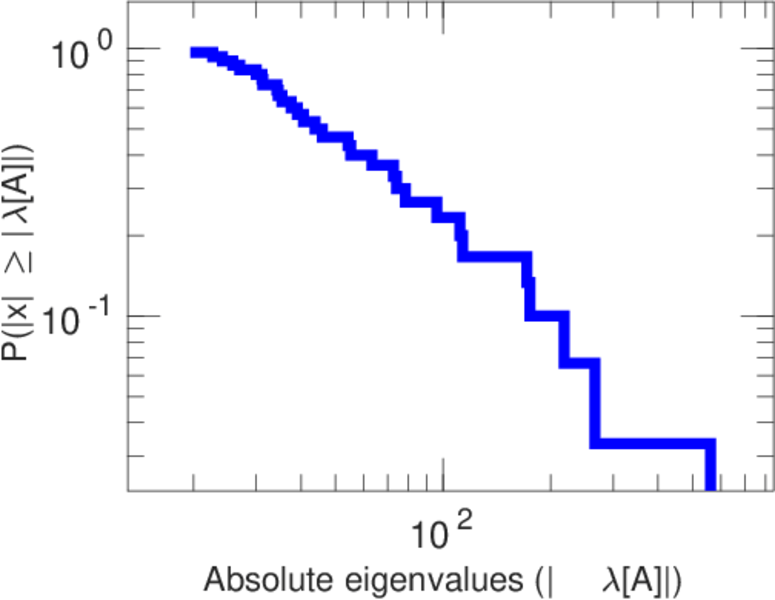
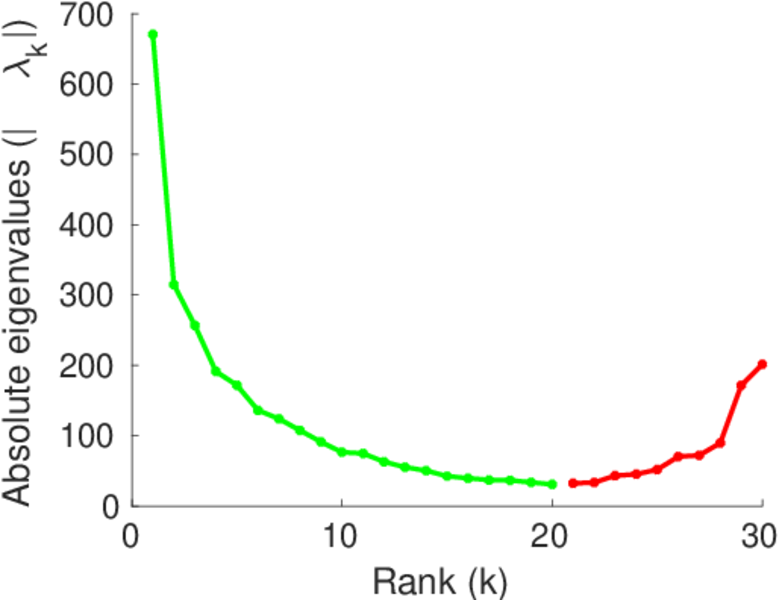
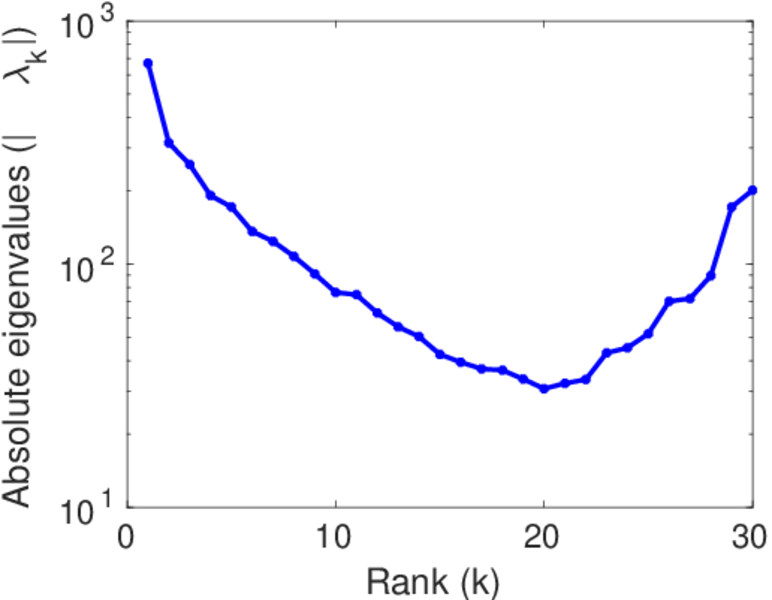
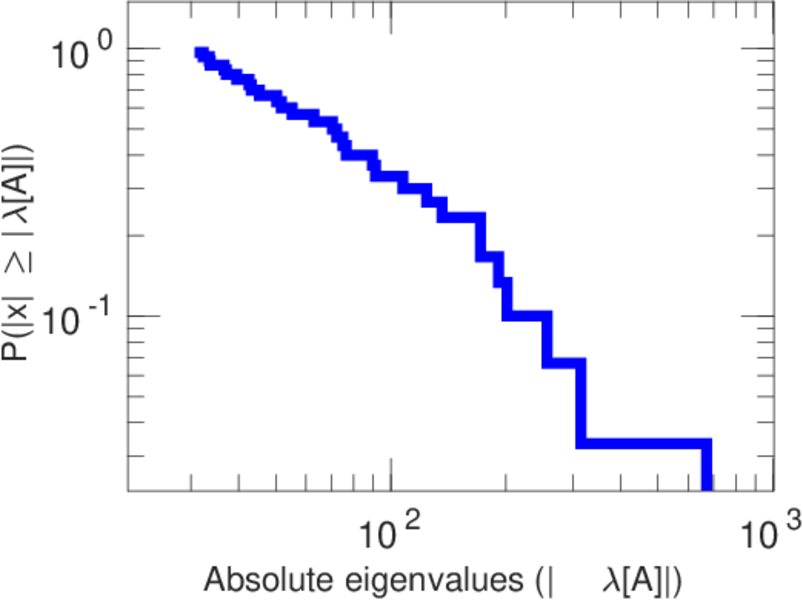
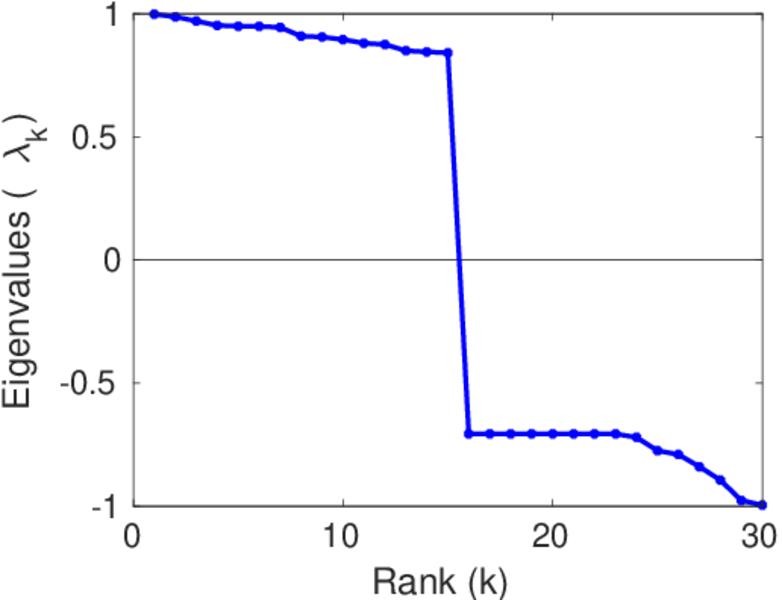
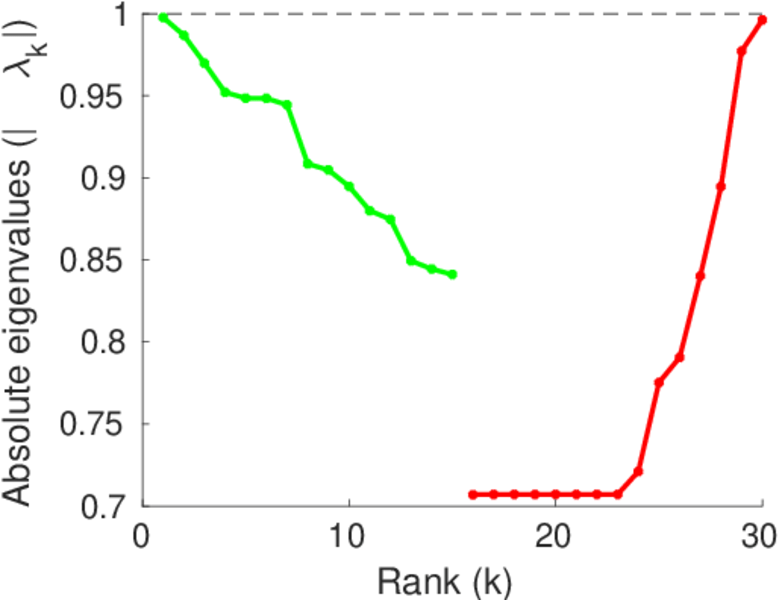
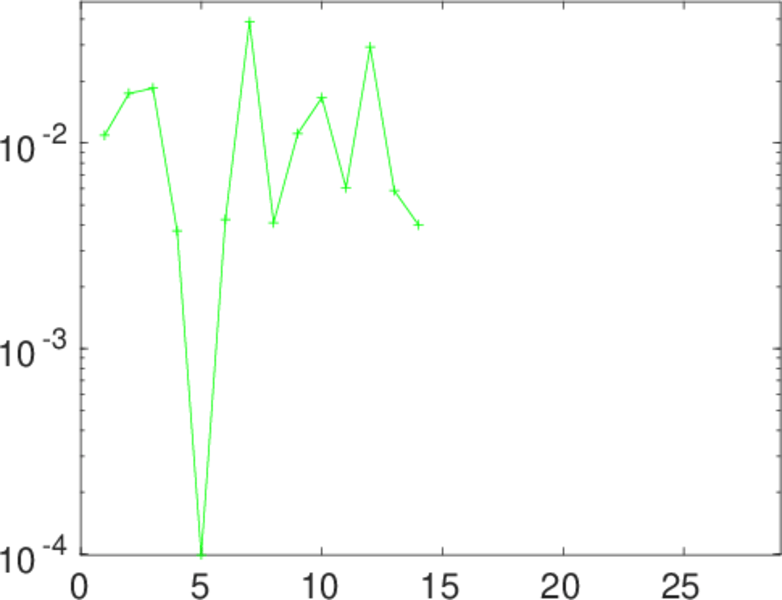
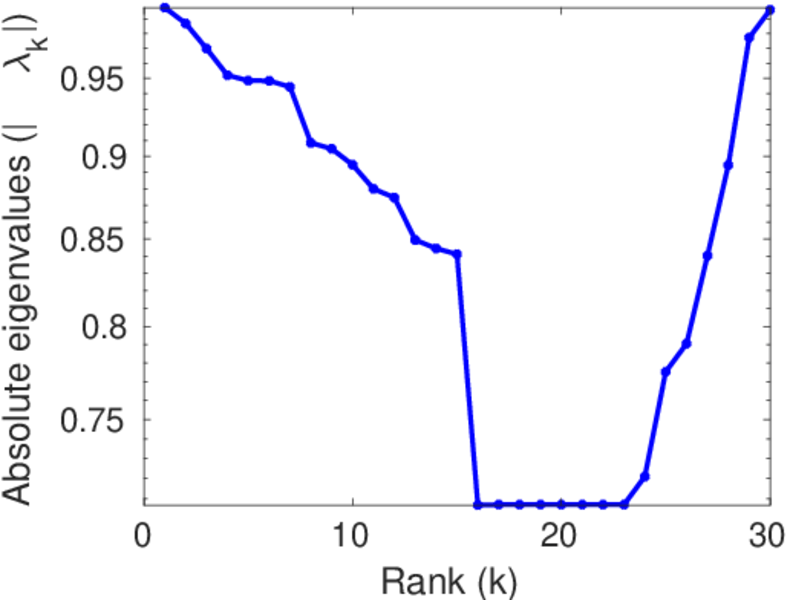
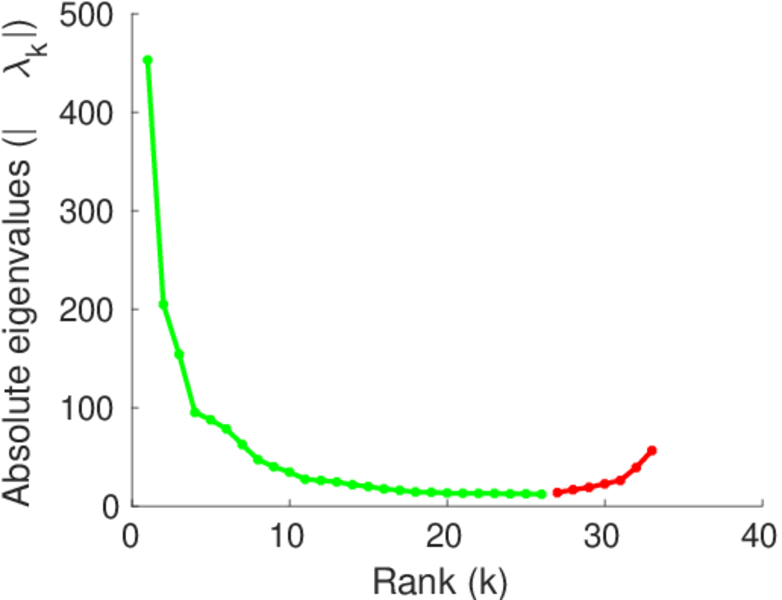
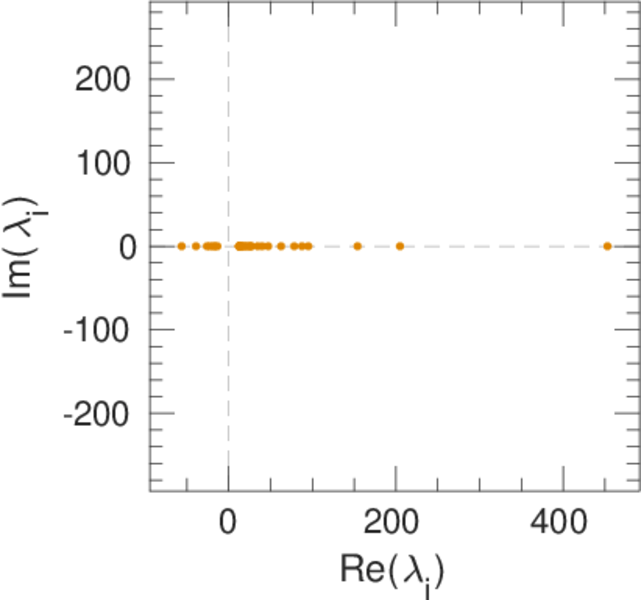
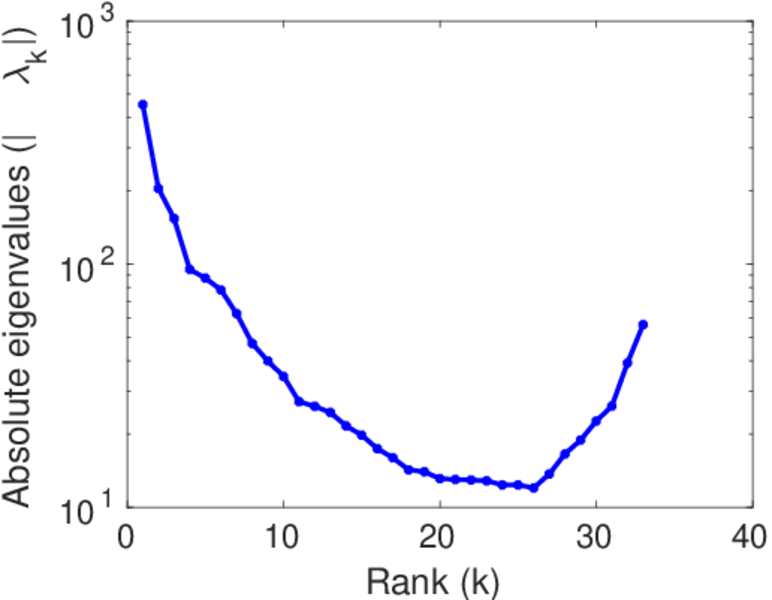
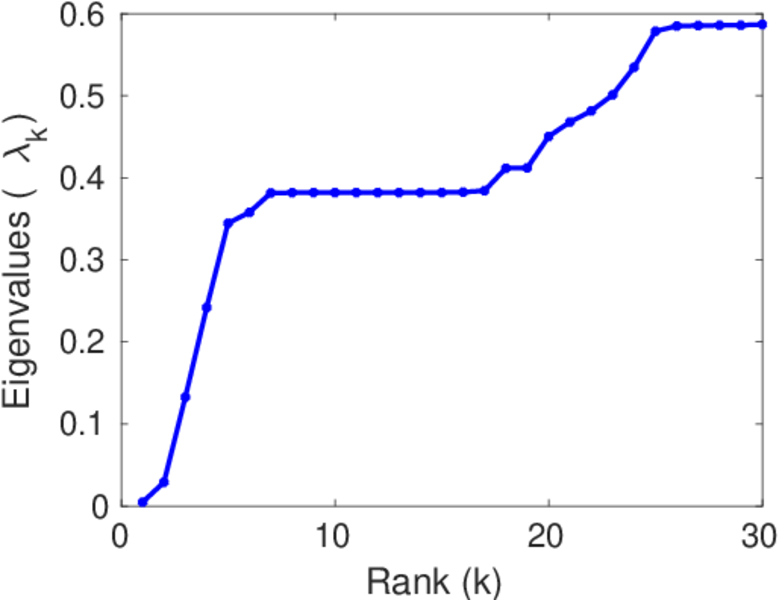
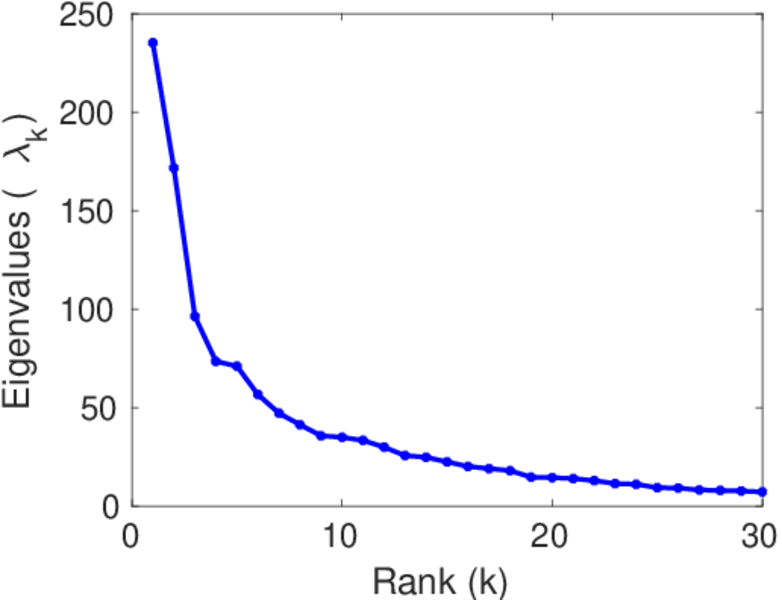
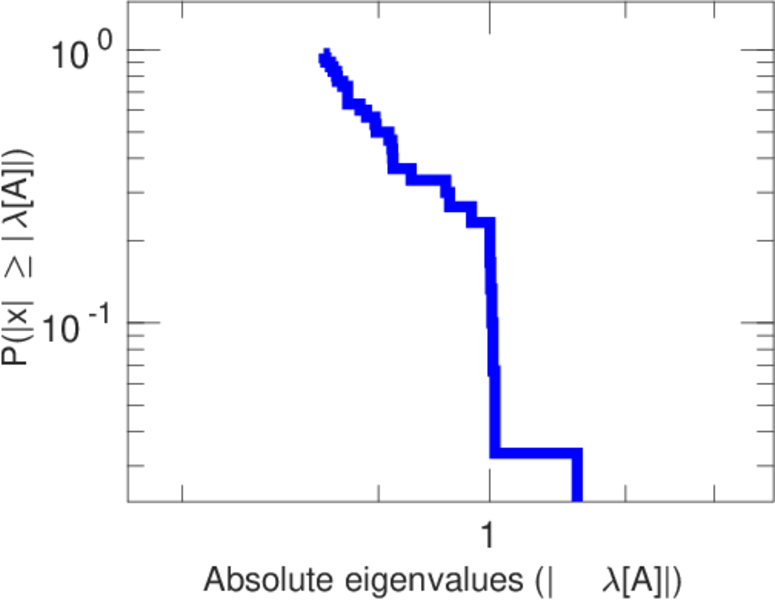
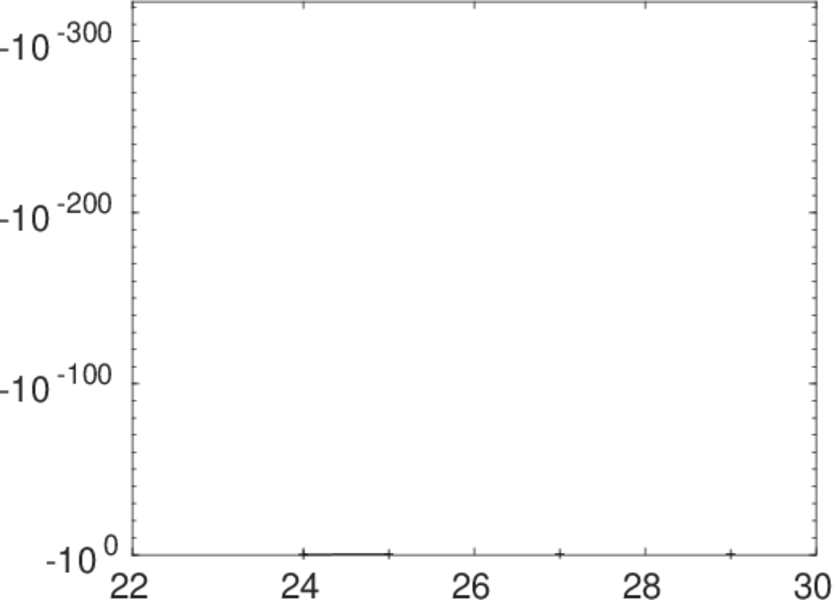
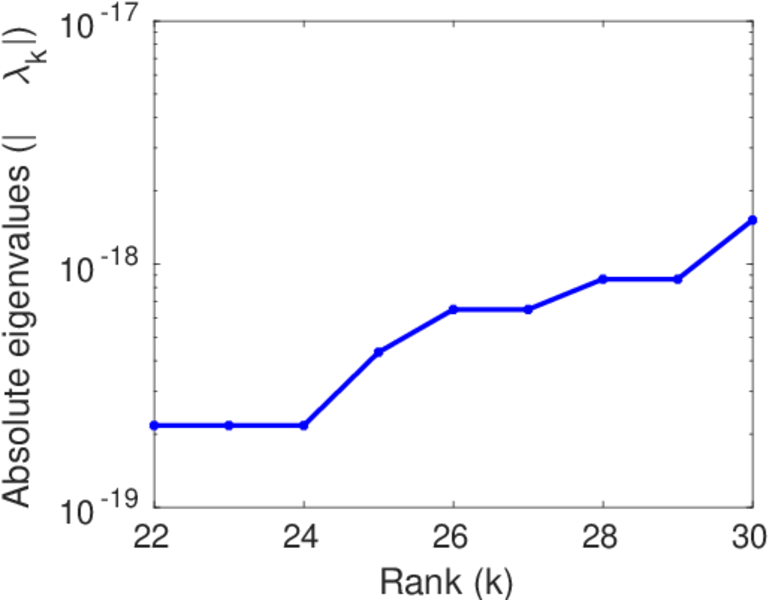
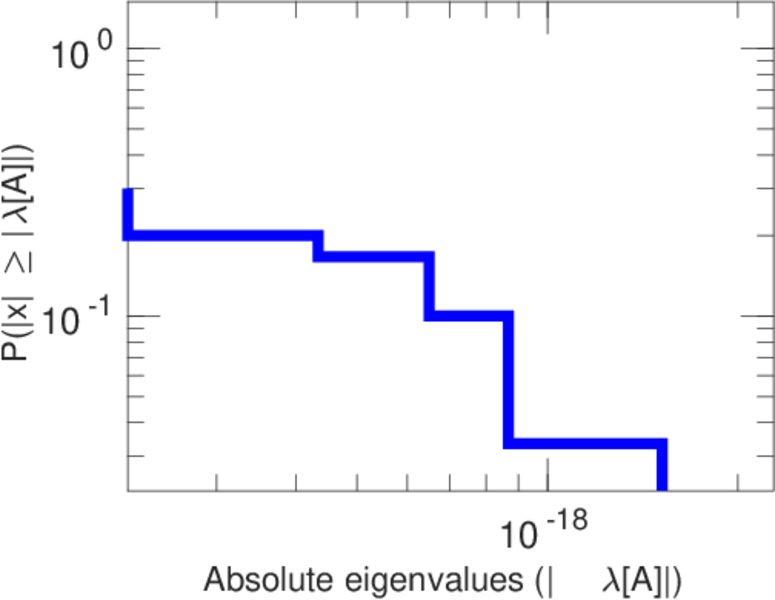
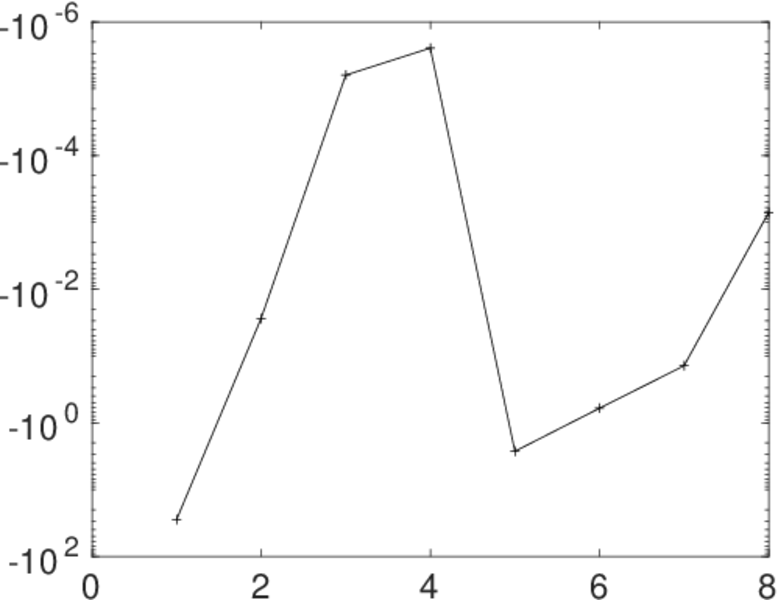
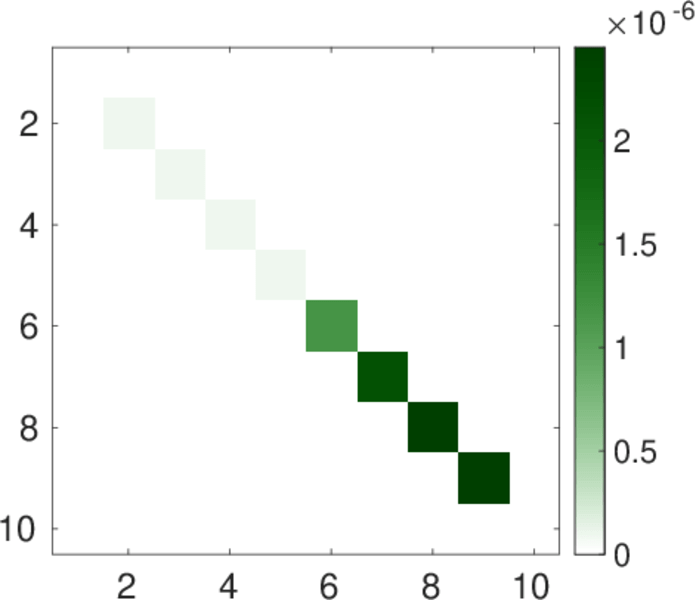
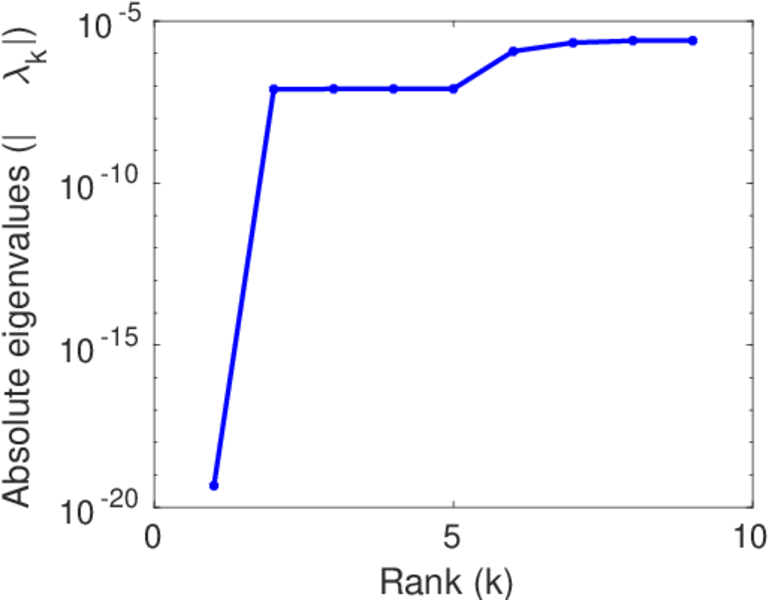
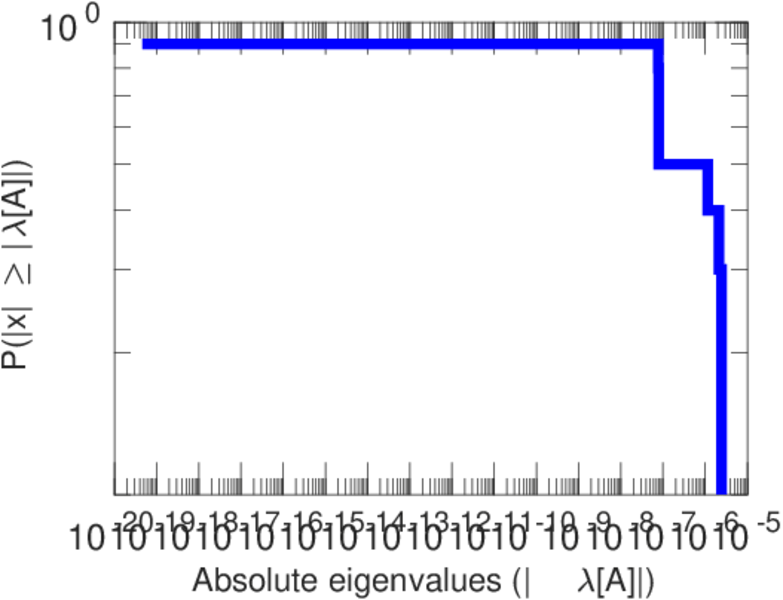
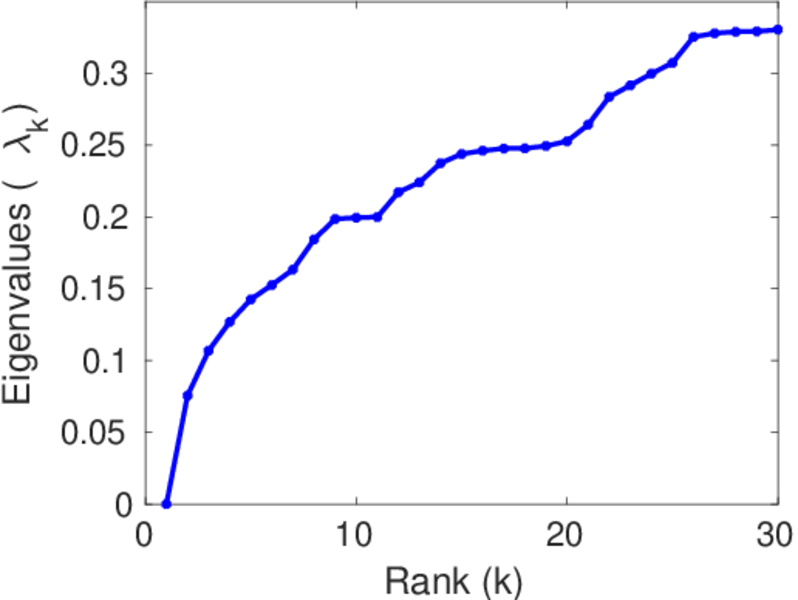
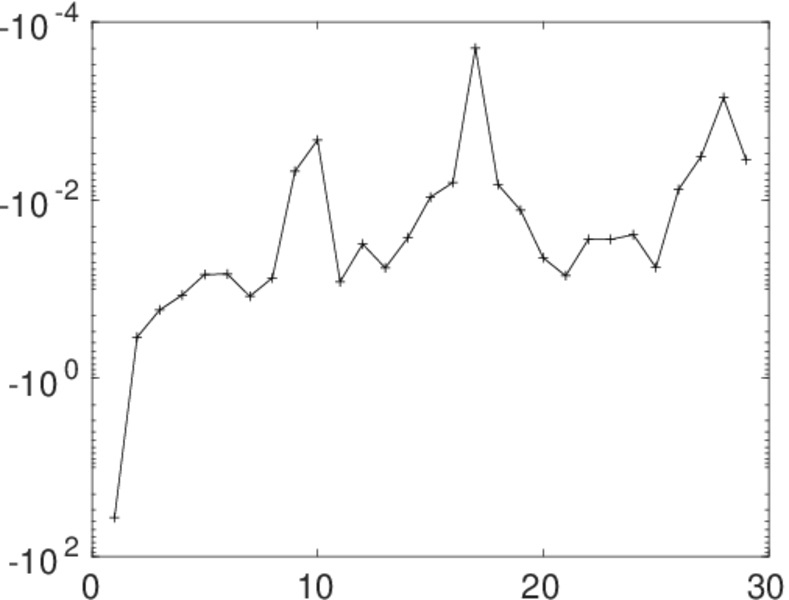
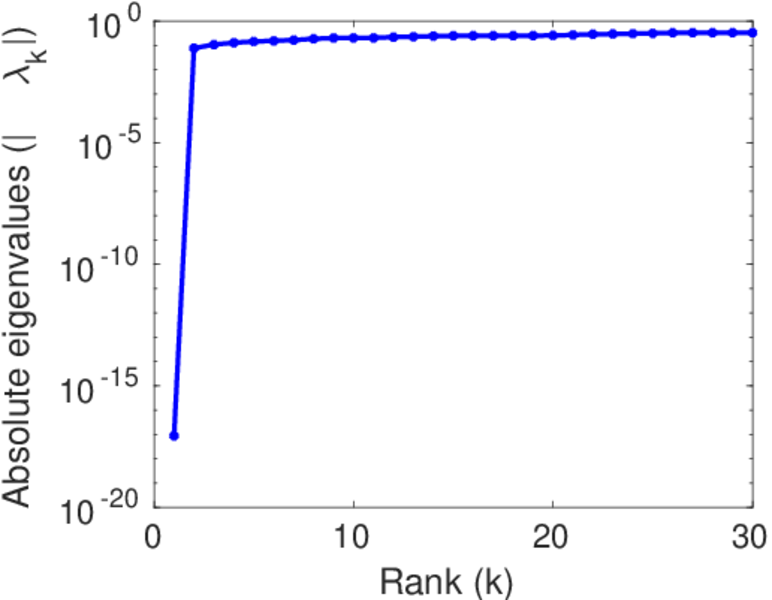
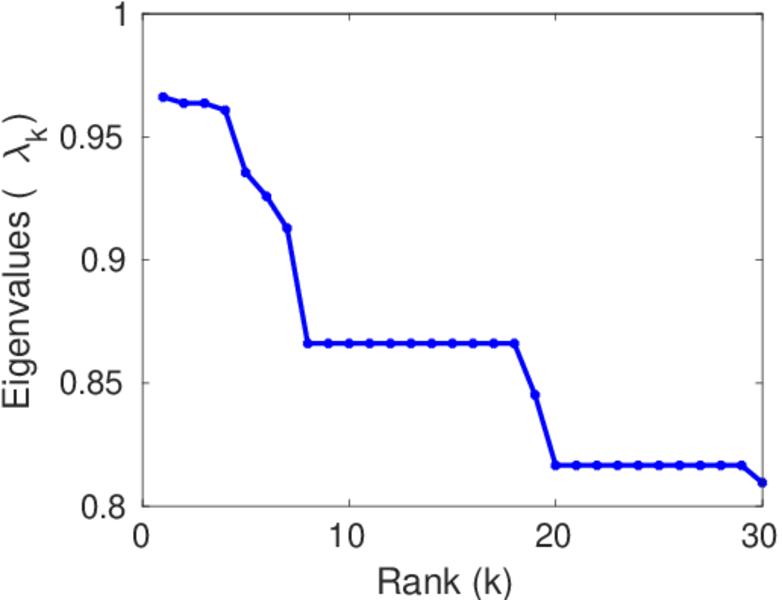
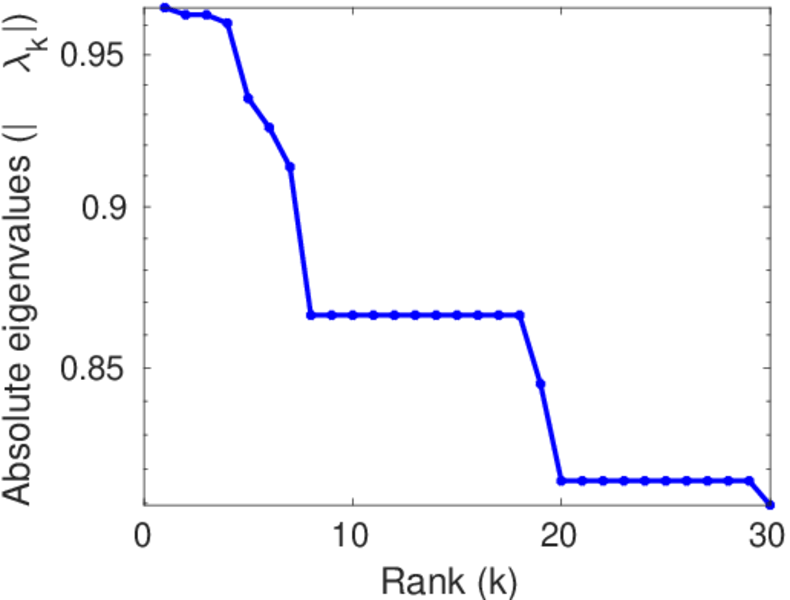
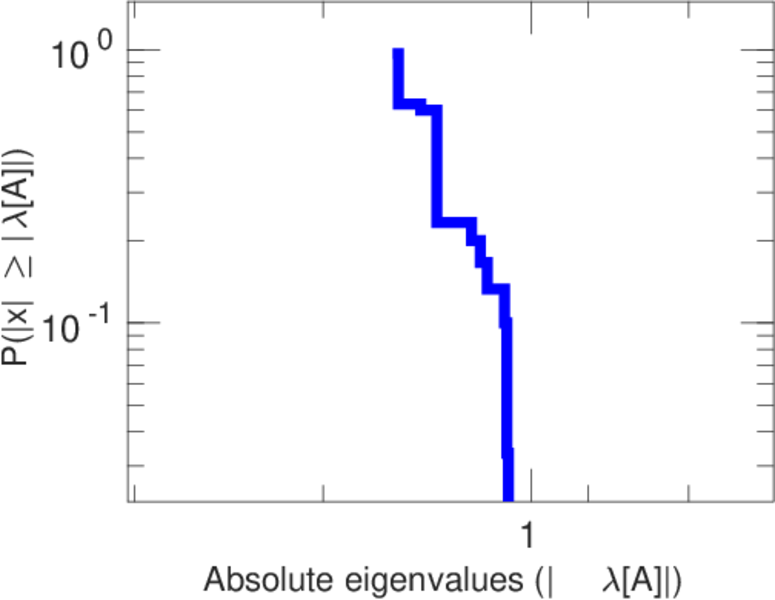
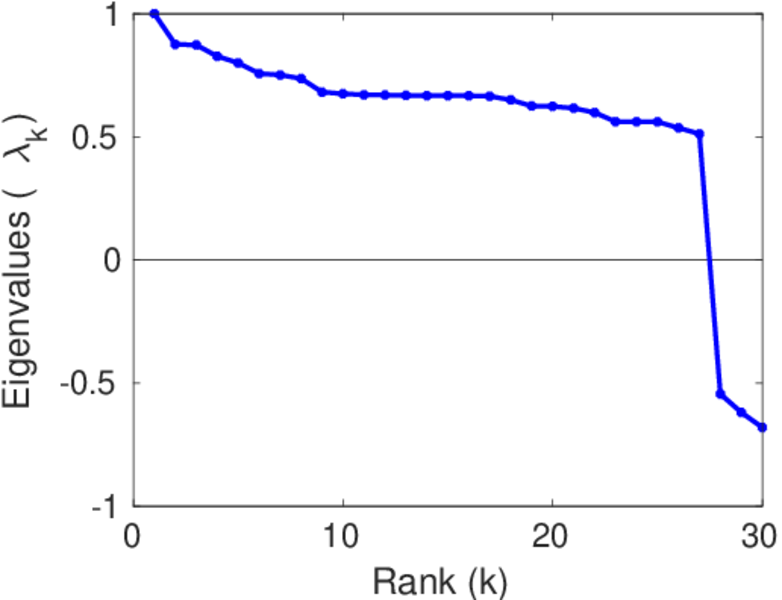
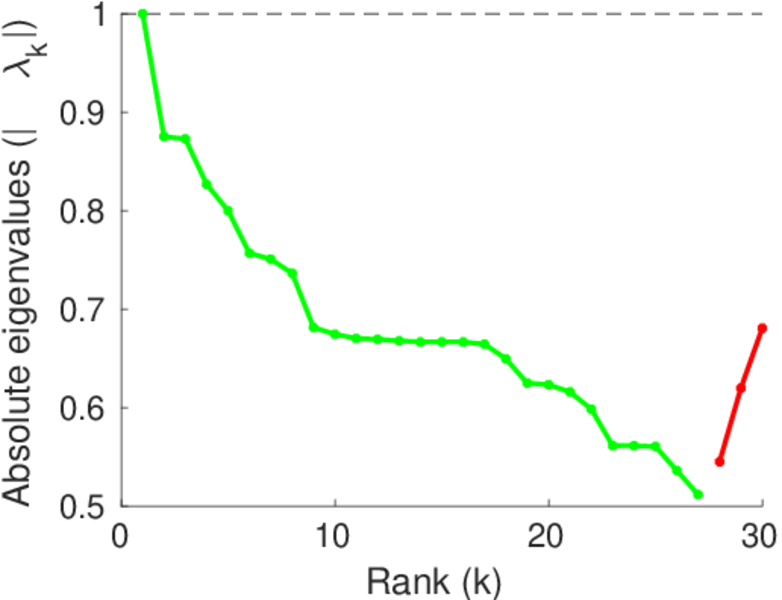
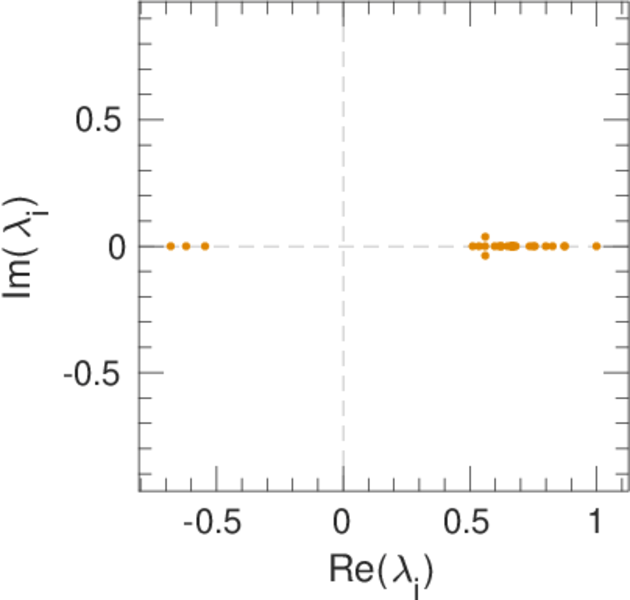
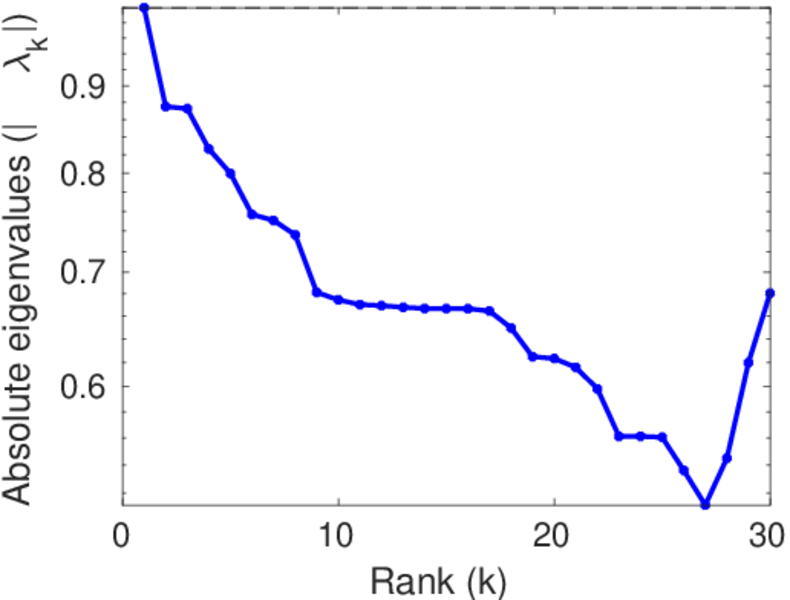
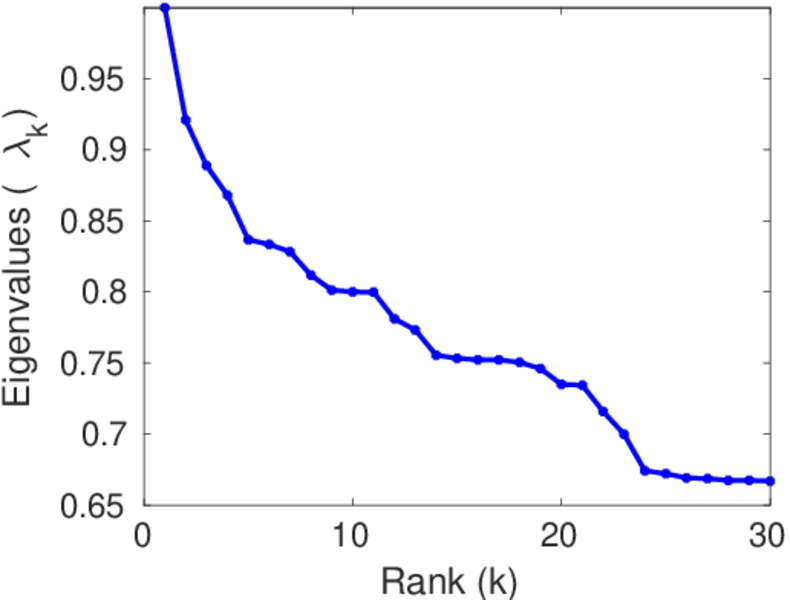
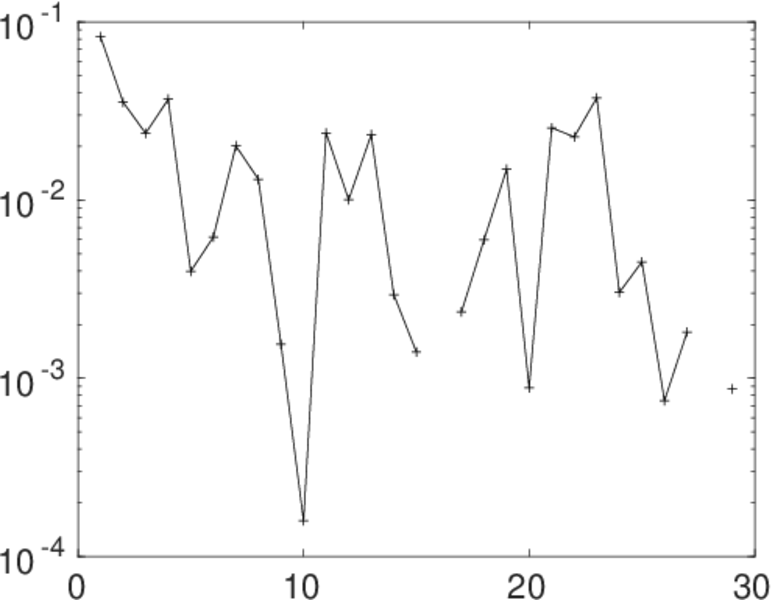
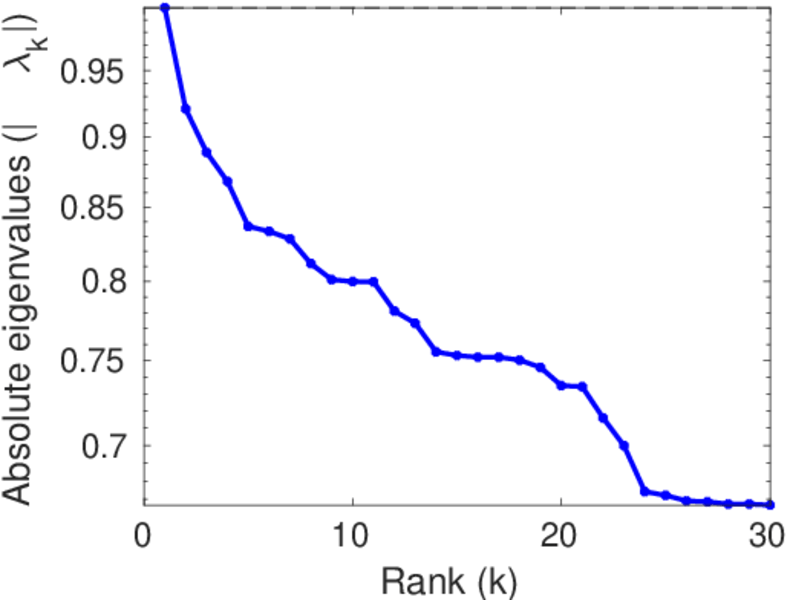
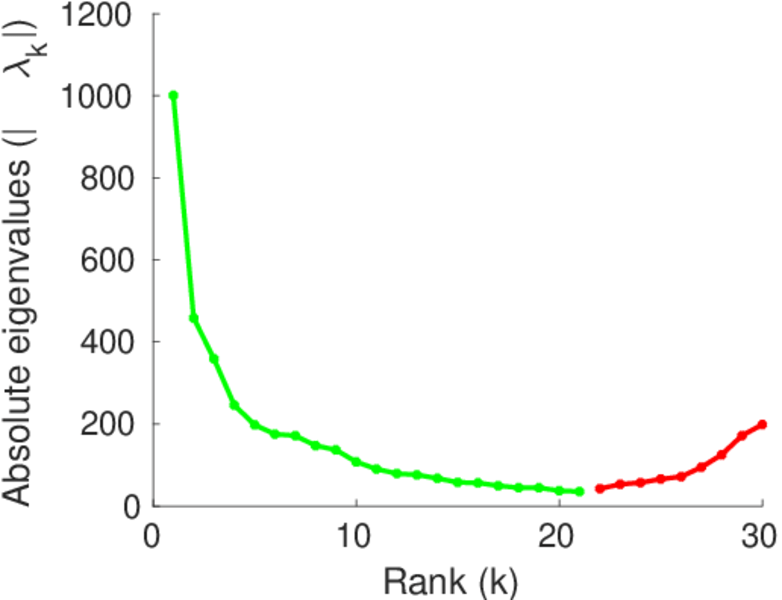
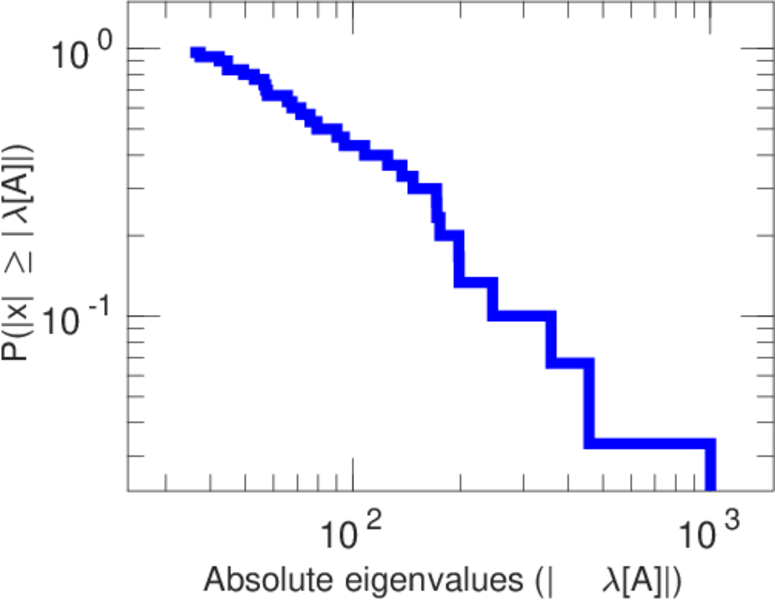
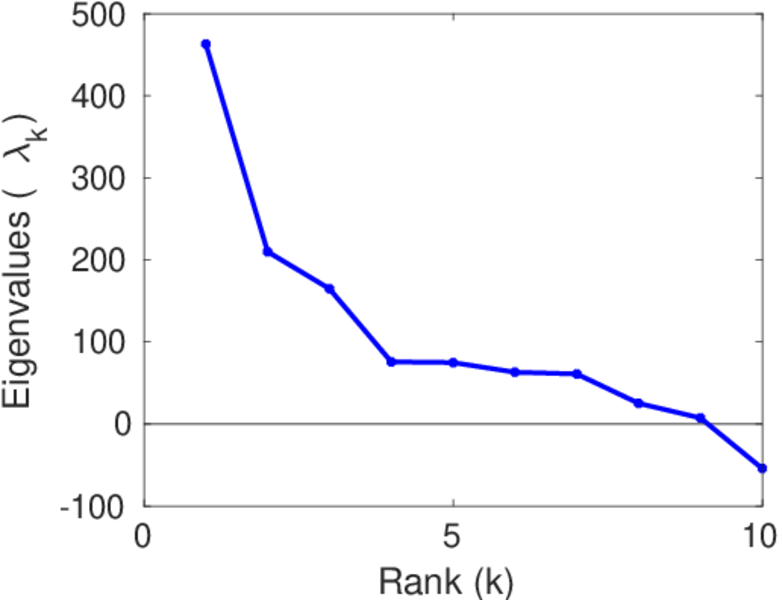
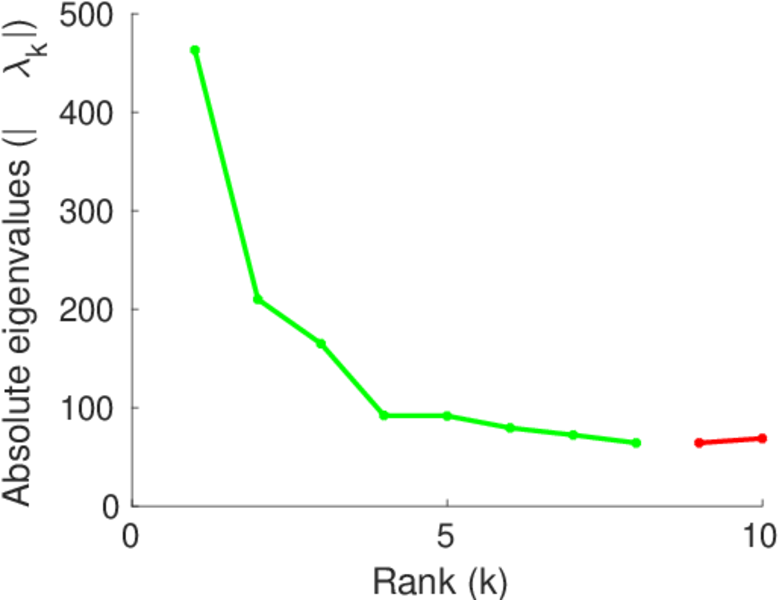
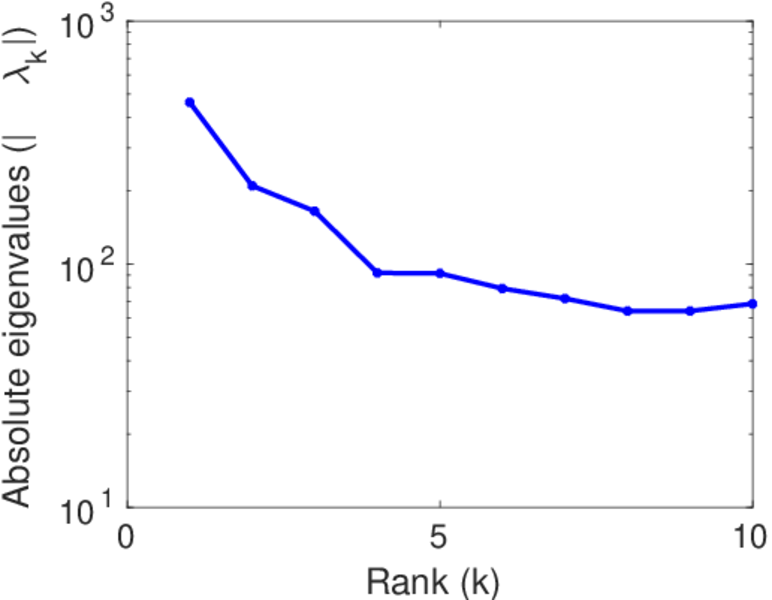
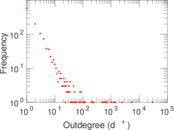
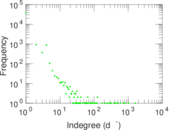
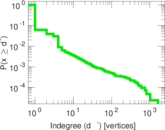
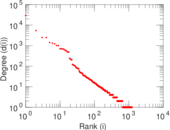
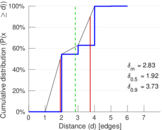
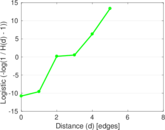
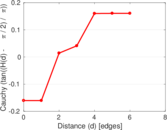
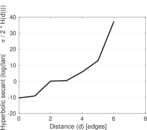
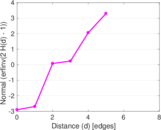
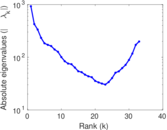
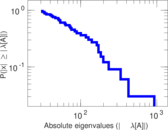
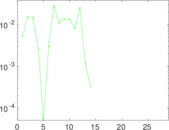
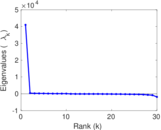
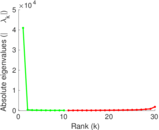
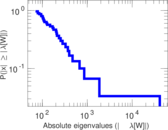
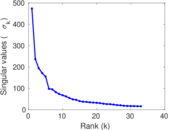
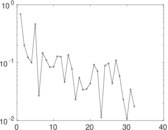
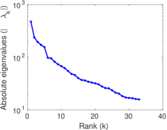
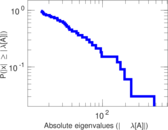
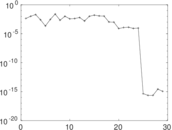
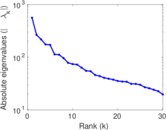
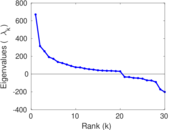
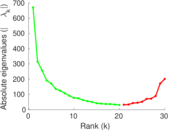
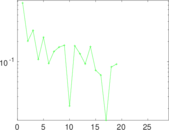
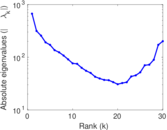
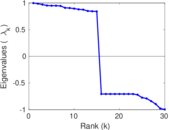
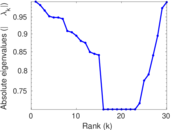
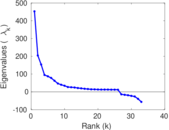
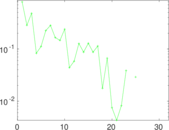
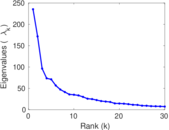
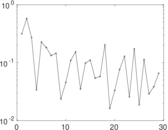
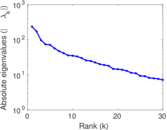
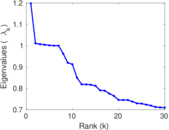
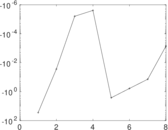
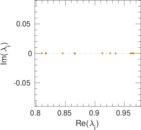
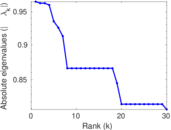
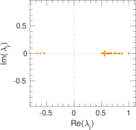
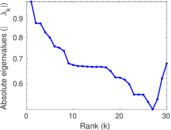
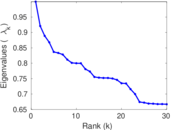
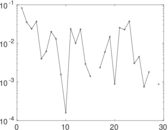
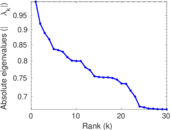
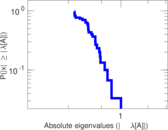
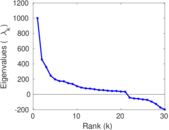
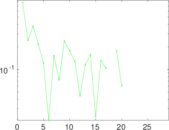
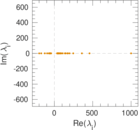
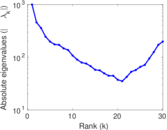
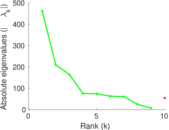
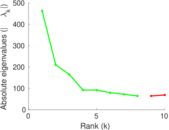
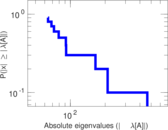
Plots


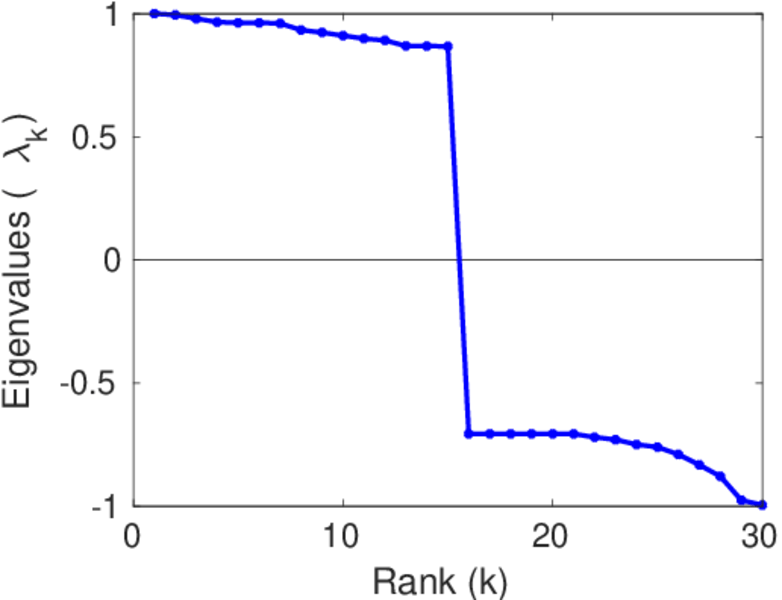
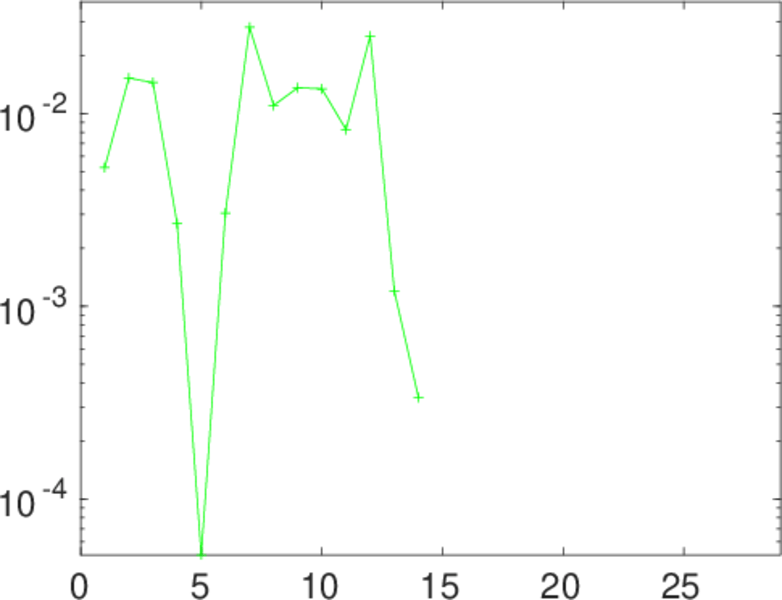
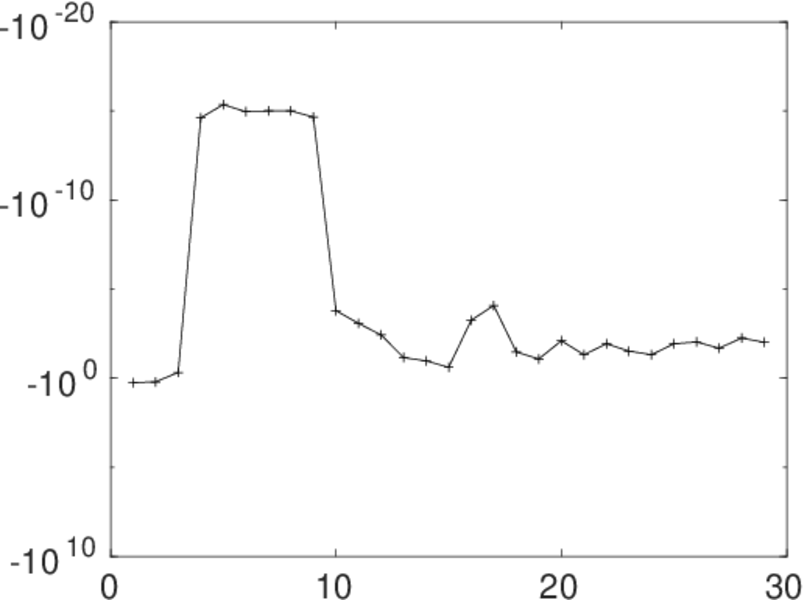
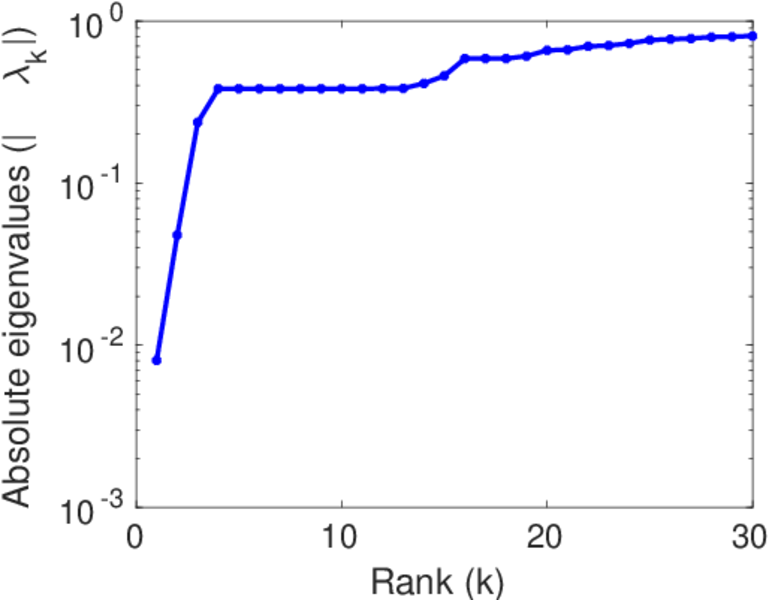
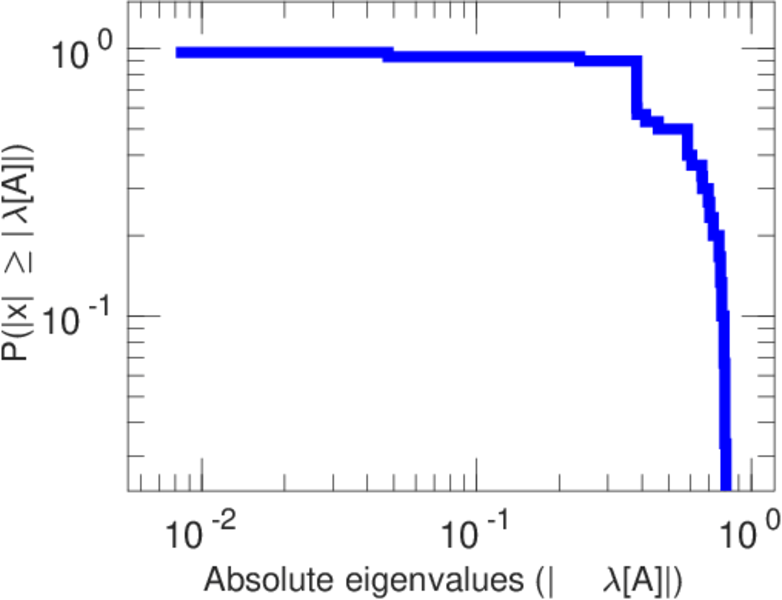
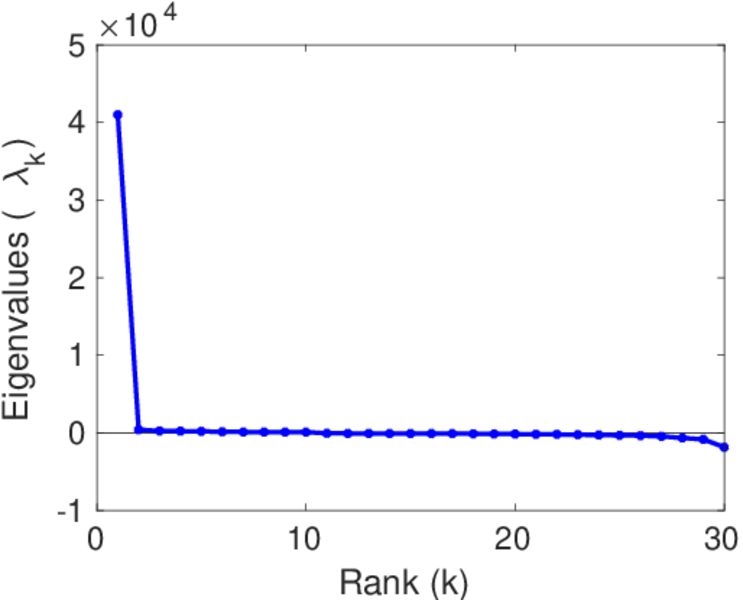
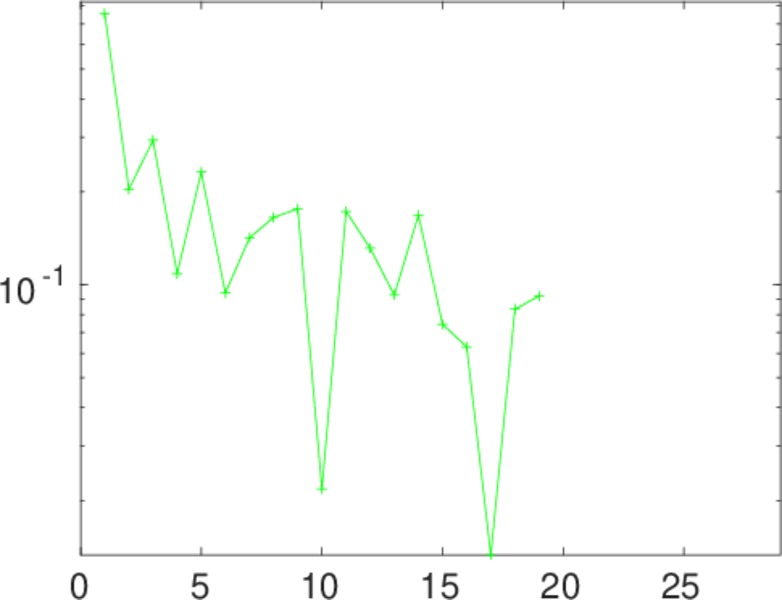
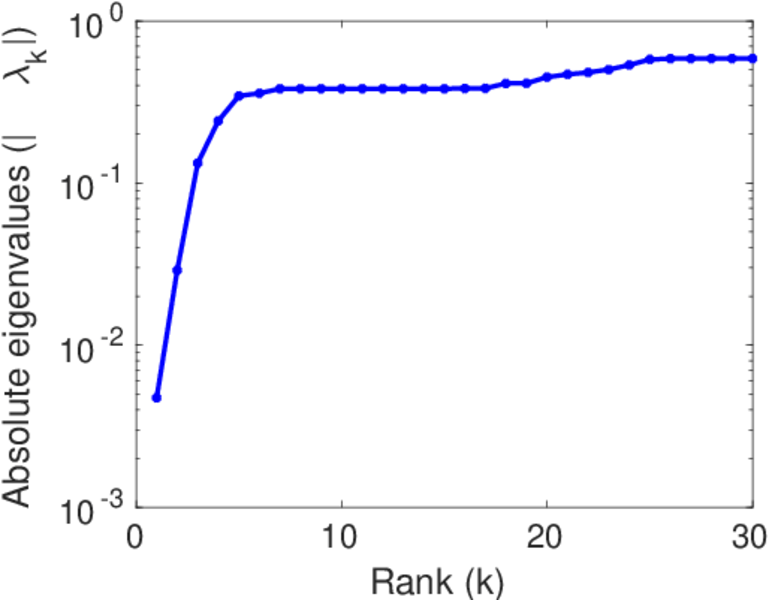
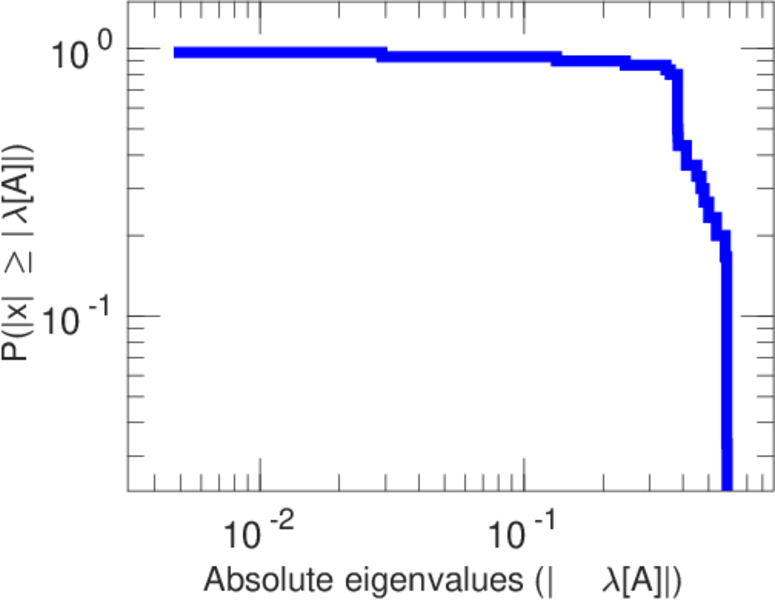
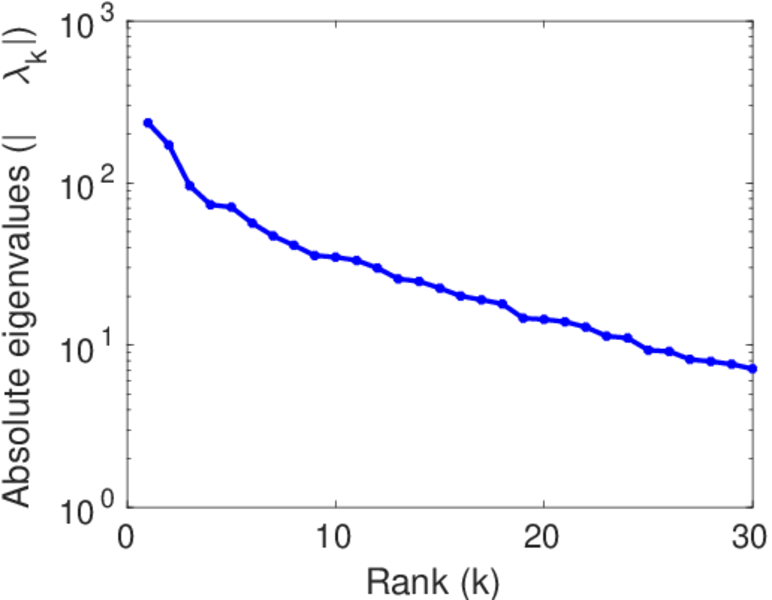
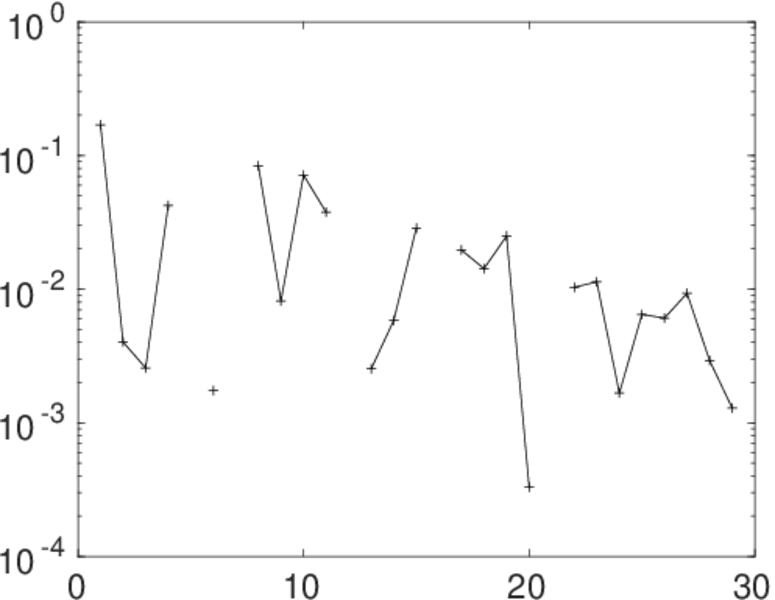
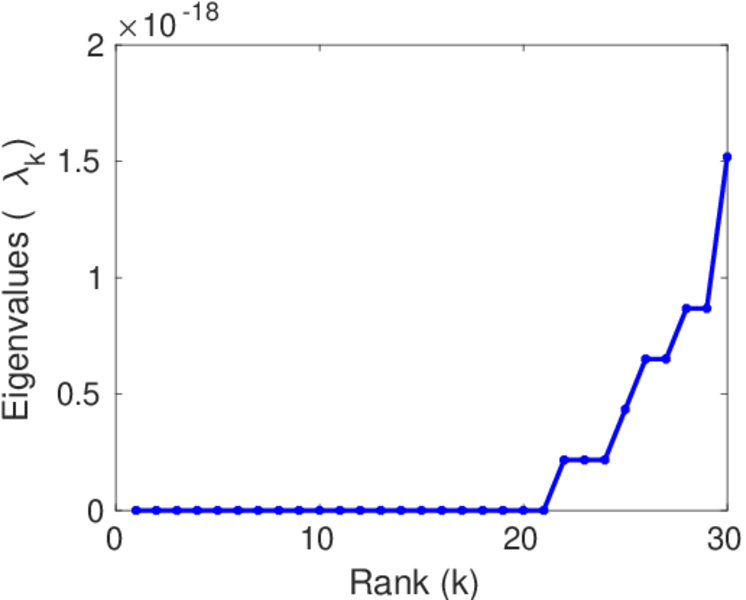
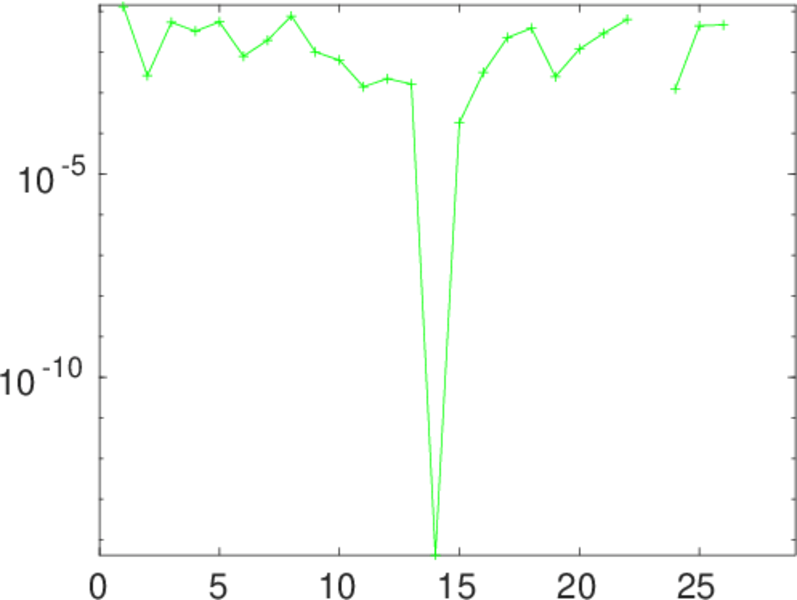
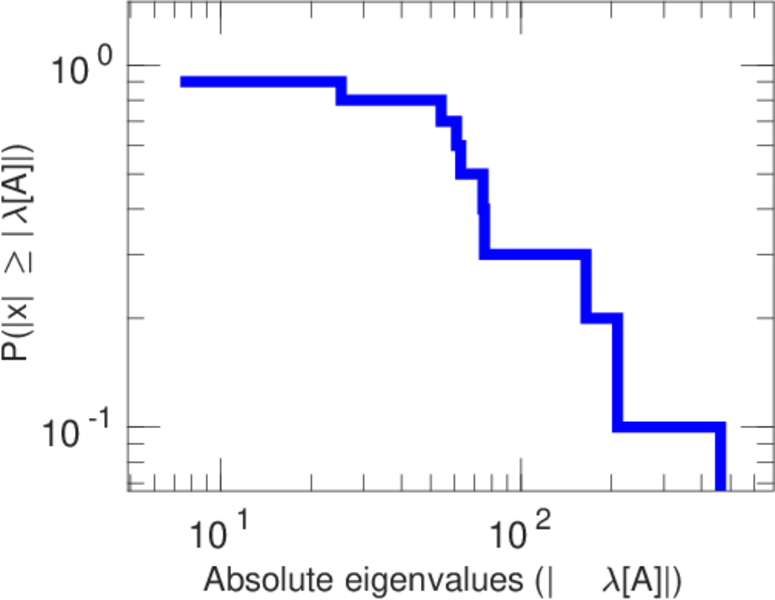
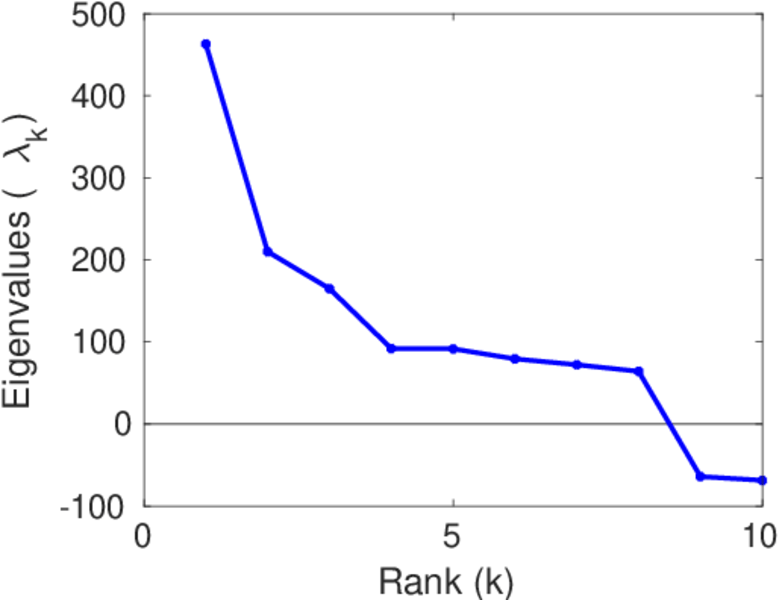
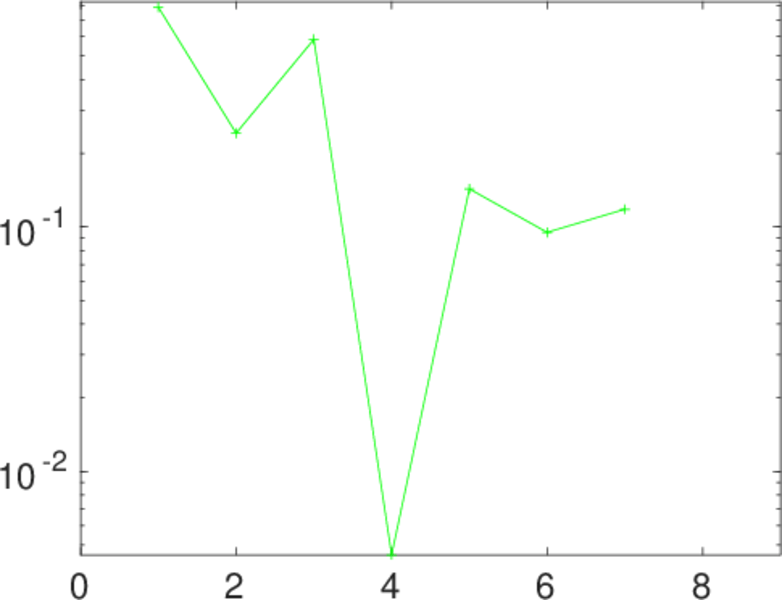
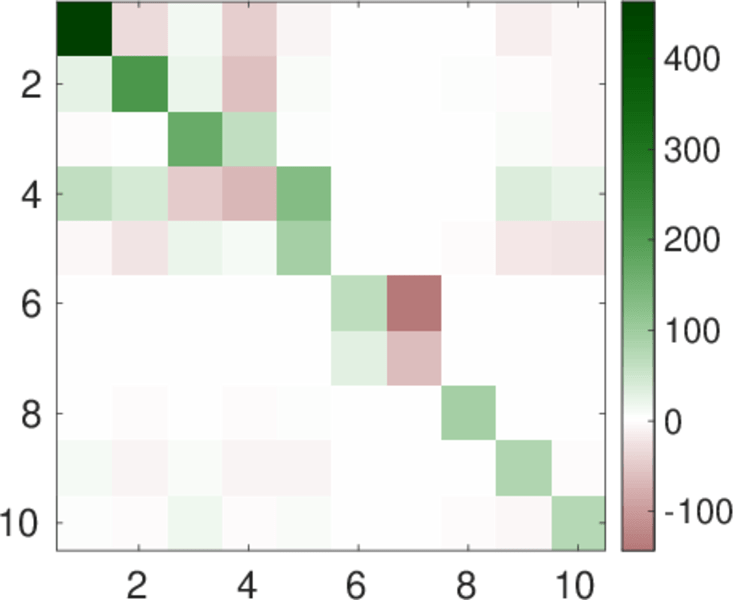
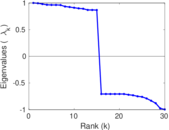
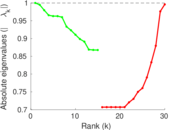
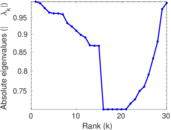
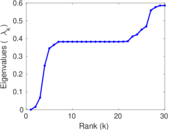
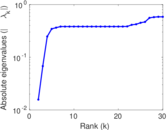
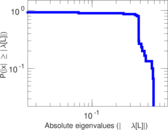
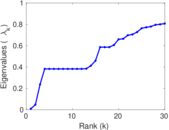
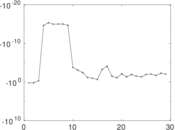
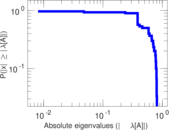
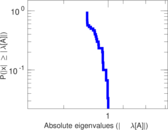
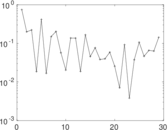
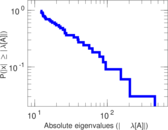
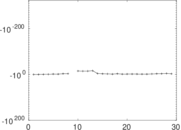
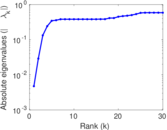
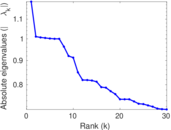
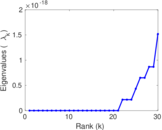
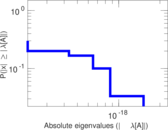
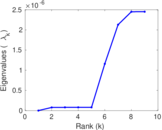
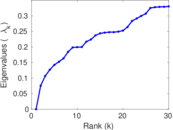
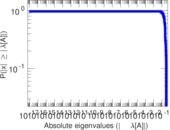
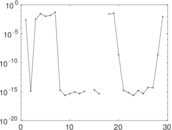
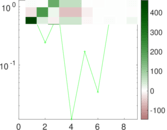
Matrix decompositions plots


Downloads
References
|
[1]
|
Jérôme Kunegis.
KONECT – The Koblenz Network Collection.
In Proc. Int. Conf. on World Wide Web Companion, pages
1343–1350, 2013.
[ http ]
|
|
[2]
|
Jun Sun, Jérôme Kunegis, and Steffen Staab.
Predicting user roles in social networks using transfer learning with
feature transformation.
In Proc. ICDM Workshop on Data Min. in Netw., 2016.
|
 KONECT ‣ Networks ‣
Buy Me a Coffee
KONECT ‣ Networks ‣
Buy Me a Coffee