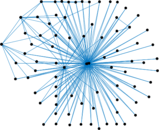
Wikipedia talk (gl)
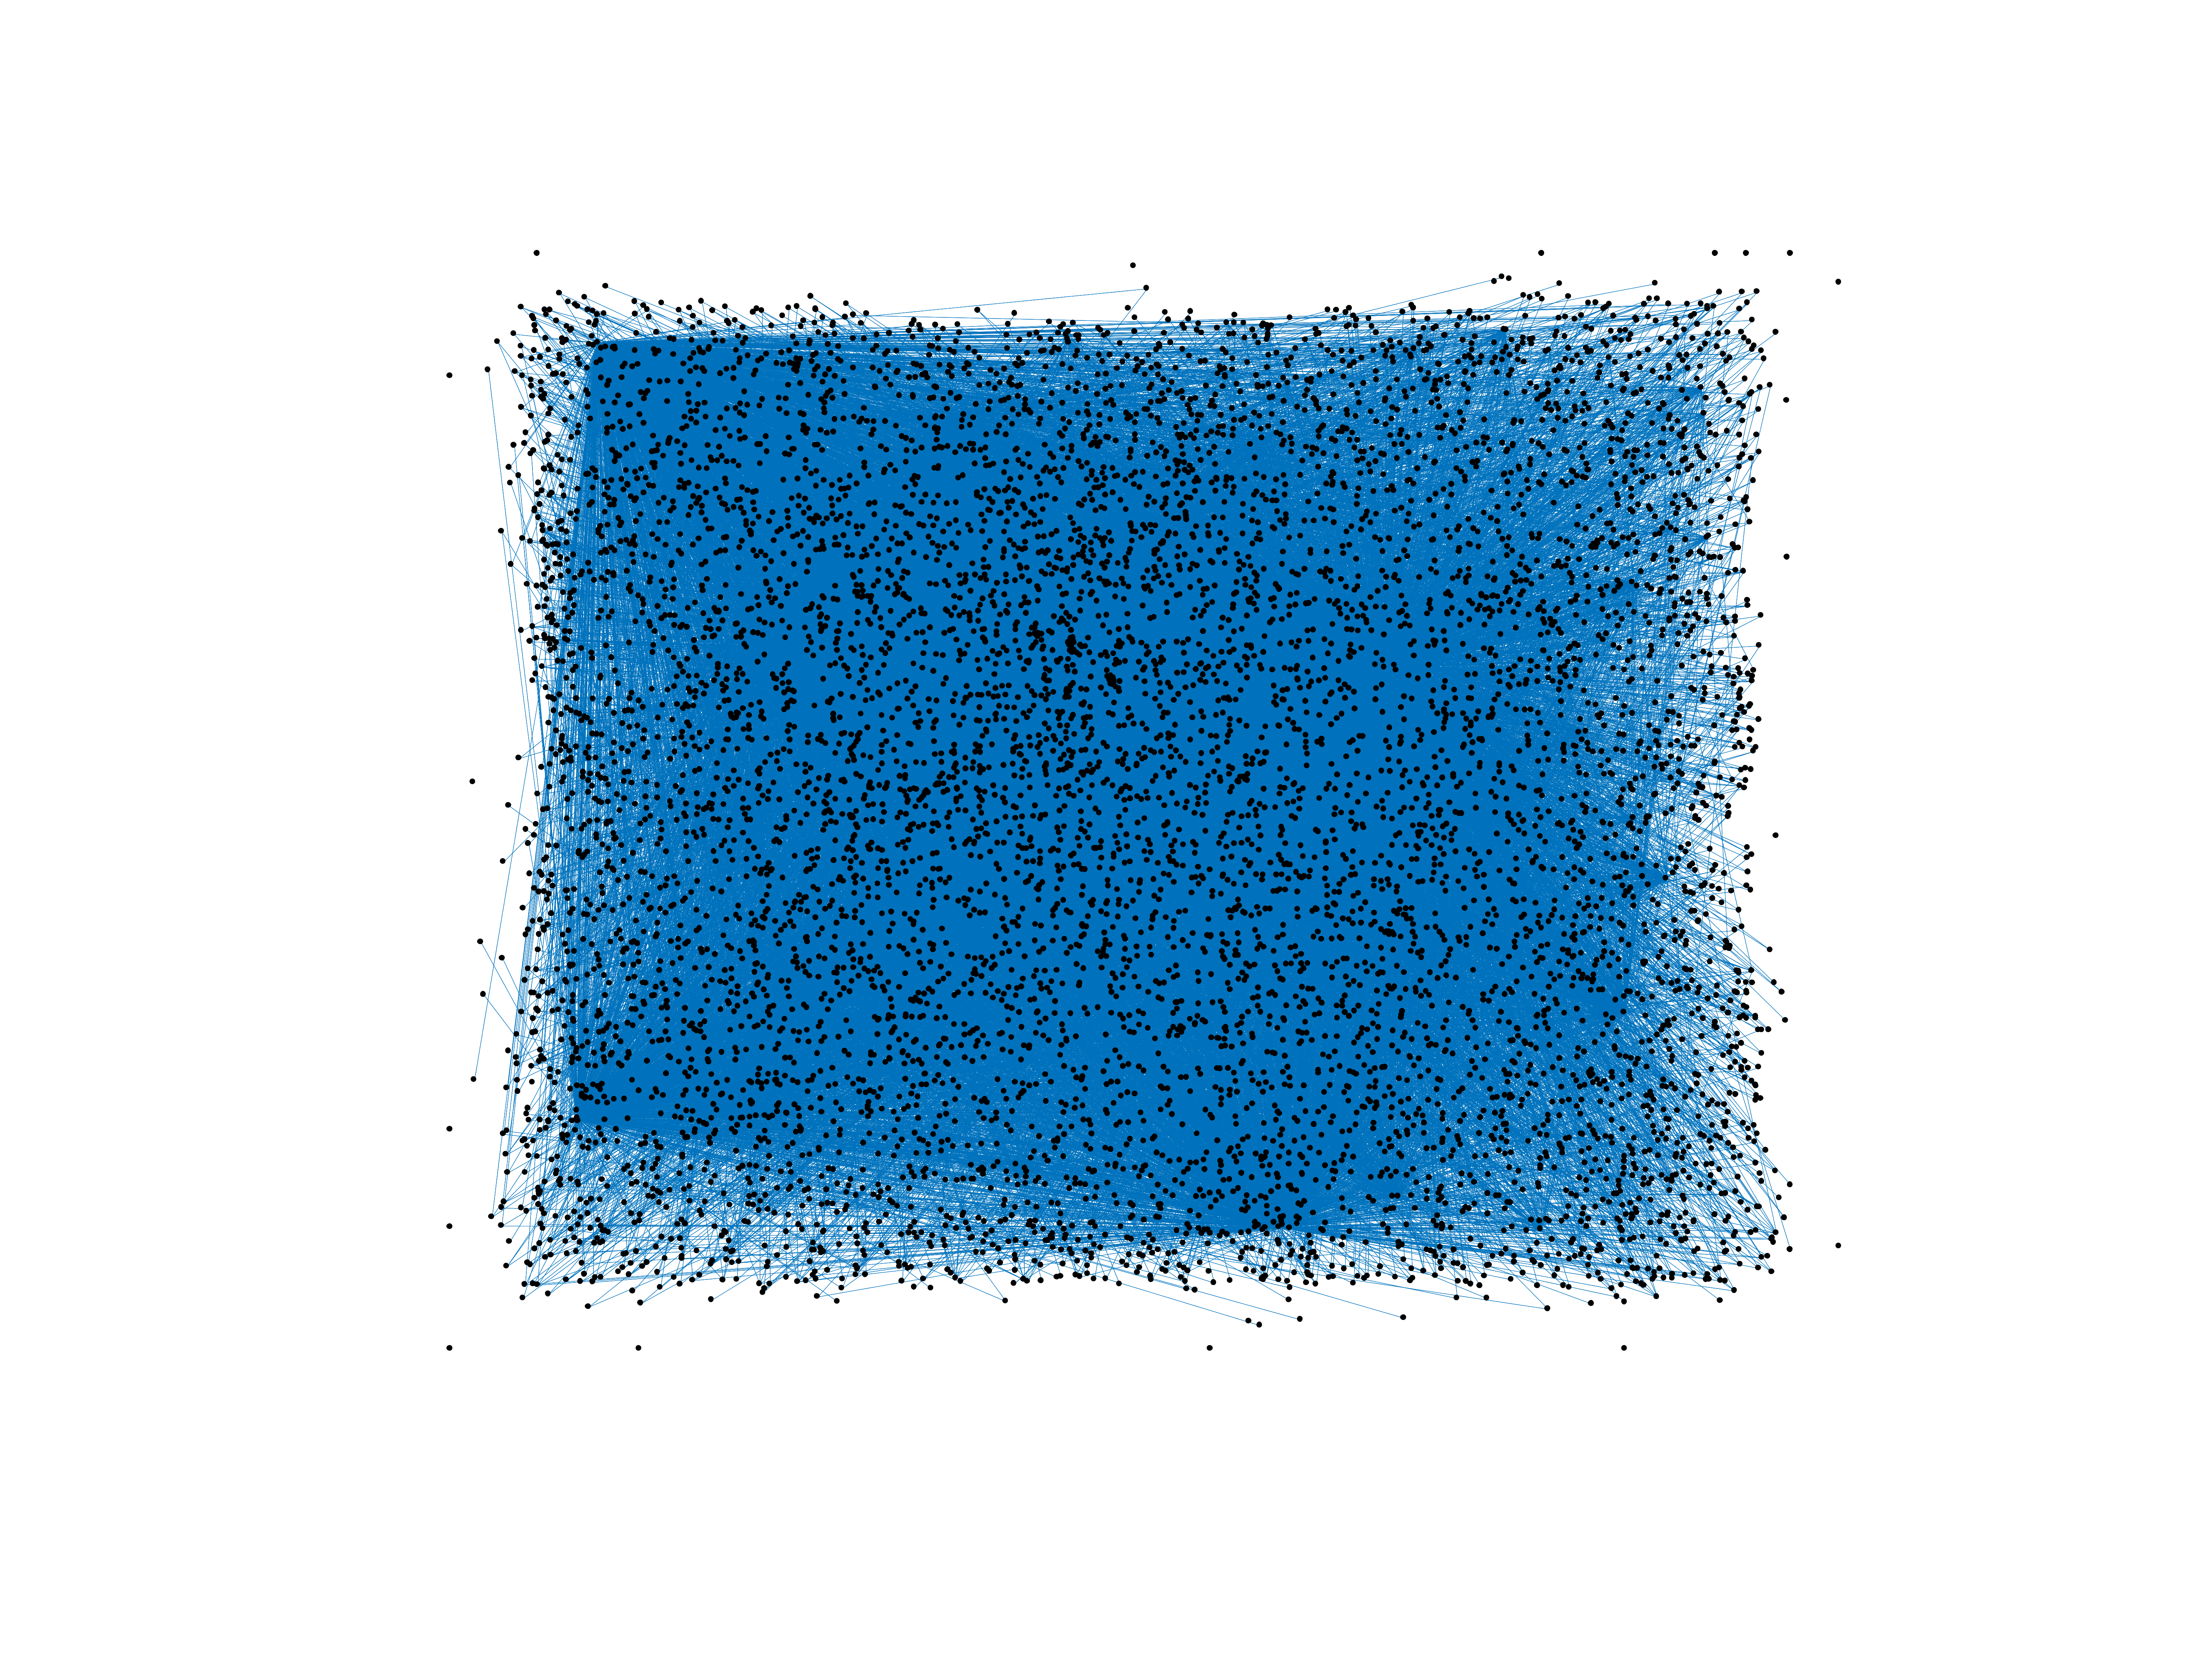
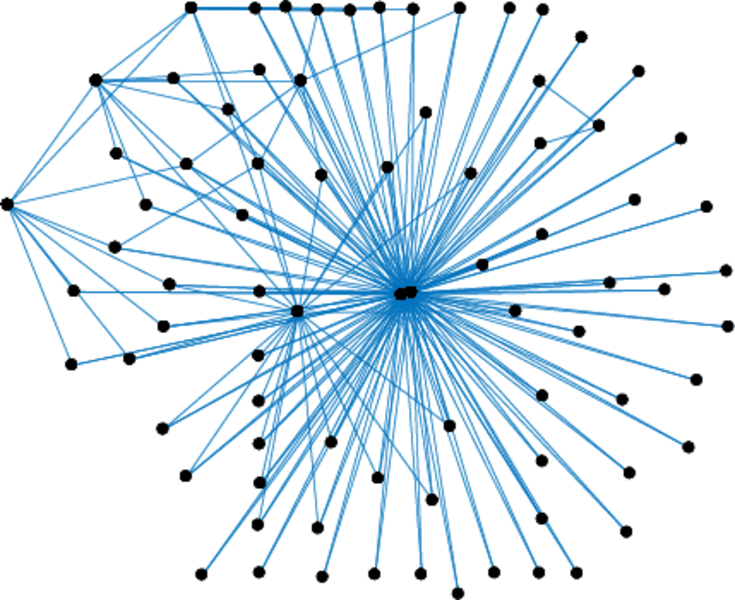
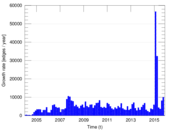
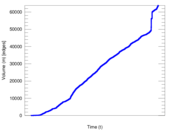
This is the communication network of the Galician Wikipedia. Nodes represent
users, and an edge from user A to user B denotes that user A wrote a message on
the talk page of user B at a certain timestamp.
Metadata
Statistics
| Size | n = | 8,097
|
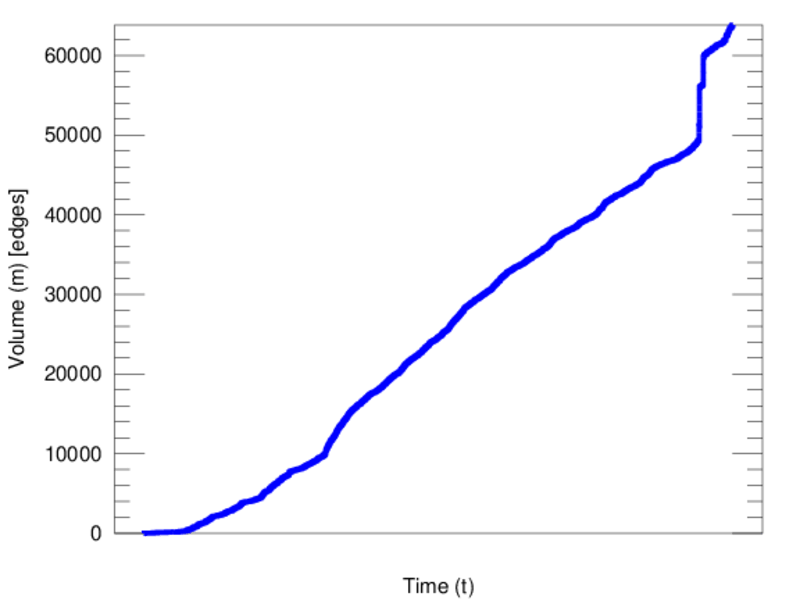
| Volume | m = | 63,809
|
| Unique edge count | m̿ = | 23,279
|
| Loop count | l = | 3,955
|
| Wedge count | s = | 18,550,063
|
| Claw count | z = | 22,382,348,663
|
| Cross count | x = | 23,425,727,965,064
|
| Triangle count | t = | 22,837
|
| Square count | q = | 5,022,119
|
| 4-Tour count | T4 = | 114,416,978
|
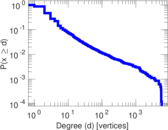
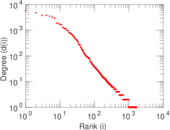
| Maximum degree | dmax = | 5,815
|
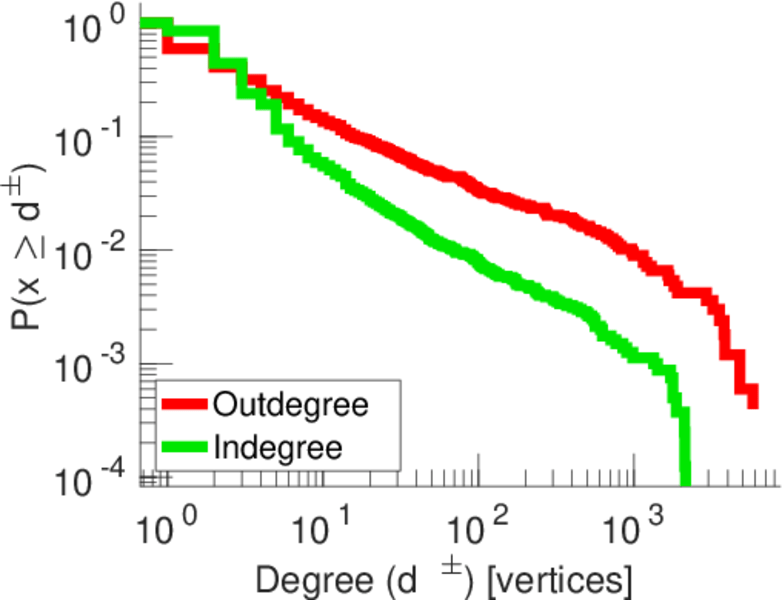
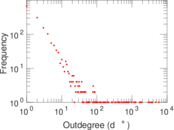
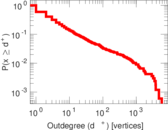
| Maximum outdegree | d+max = | 5,815
|
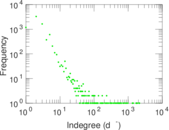
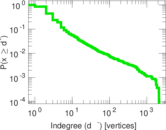
| Maximum indegree | d−max = | 2,143
|
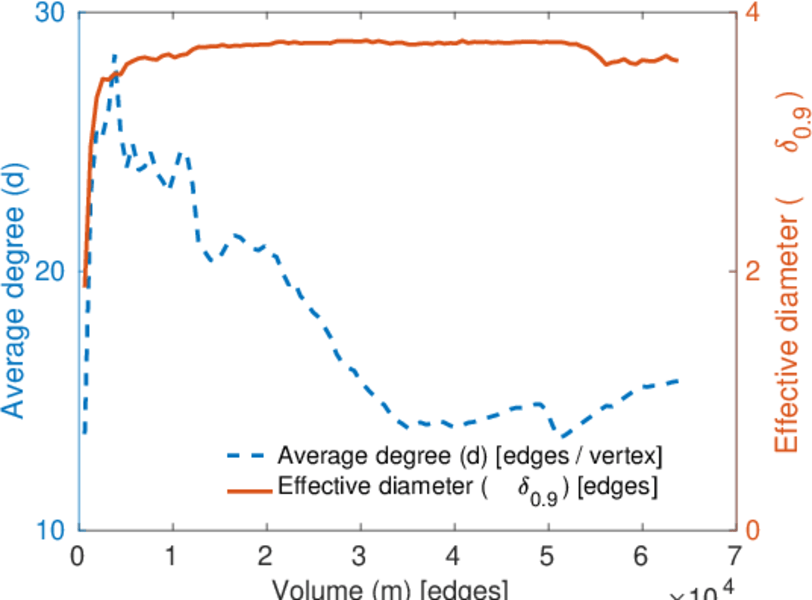
| Average degree | d = | 15.761 1
|
| Fill | p = | 0.000 355 072
|
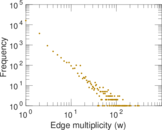
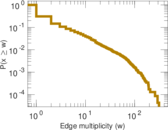
| Average edge multiplicity | m̃ = | 2.741 05
|
| Size of LCC | N = | 7,920
|
| Size of LSCC | Ns = | 1,009
|
| Relative size of LSCC | Nrs = | 0.124 614
|
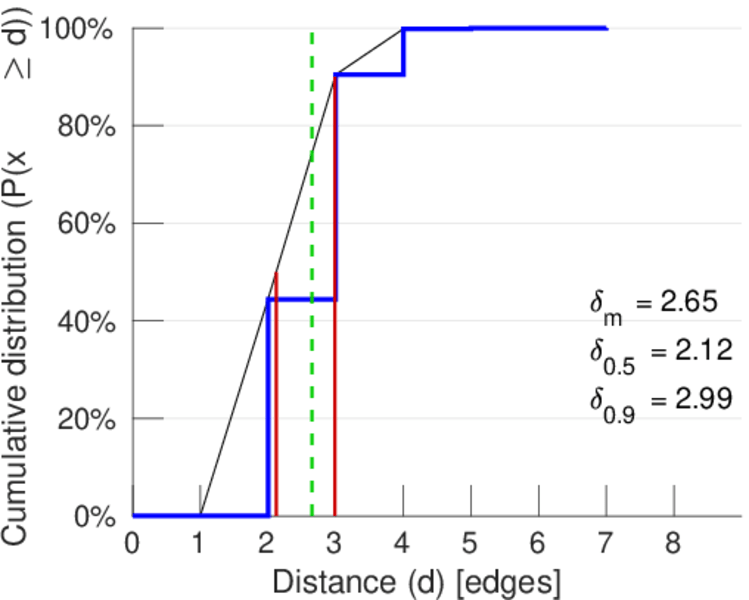
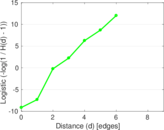
| Diameter | δ = | 7
|
| 50-Percentile effective diameter | δ0.5 = | 2.121 48
|
| 90-Percentile effective diameter | δ0.9 = | 2.990 63
|
| Median distance | δM = | 3
|
| Mean distance | δm = | 2.652 91
|
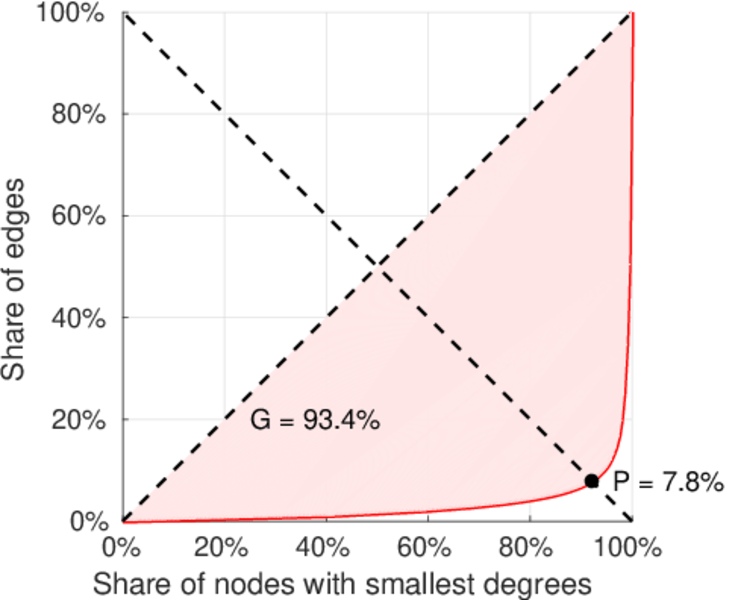
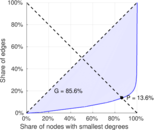
| Gini coefficient | G = | 0.856 243
|
| Balanced inequality ratio | P = | 0.136 258
|
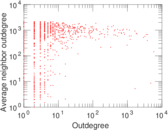
| Outdegree balanced inequality ratio | P+ = | 0.077 575 3
|
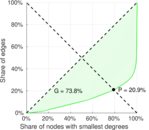
| Indegree balanced inequality ratio | P− = | 0.209 422
|
| Relative edge distribution entropy | Her = | 0.738 498
|
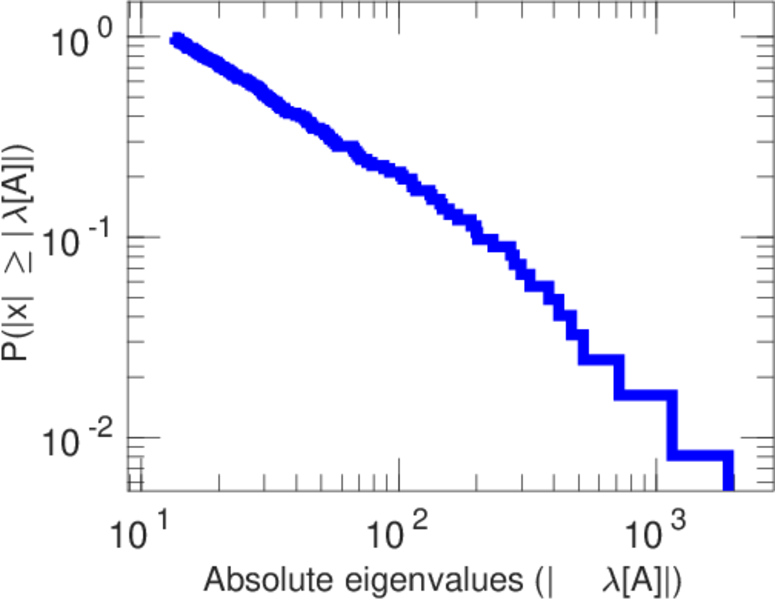
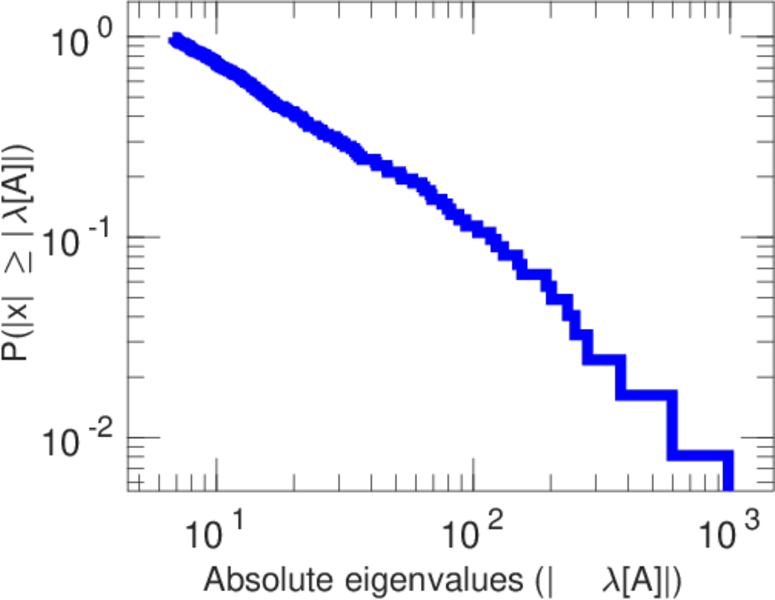
| Power law exponent | γ = | 2.251 76
|
| Tail power law exponent | γt = | 3.071 00
|
| Tail power law exponent with p | γ3 = | 3.071 00
|
| p-value | p = | 0.000 00
|
| Outdegree tail power law exponent with p | γ3,o = | 1.951 00
|
| Outdegree p-value | po = | 0.000 00
|
| Indegree tail power law exponent with p | γ3,i = | 3.201 00
|
| Indegree p-value | pi = | 0.000 00
|
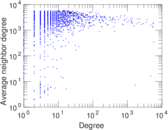
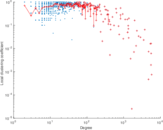
| Degree assortativity | ρ = | −0.359 948
|
| Degree assortativity p-value | pρ = | 0.000 00
|
| In/outdegree correlation | ρ± = | +0.709 225
|
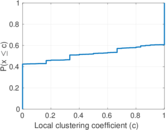
| Clustering coefficient | c = | 0.003 693 30
|
| Directed clustering coefficient | c± = | 0.047 796 5
|
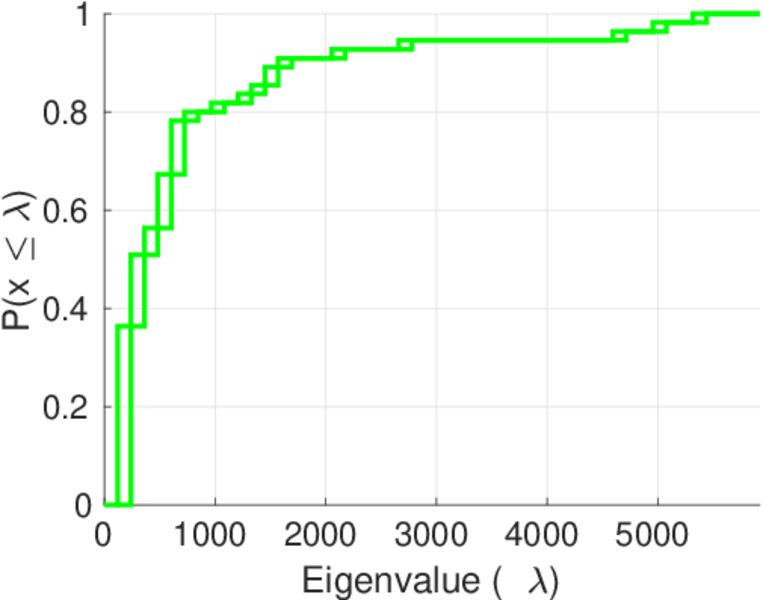
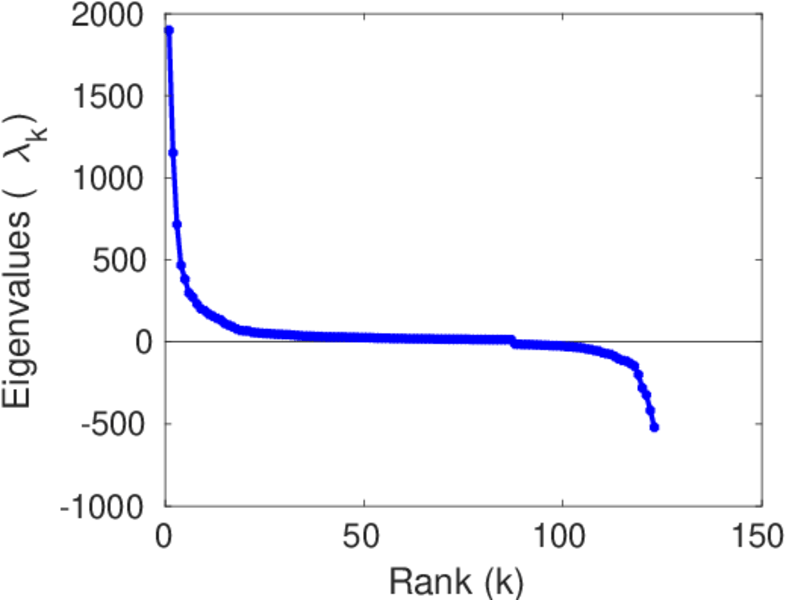
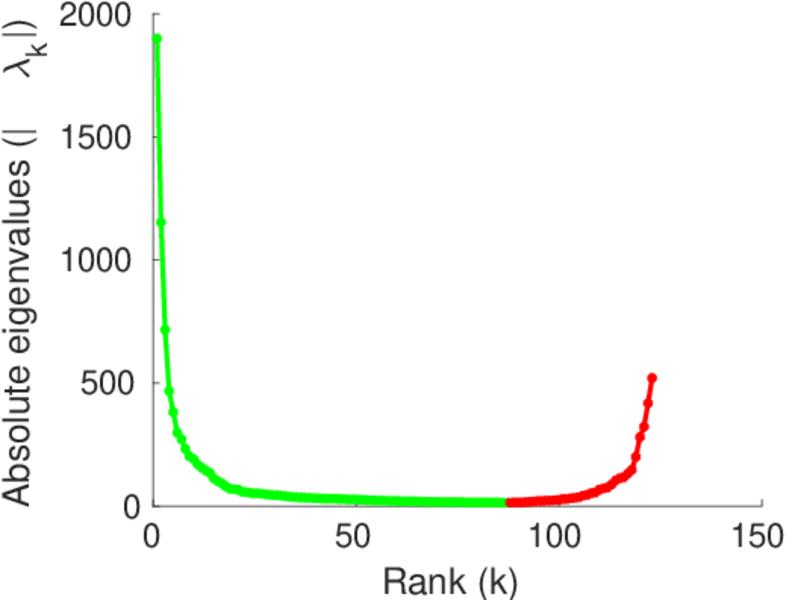
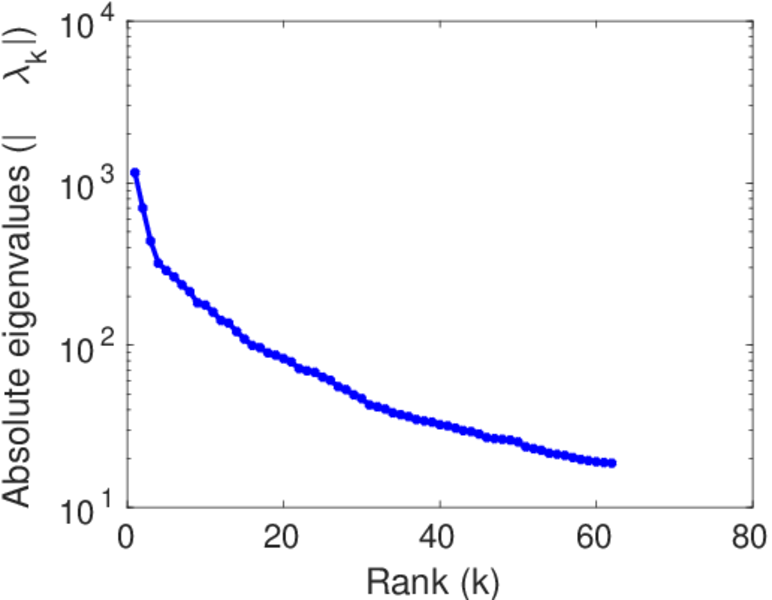
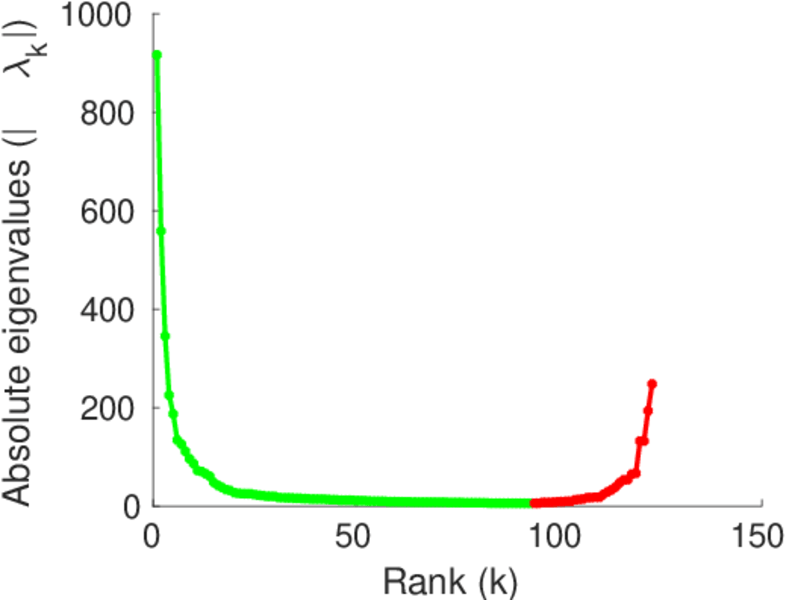
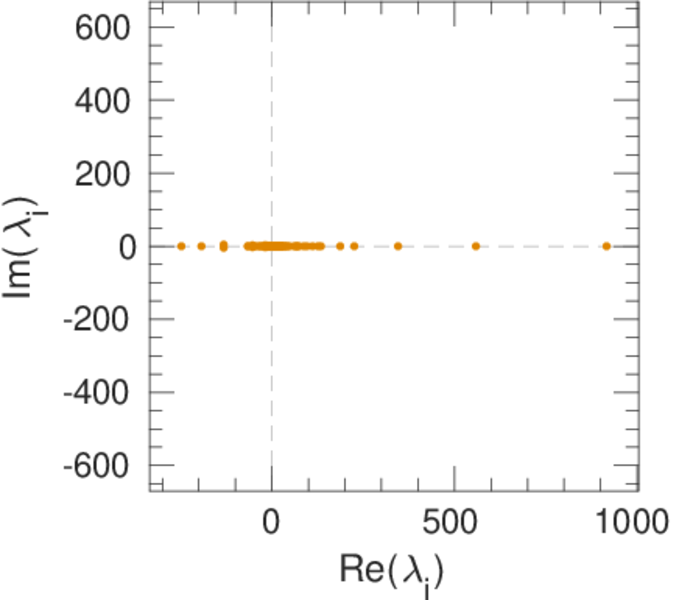
| Spectral norm | α = | 1,899.32
|
| Operator 2-norm | ν = | 984.015
|
| Cyclic eigenvalue | π = | 916.311
|
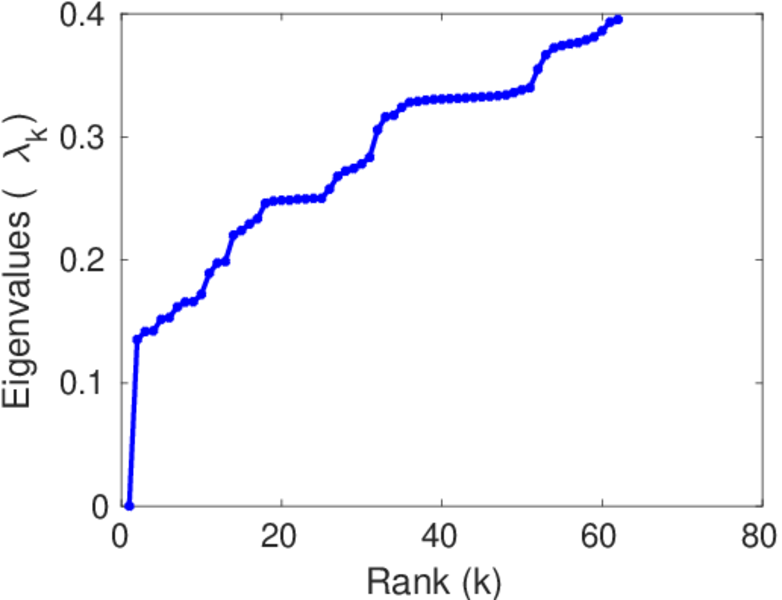
| Algebraic connectivity | a = | 0.154 410
|
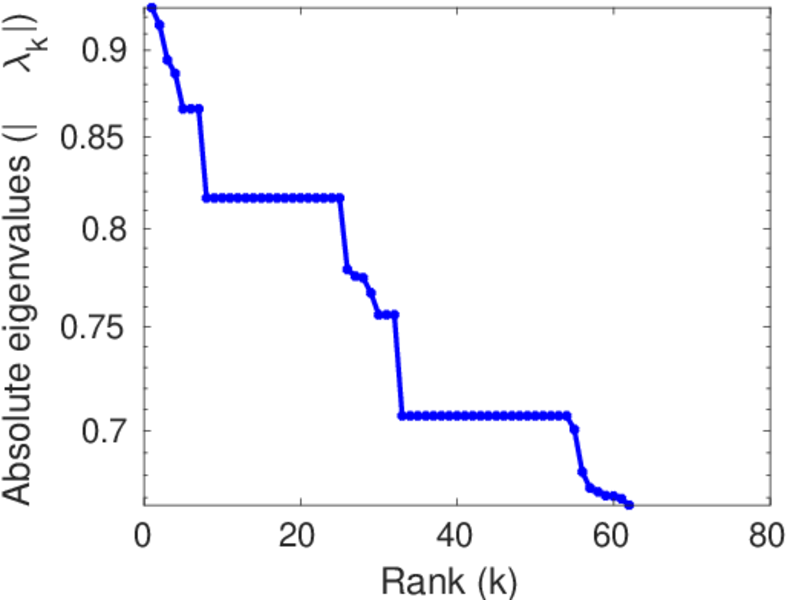
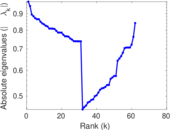
| Spectral separation | |λ1[A] / λ2[A]| = | 1.647 82
|
| Reciprocity | y = | 0.253 834
|
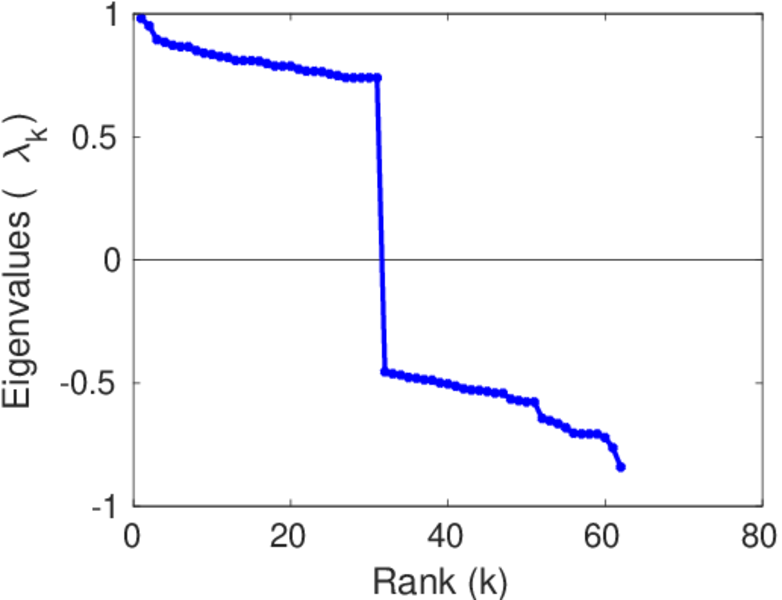
| Non-bipartivity | bA = | 0.726 009
|
| Normalized non-bipartivity | bN = | 0.064 314 9
|
| Algebraic non-bipartivity | χ = | 0.297 571
|
| Spectral bipartite frustration | bK = | 0.014 311 8
|
| Controllability | C = | 7,045
|
| Relative controllability | Cr = | 0.870 075
|
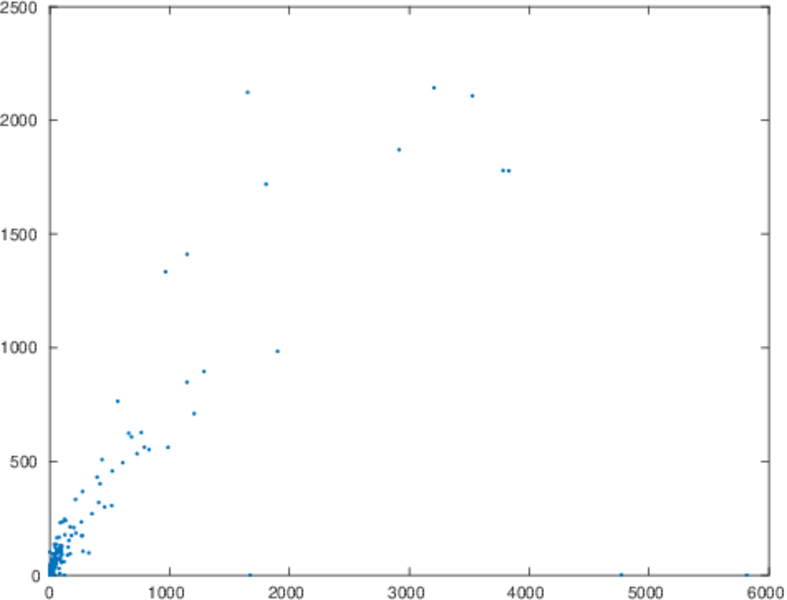
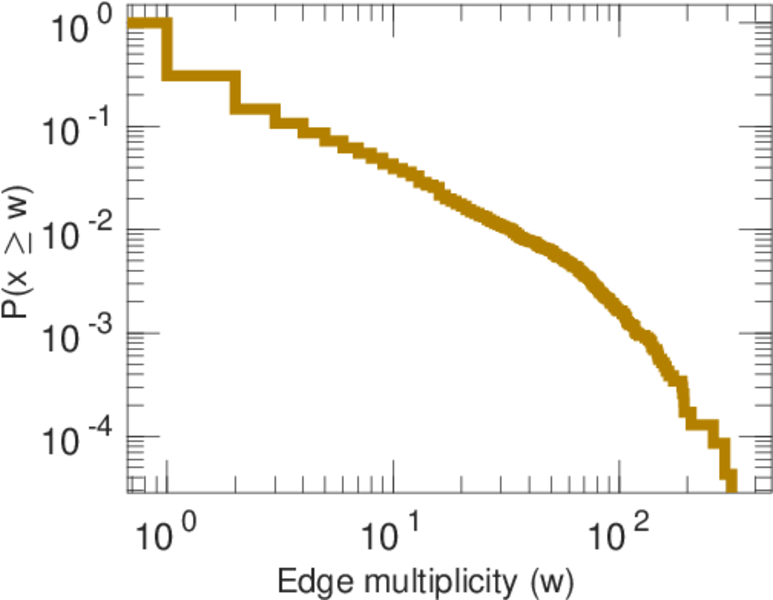
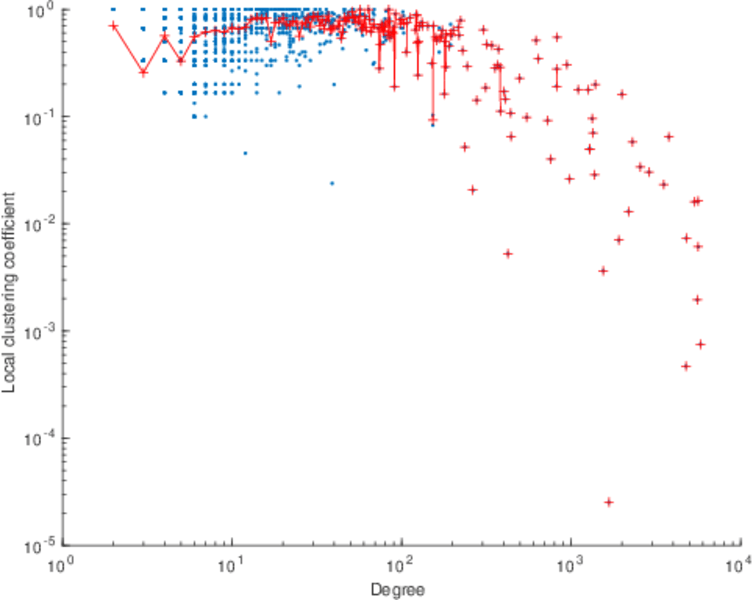
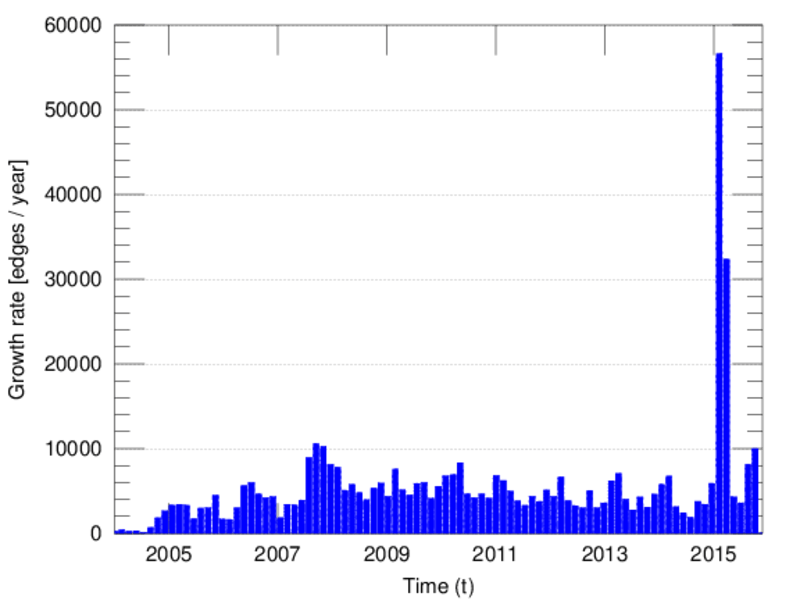
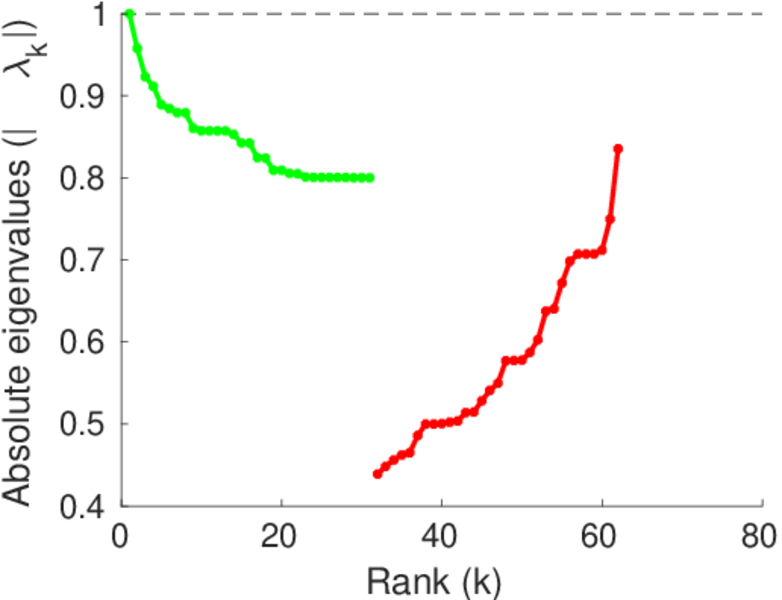
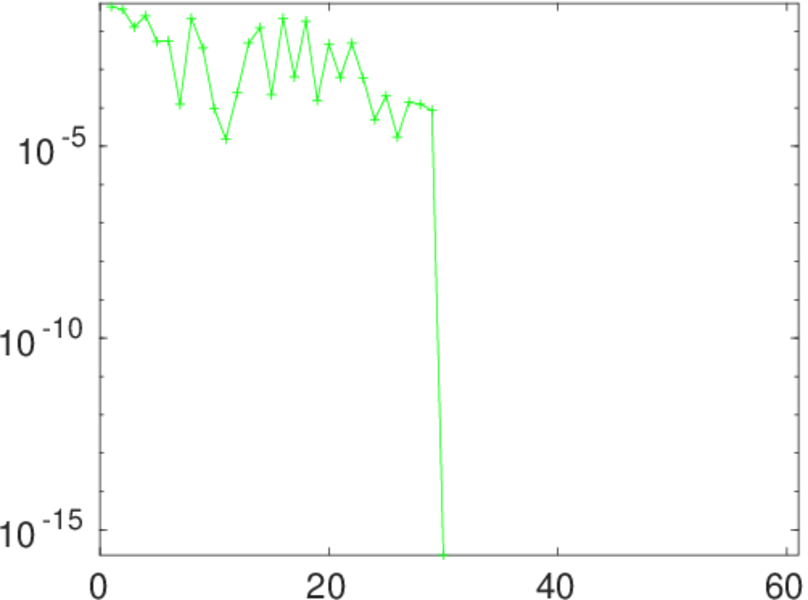
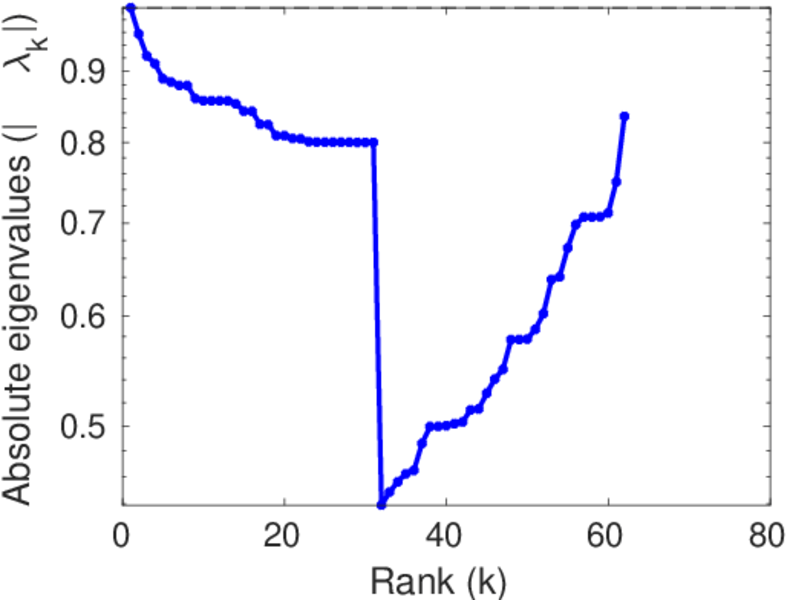
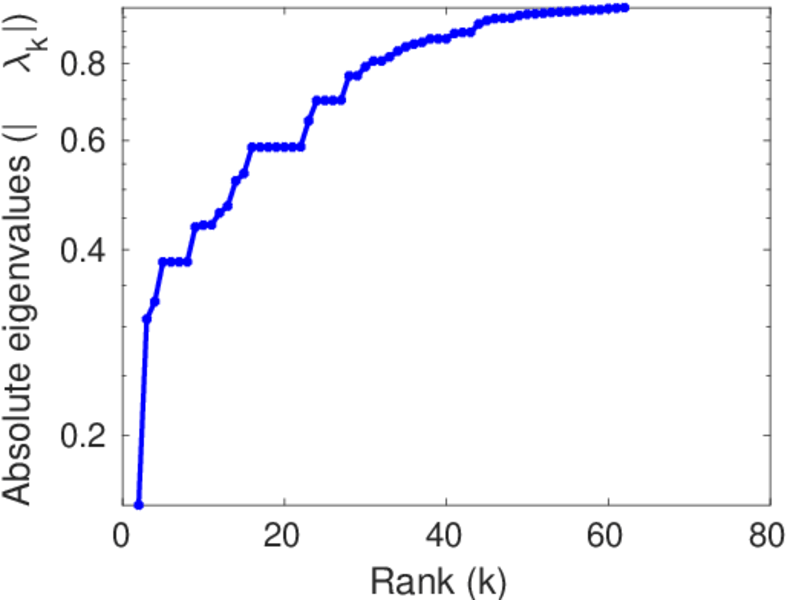
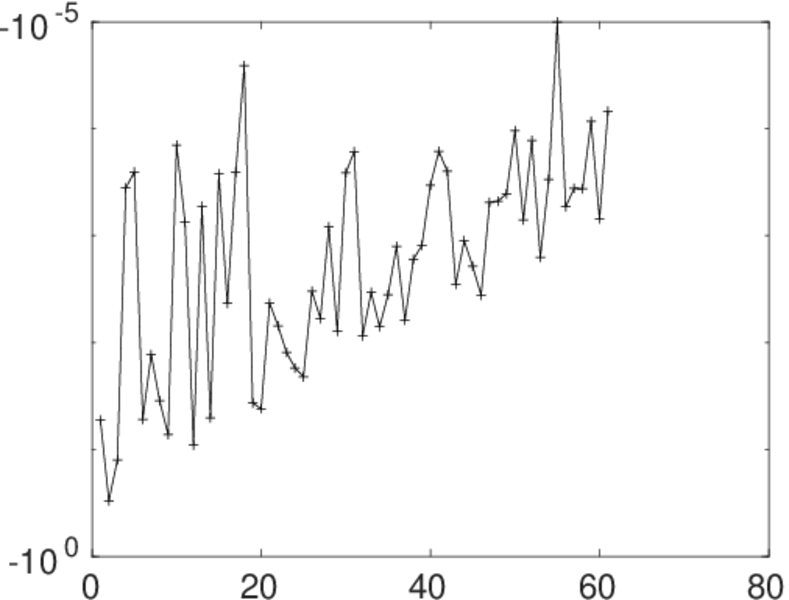
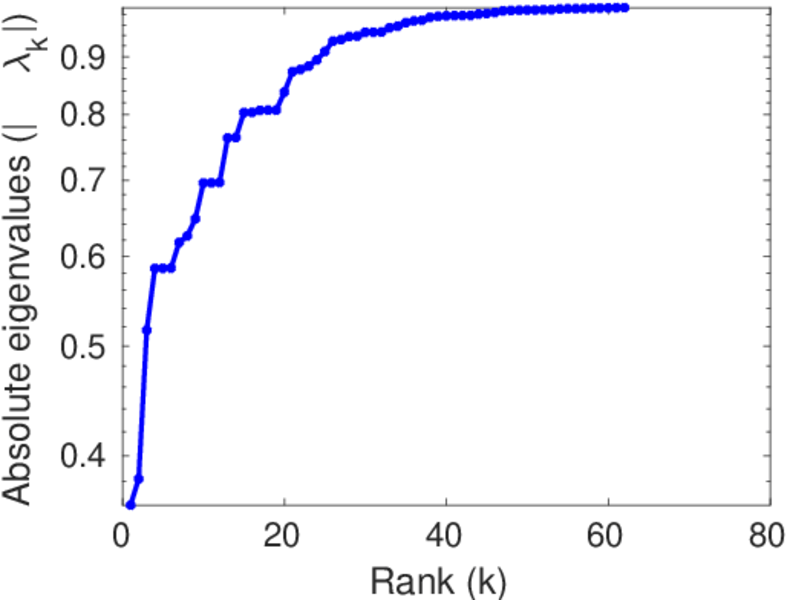
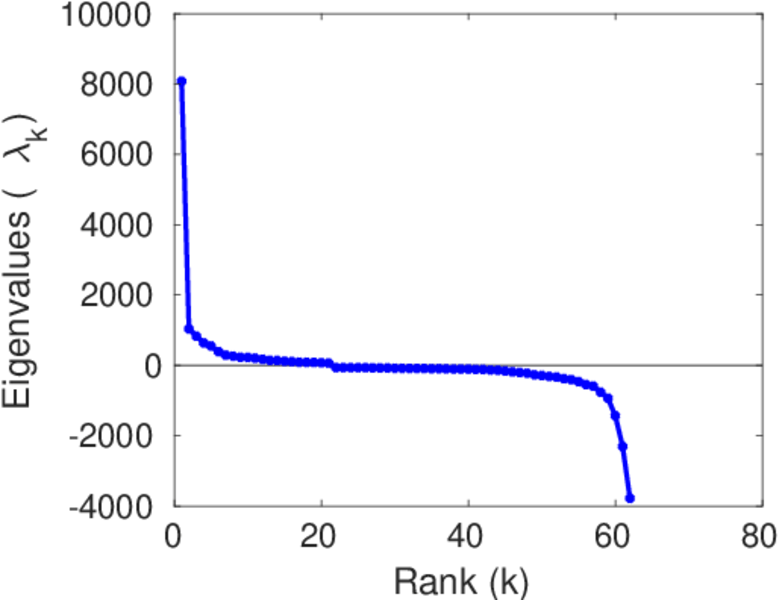
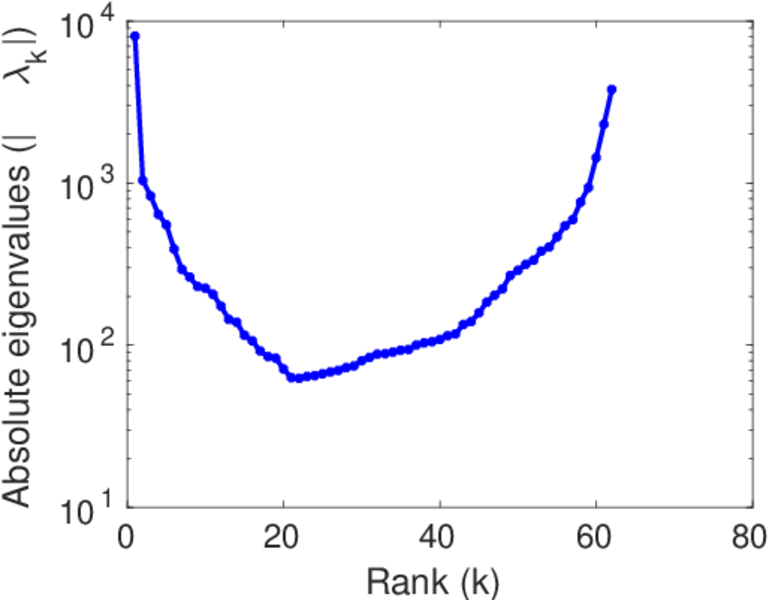
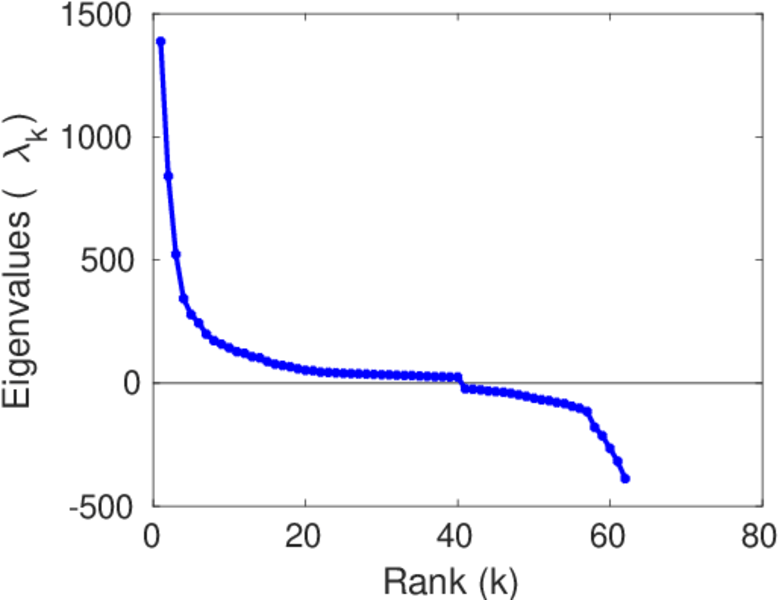
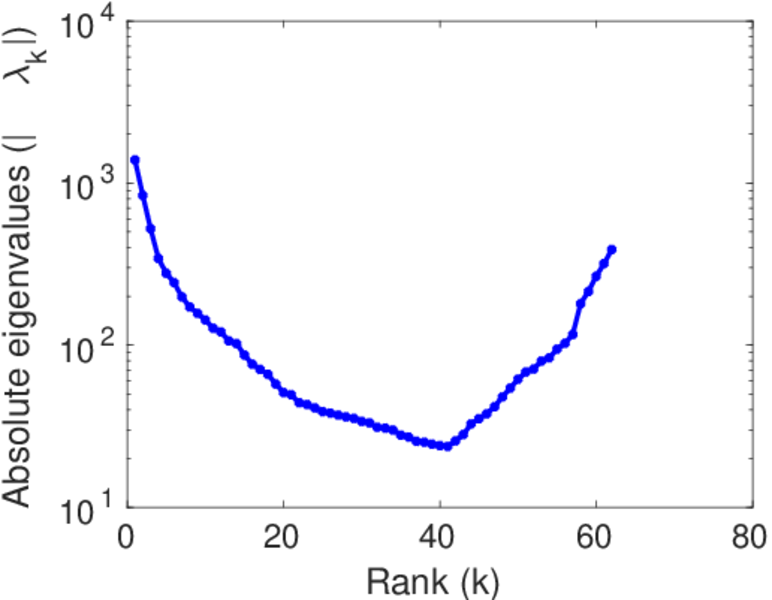
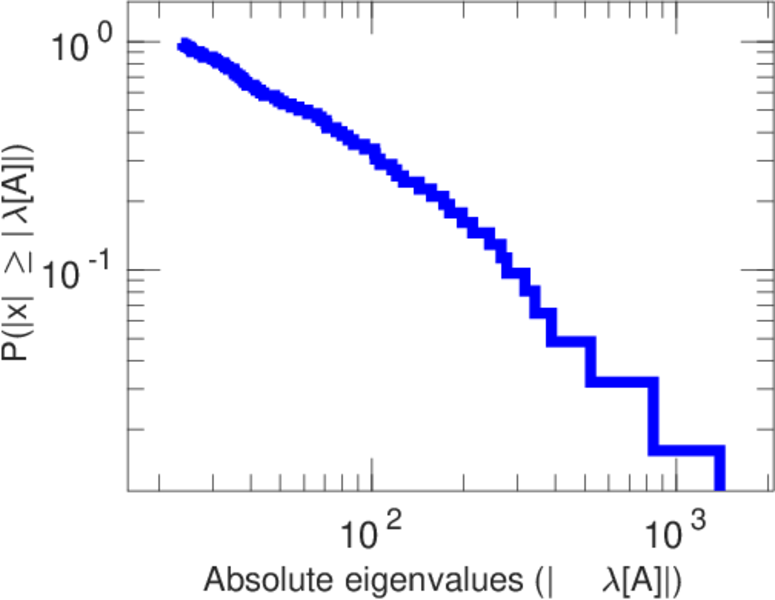
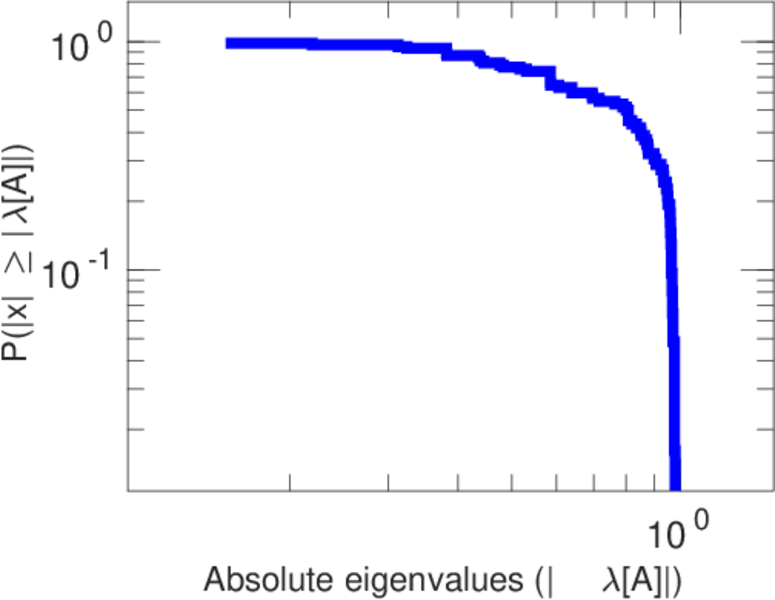
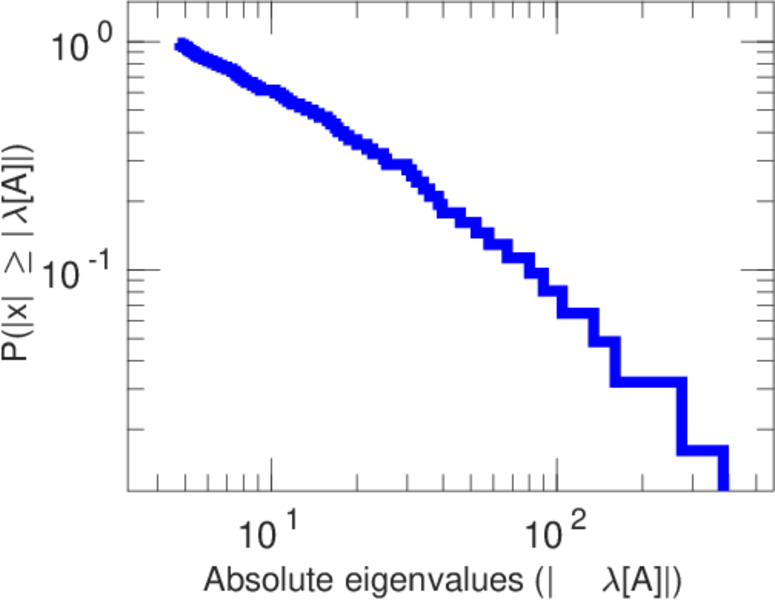
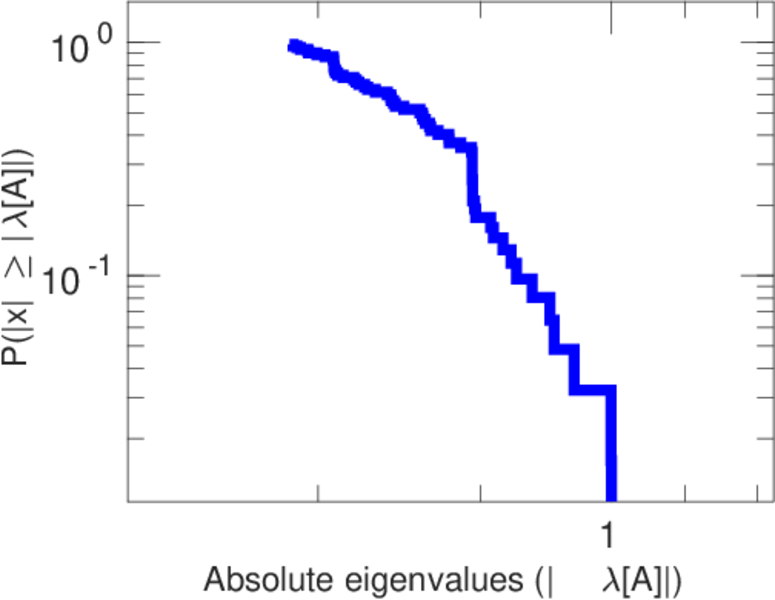
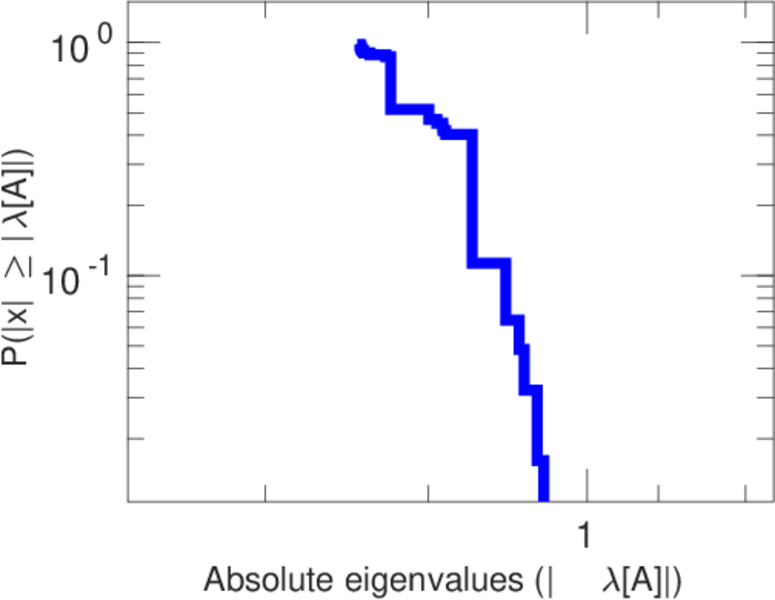
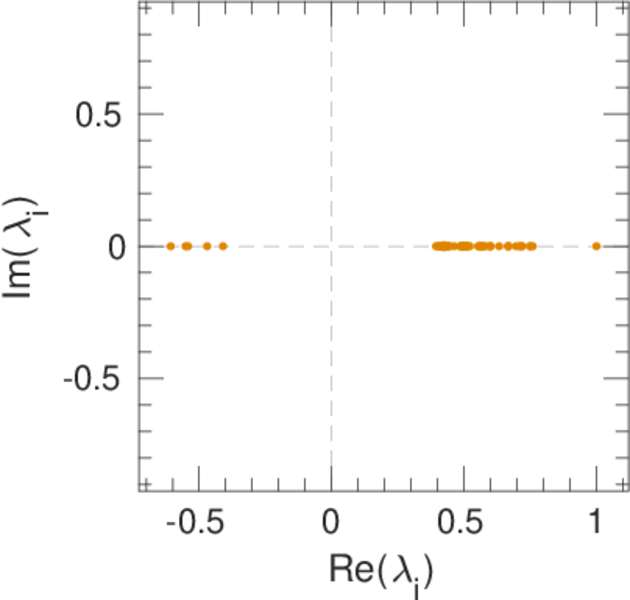
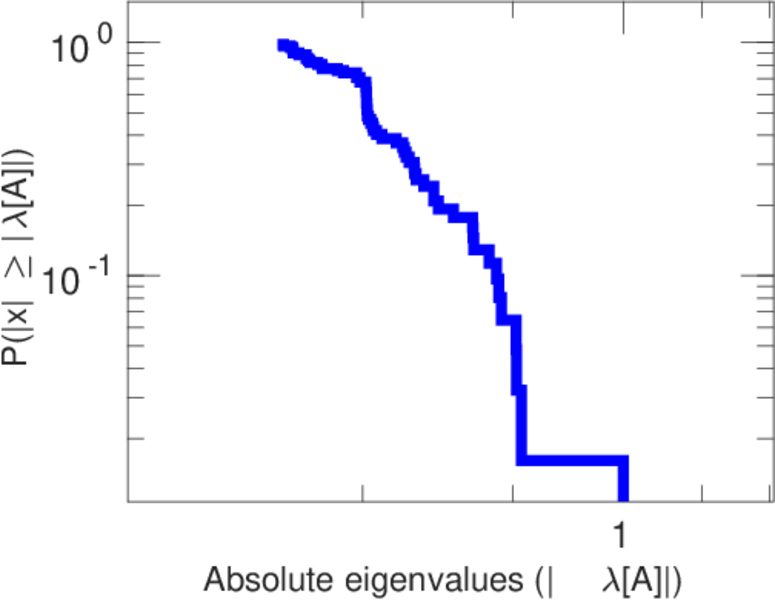
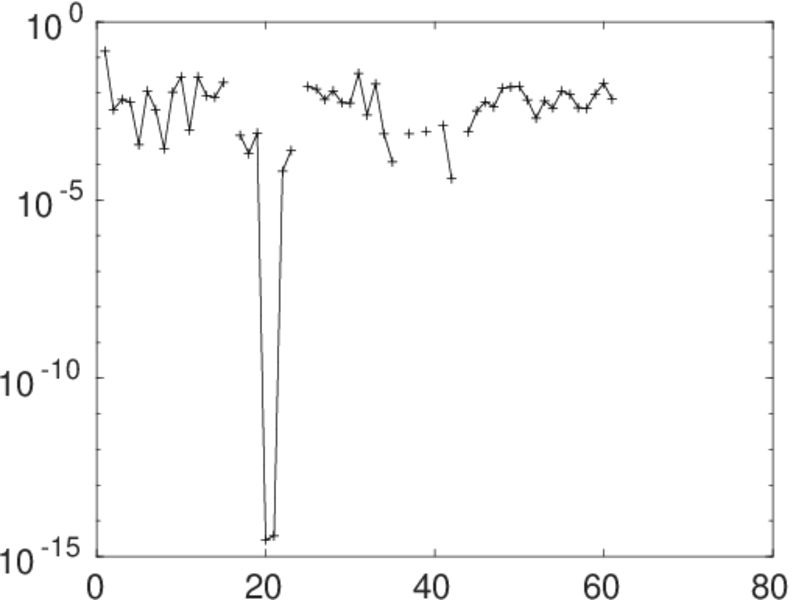
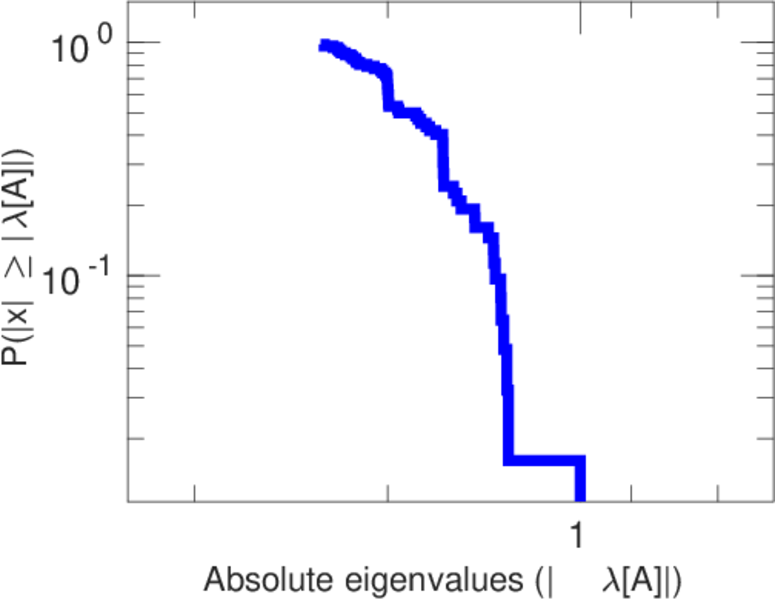
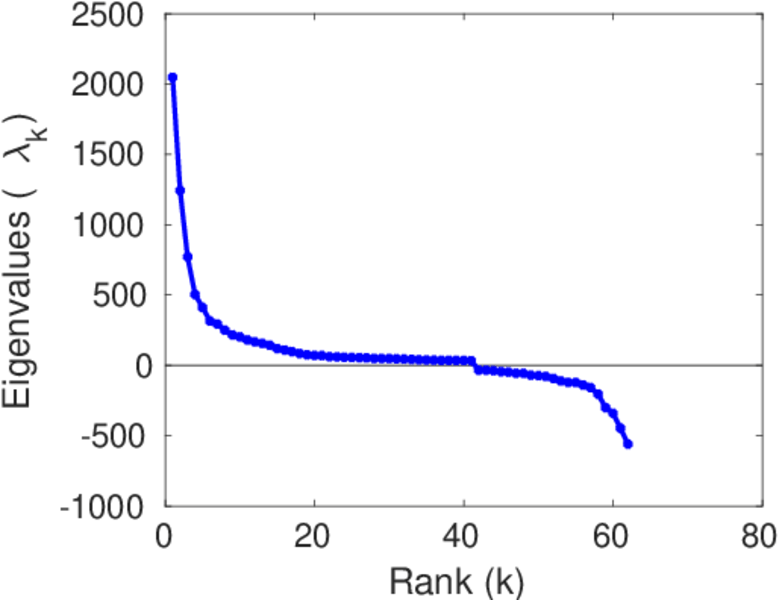
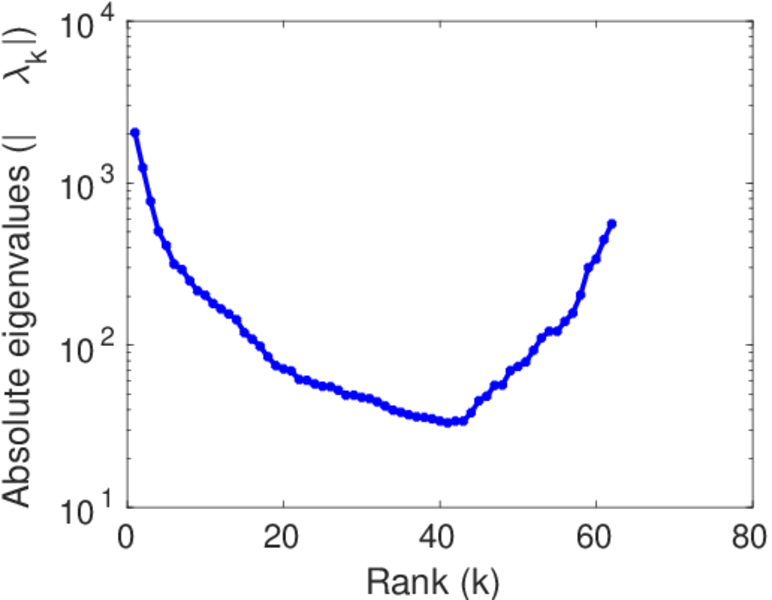
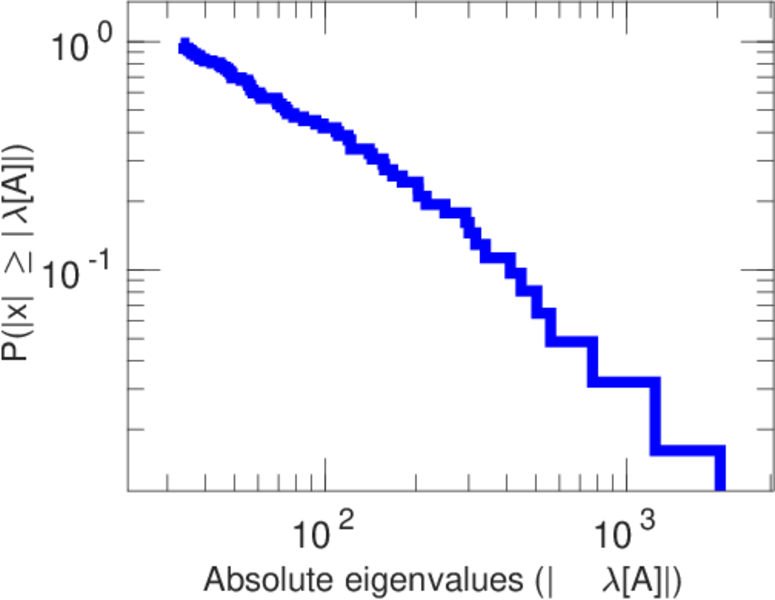
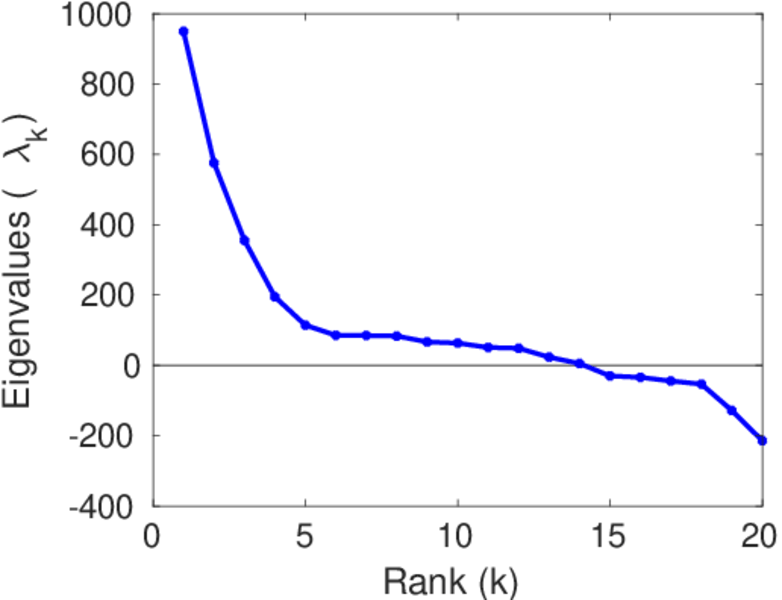
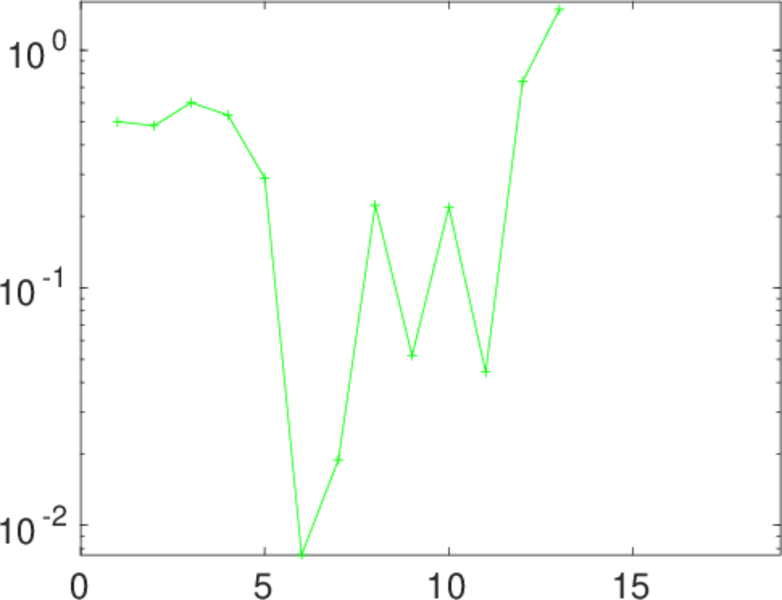
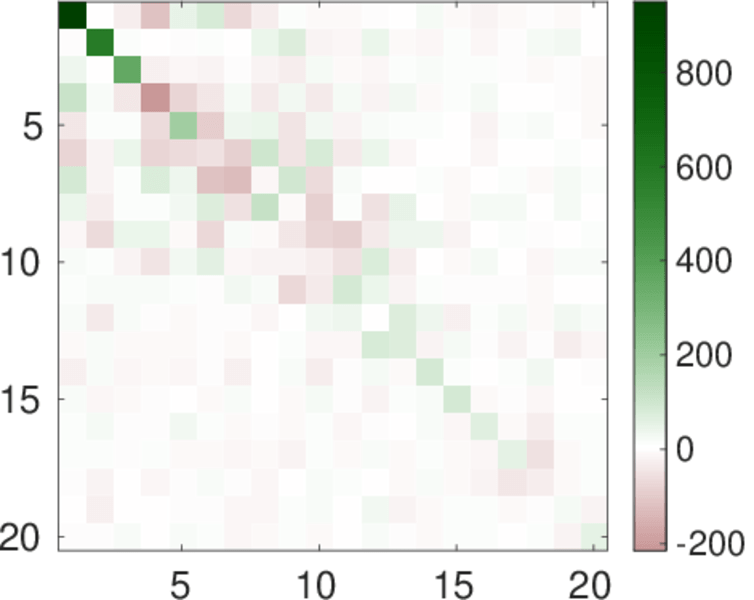
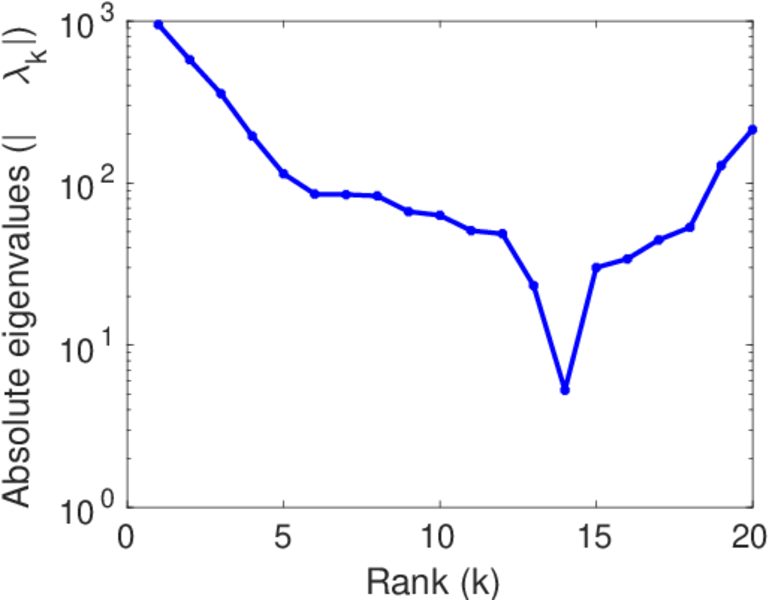
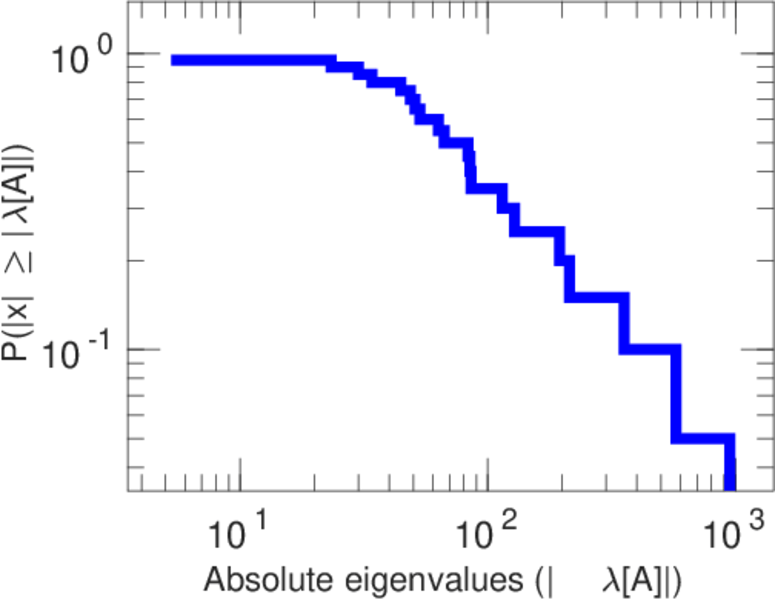
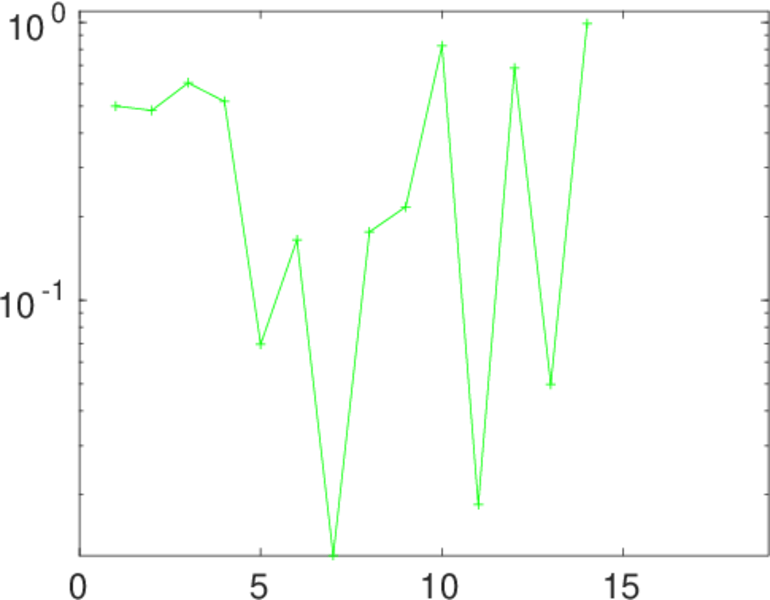
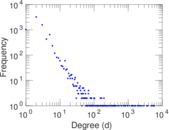
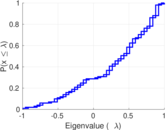
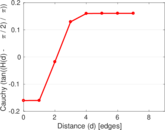
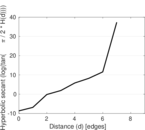
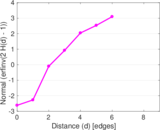
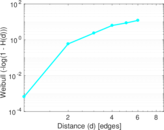
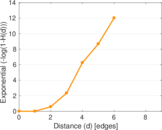
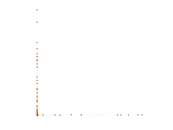
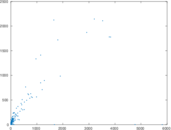
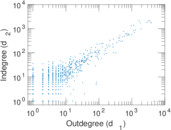
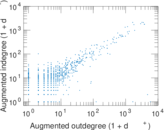
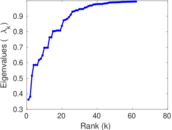
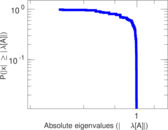
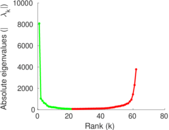
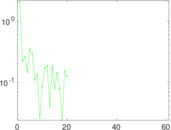
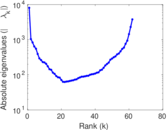
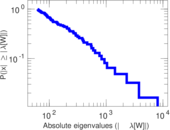
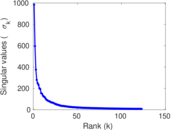
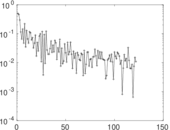
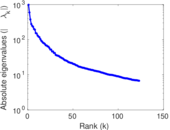
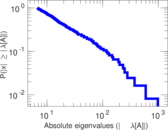
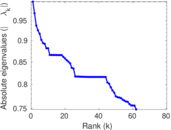
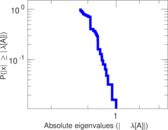
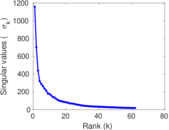
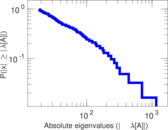
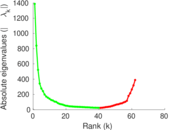
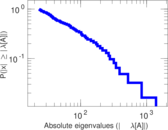
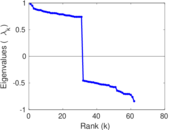
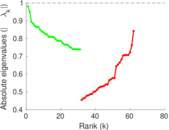
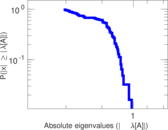
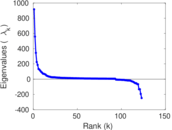
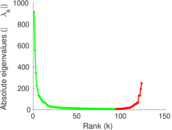
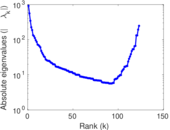
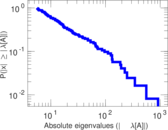
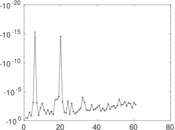
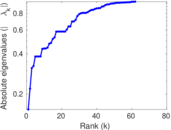
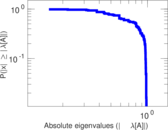
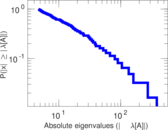
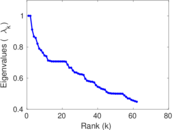
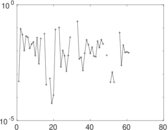
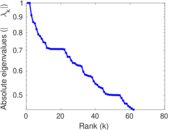
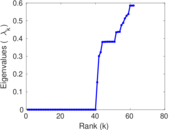
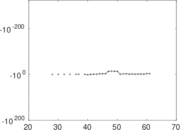
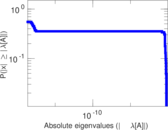
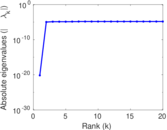
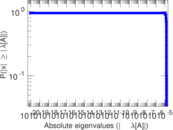
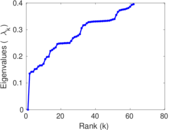
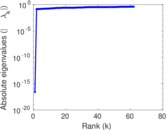
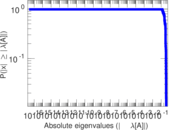
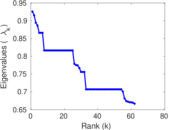
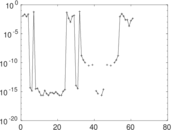
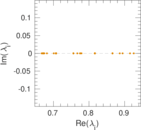
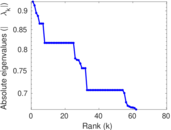
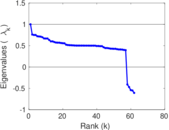
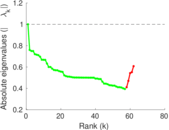
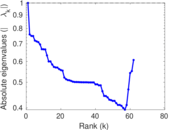
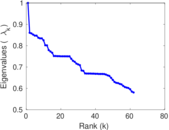
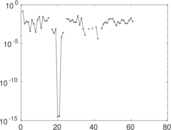
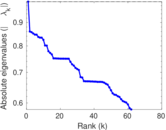
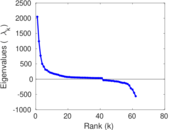
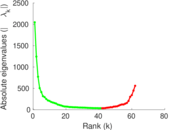
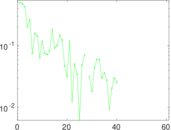
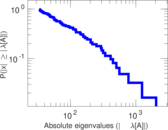
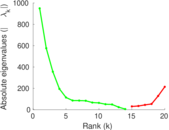
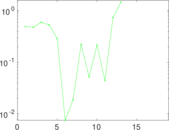
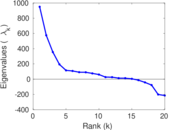
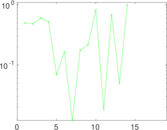
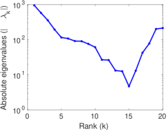
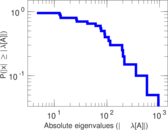
Plots


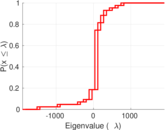

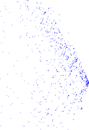
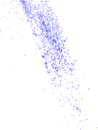
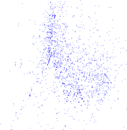


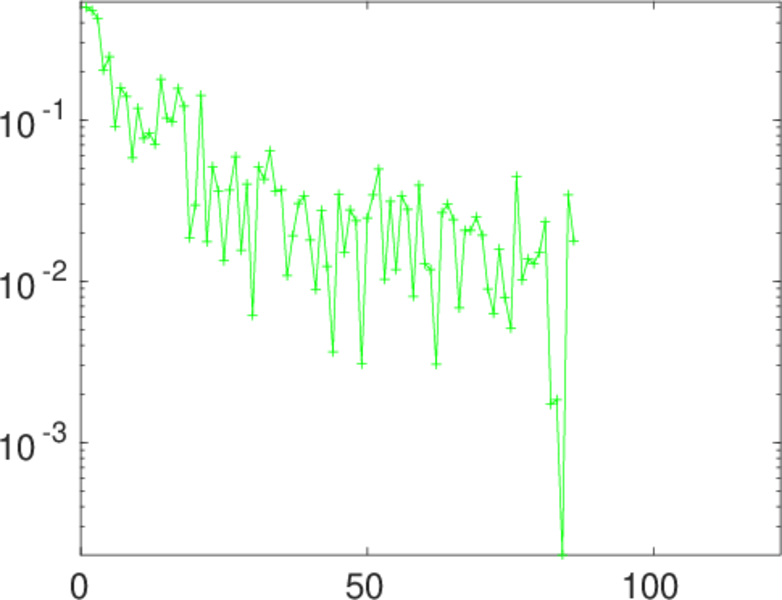
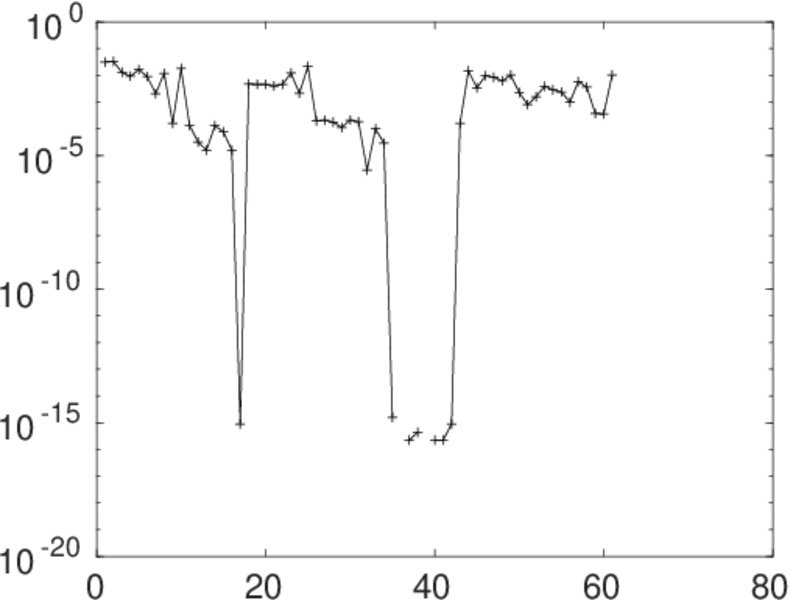
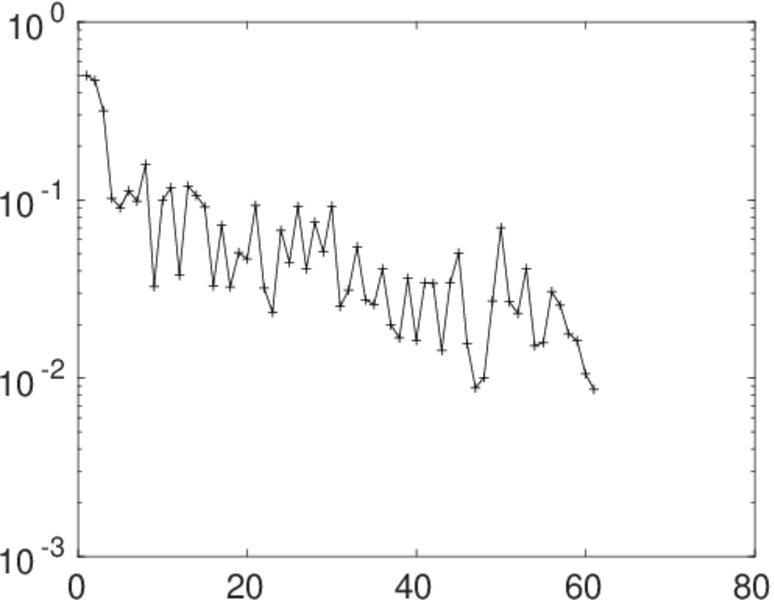
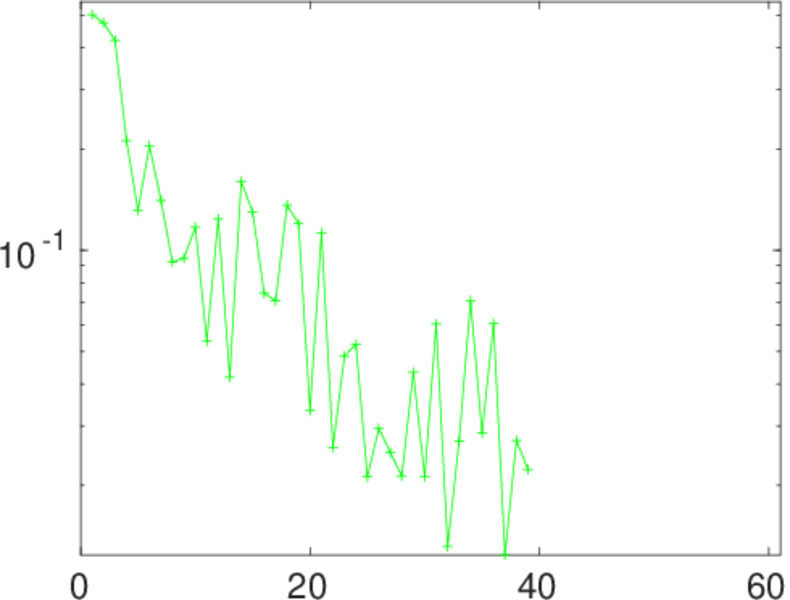
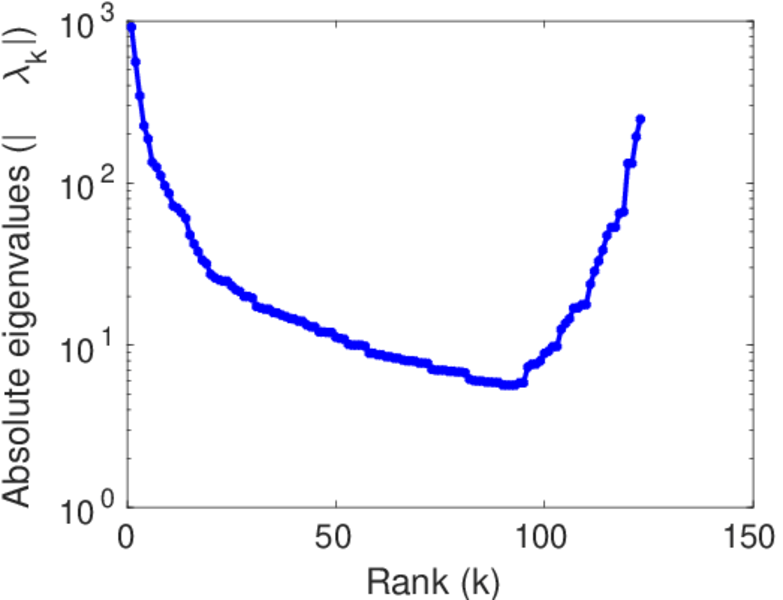
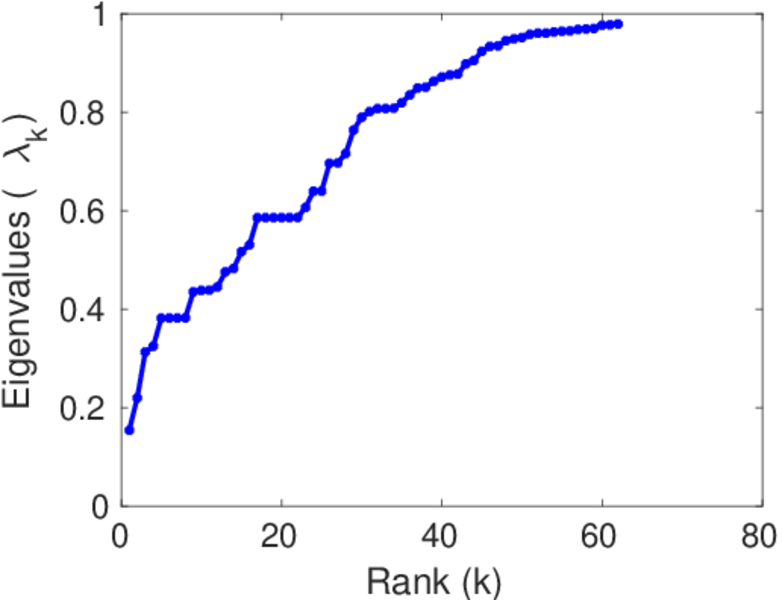
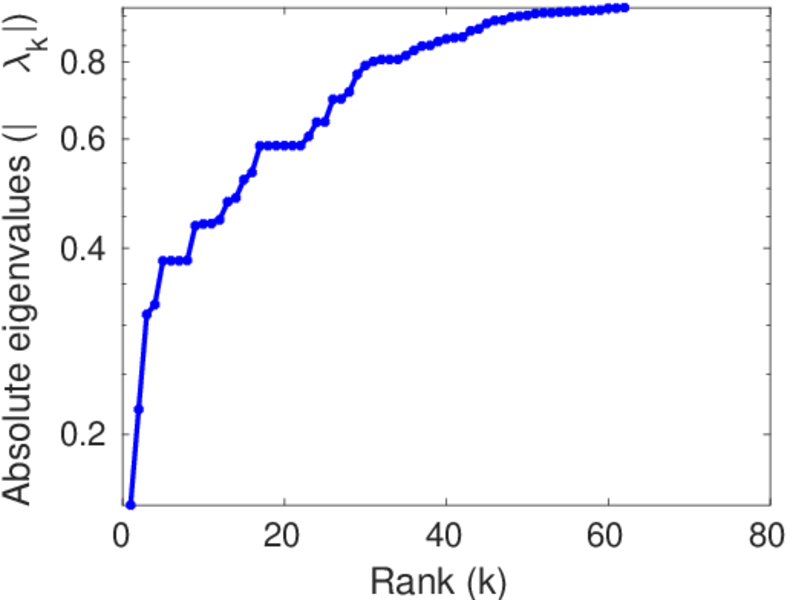
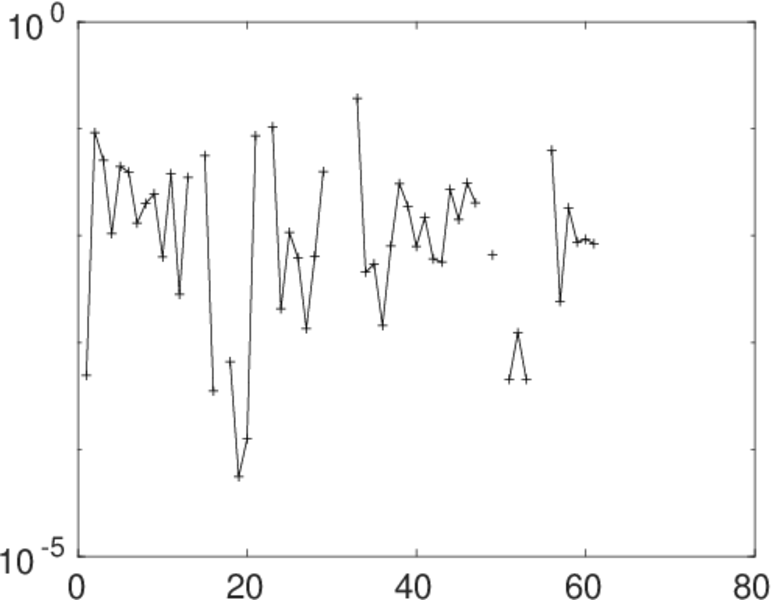
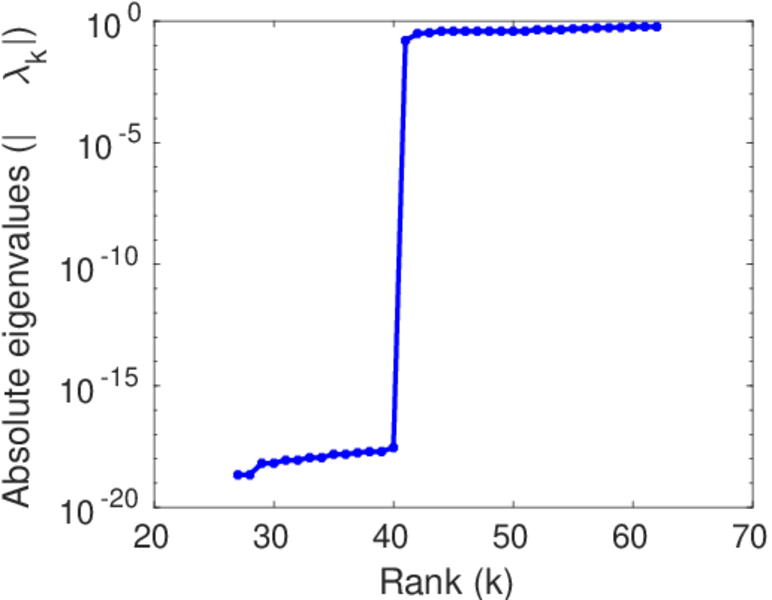
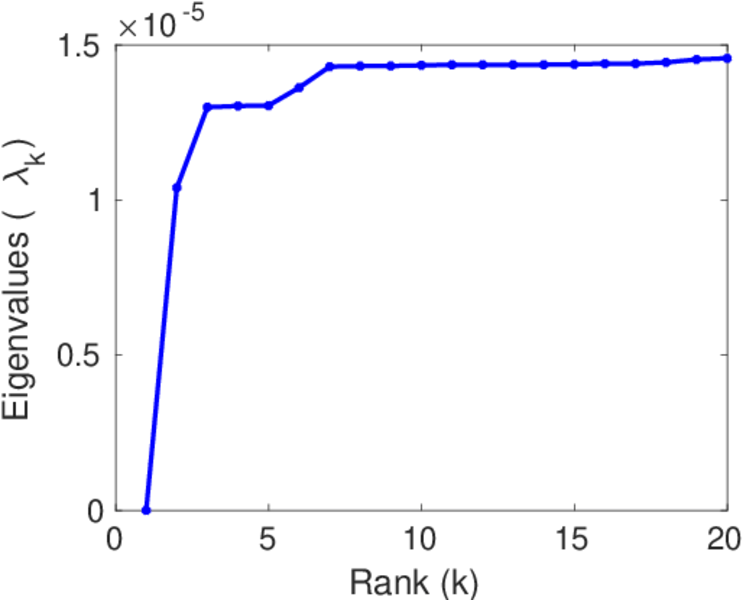
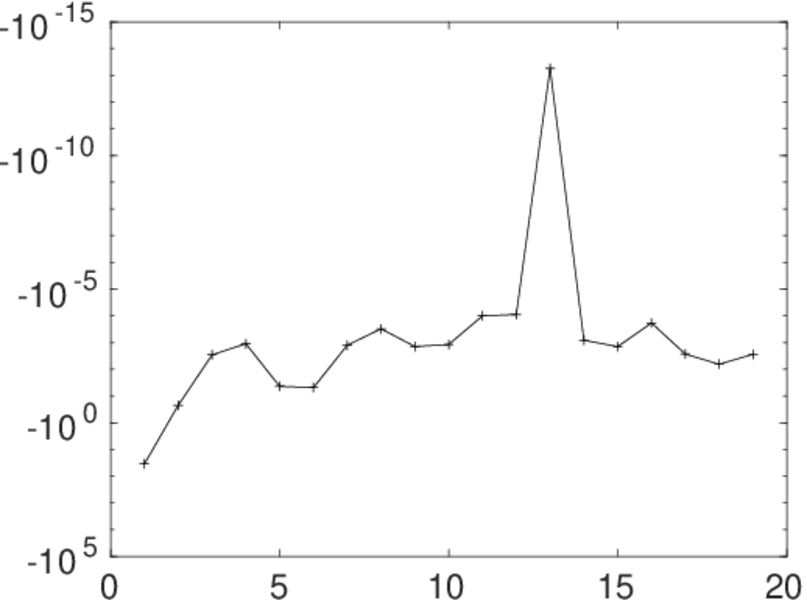
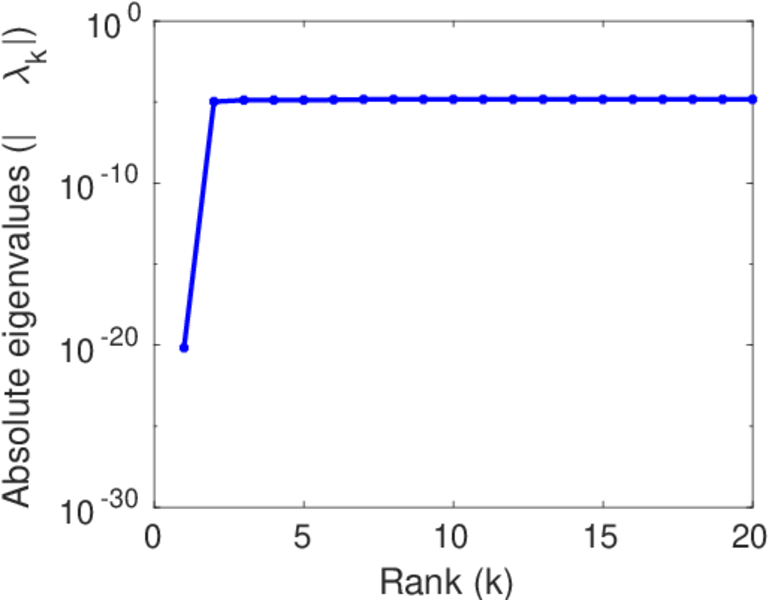
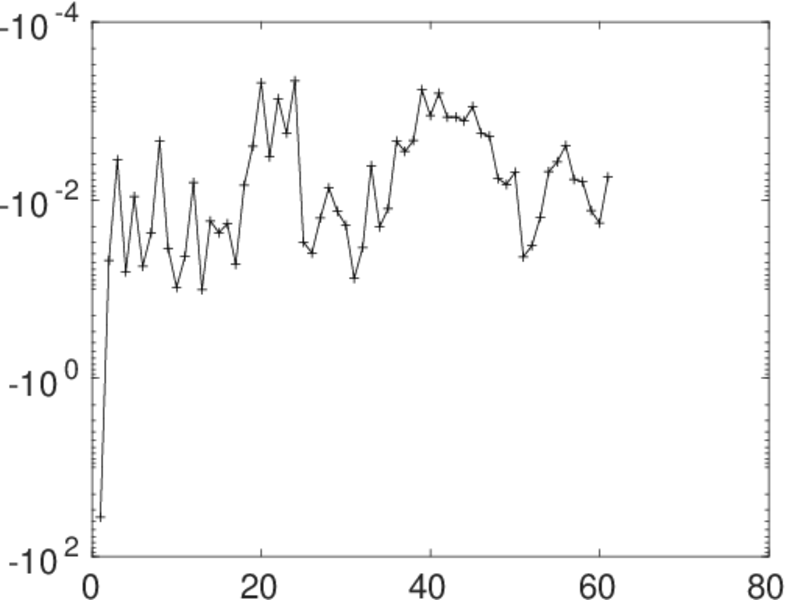
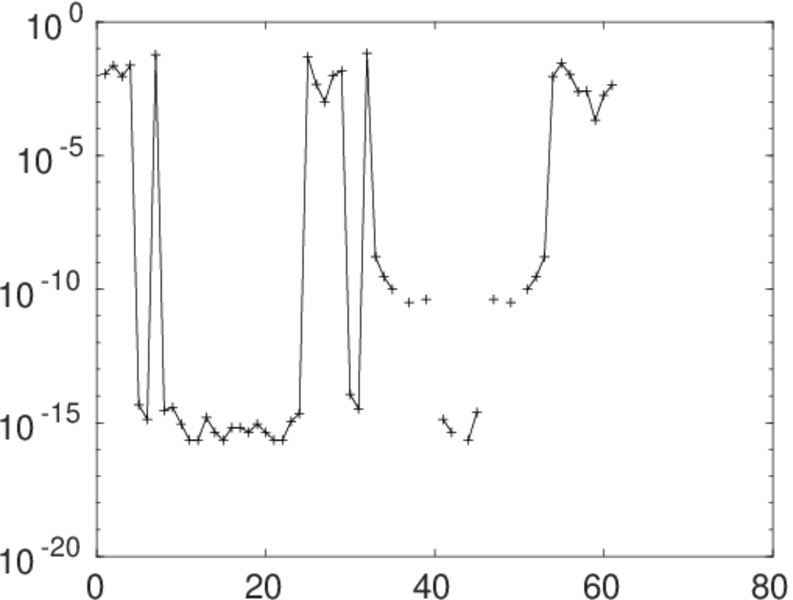
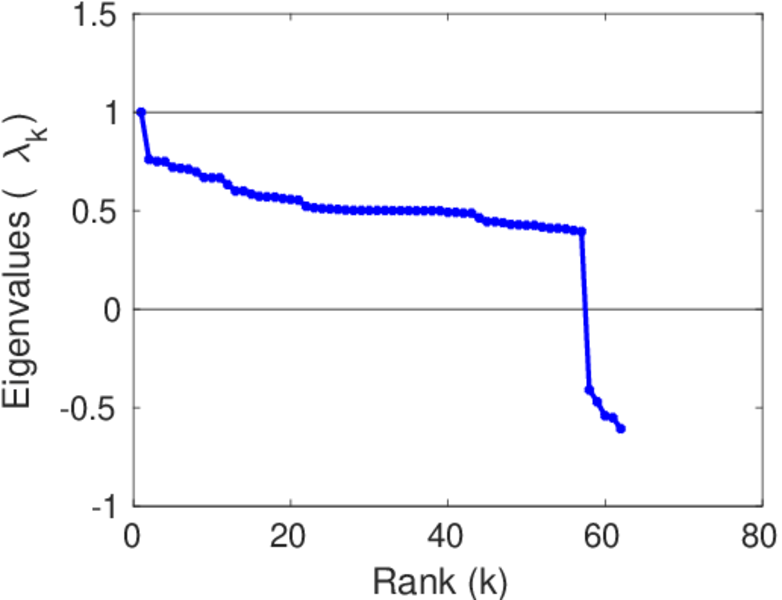
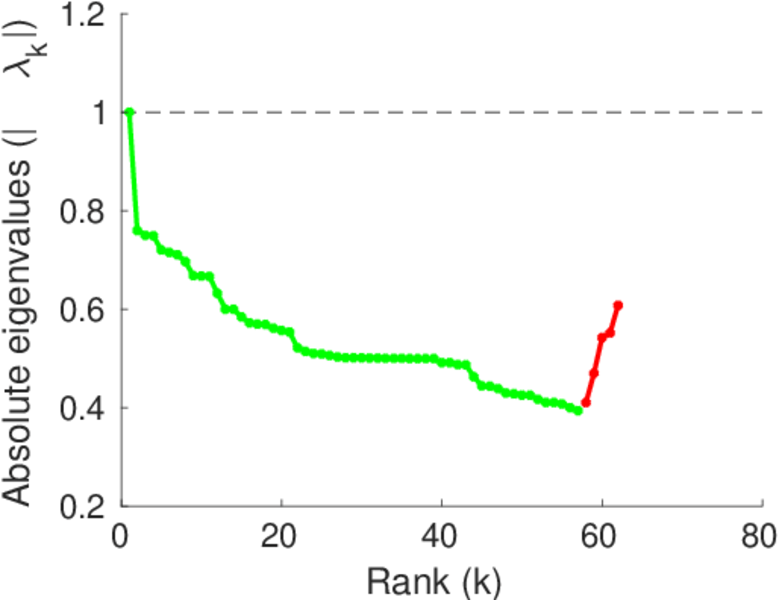
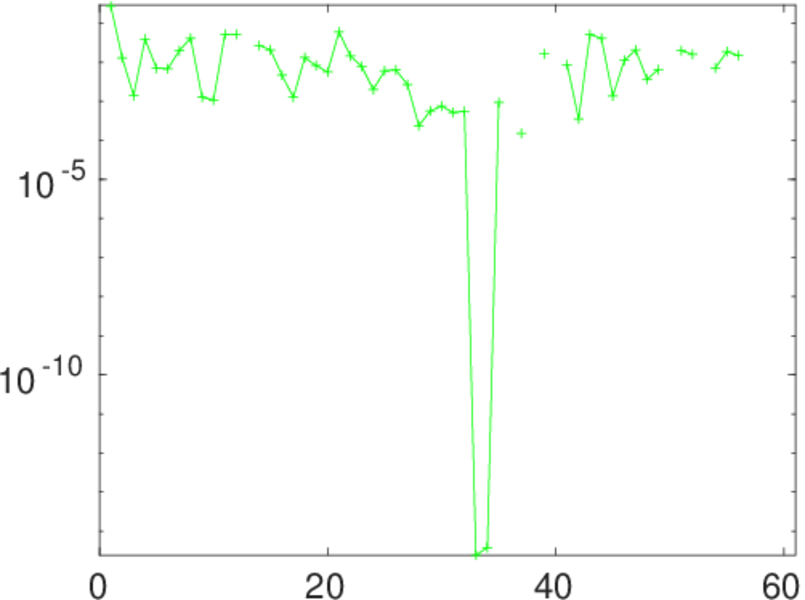
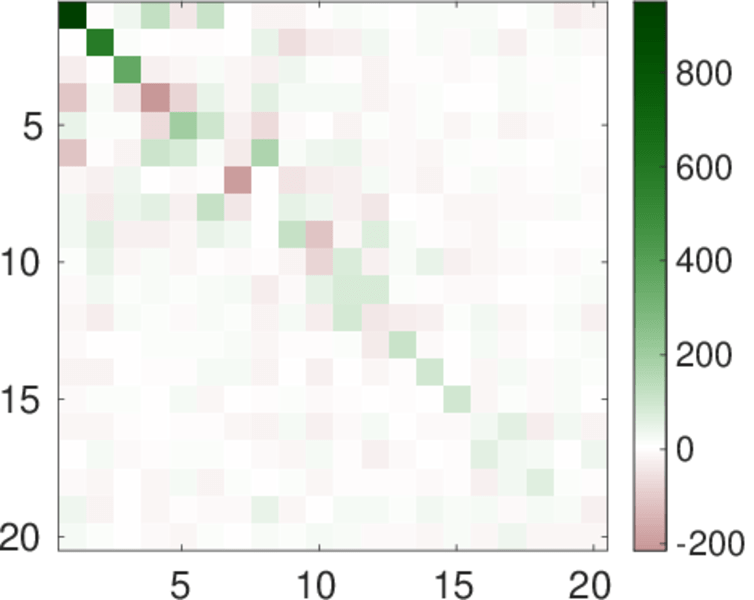
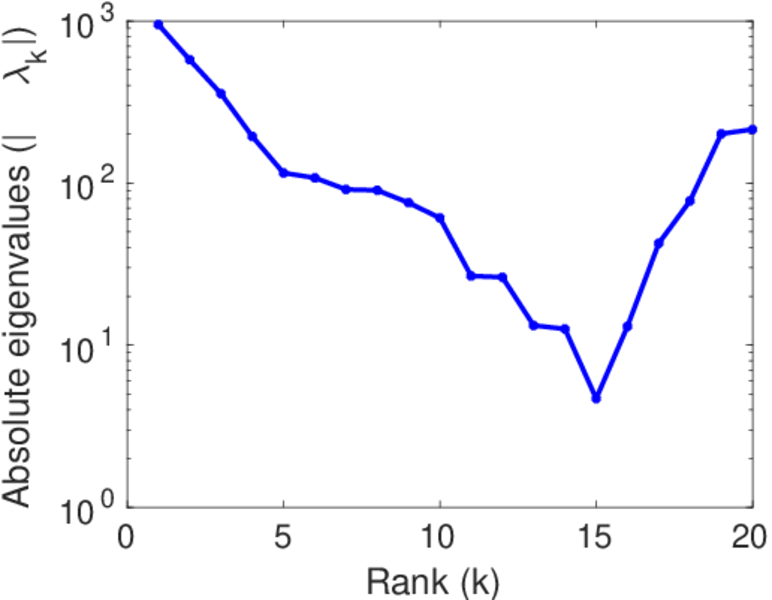
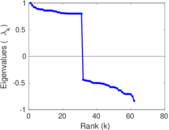
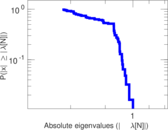
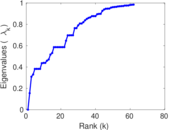
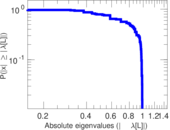
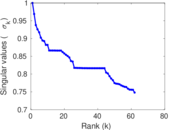
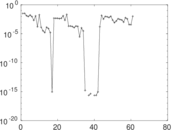
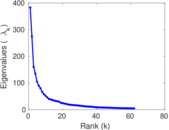
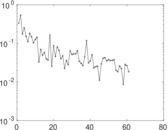
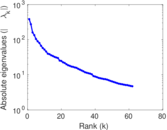
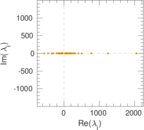
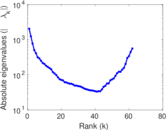
Matrix decompositions plots


Downloads
References
|
[1]
|
Jérôme Kunegis.
KONECT – The Koblenz Network Collection.
In Proc. Int. Conf. on World Wide Web Companion, pages
1343–1350, 2013.
[ http ]
|
|
[2]
|
Jun Sun, Jérôme Kunegis, and Steffen Staab.
Predicting user roles in social networks using transfer learning with
feature transformation.
In Proc. ICDM Workshop on Data Min. in Netw., 2016.
|
 KONECT ‣ Networks ‣
Buy Me a Coffee
KONECT ‣ Networks ‣
Buy Me a Coffee