Wikipedia talk (it)
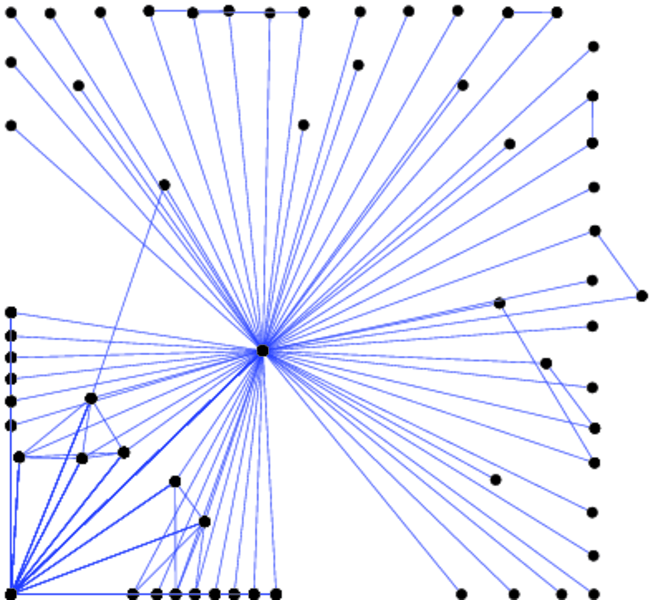
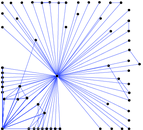
This is the communication network of the Italian Wikipedia. Nodes represent
users, and an edge from user A to user B denotes that user A wrote a message on
the talk page of user B at a certain timestamp.
Metadata
Statistics
| Size | n = | 863,846
|
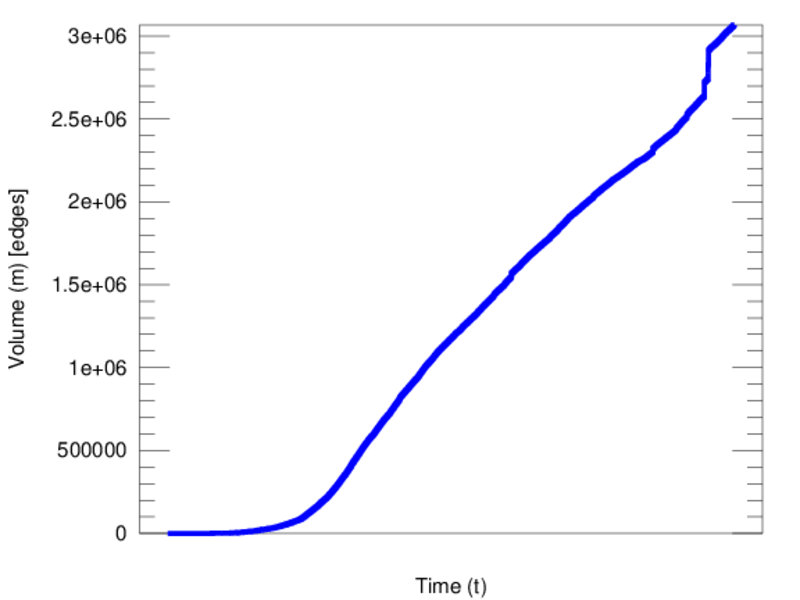
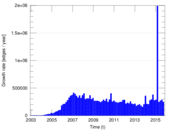
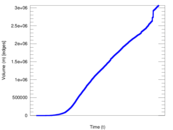
| Volume | m = | 3,067,680
|
| Unique edge count | m̿ = | 1,661,453
|
| Loop count | l = | 233,216
|
| Wedge count | s = | 111,830,205,348
|
| Claw count | z = | 11,983,312,889,964,536
|
| Cross count | x = | 1.065 98 × 1021
|
| Triangle count | t = | 3,355,399
|
| Square count | q = | 6,154,887,250
|
| 4-Tour count | T4 = | 496,562,923,582
|
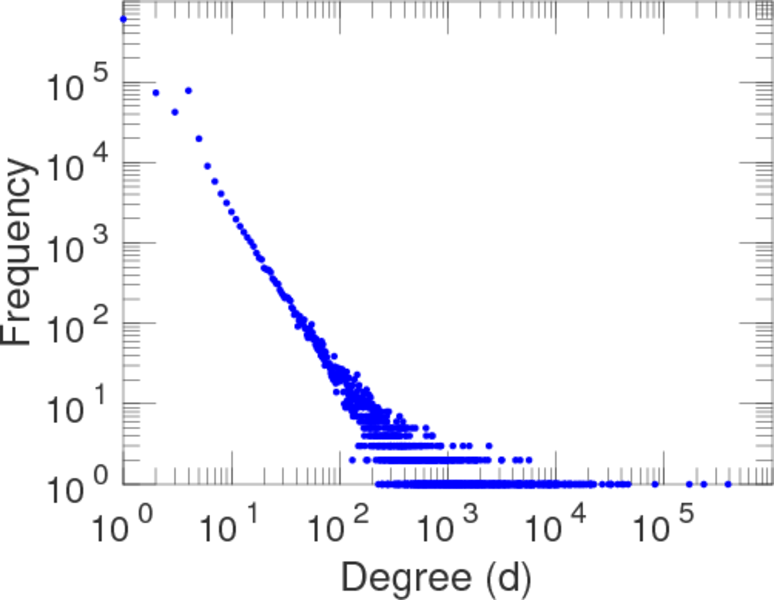
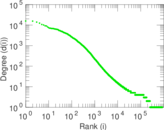
| Maximum degree | dmax = | 388,889
|
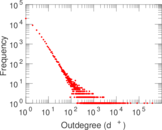
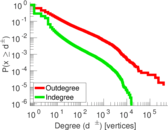
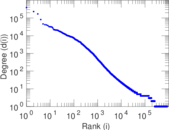
| Maximum outdegree | d+max = | 388,882
|
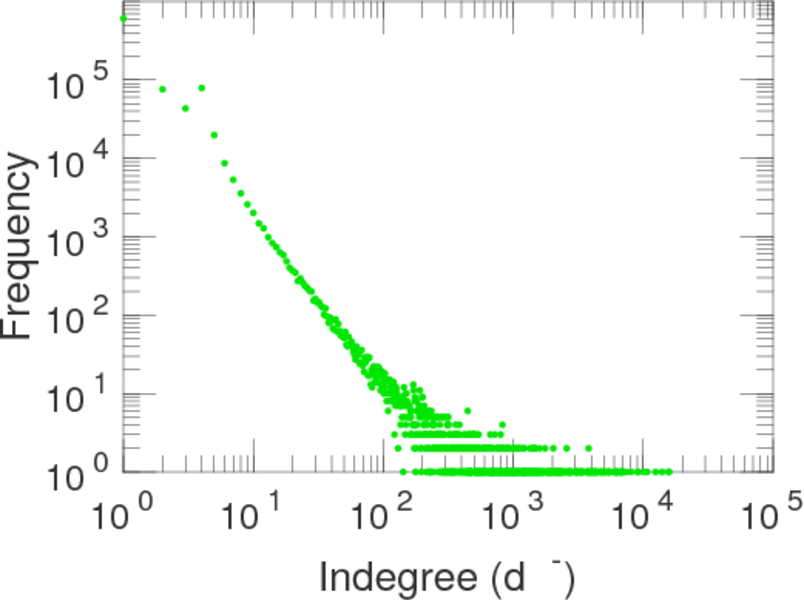
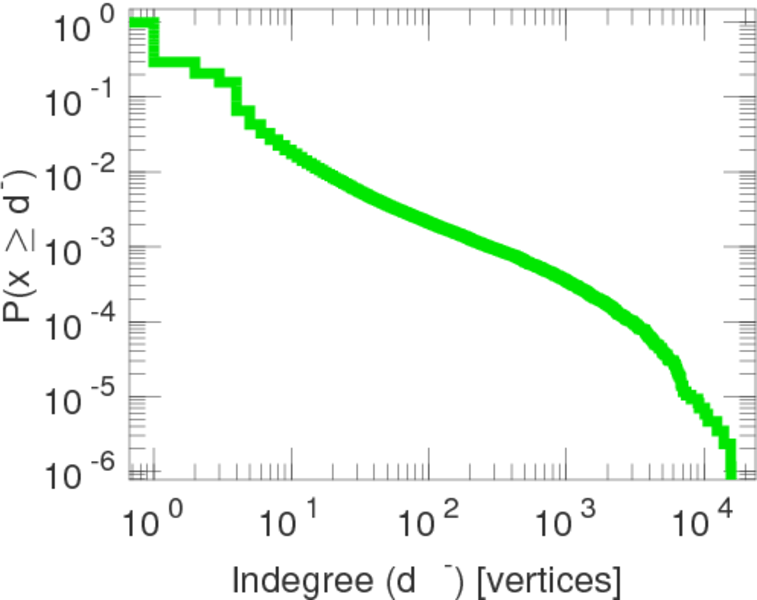
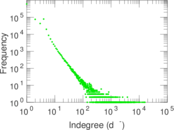
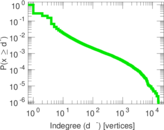
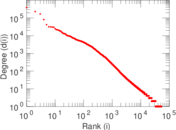
| Maximum indegree | d−max = | 15,811
|
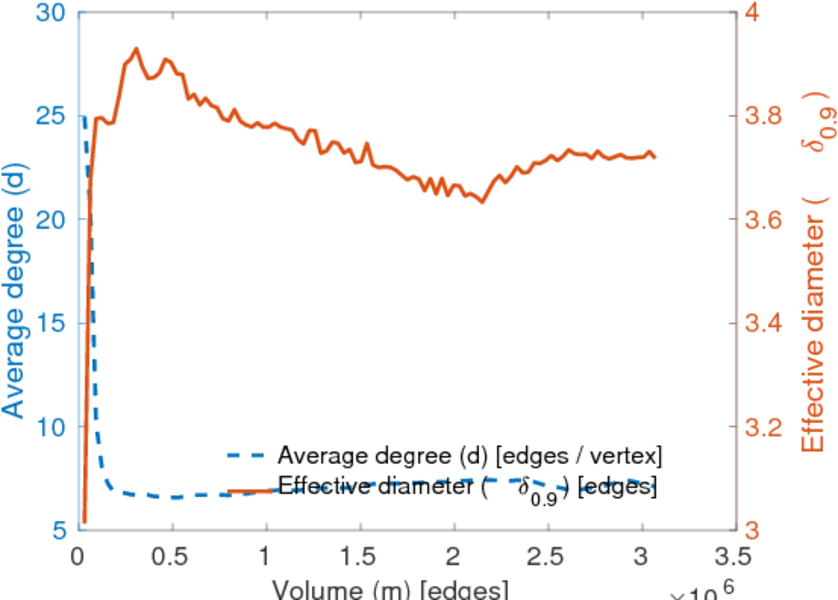
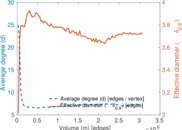
| Average degree | d = | 7.102 38
|
| Fill | p = | 2.226 46 × 10−6
|
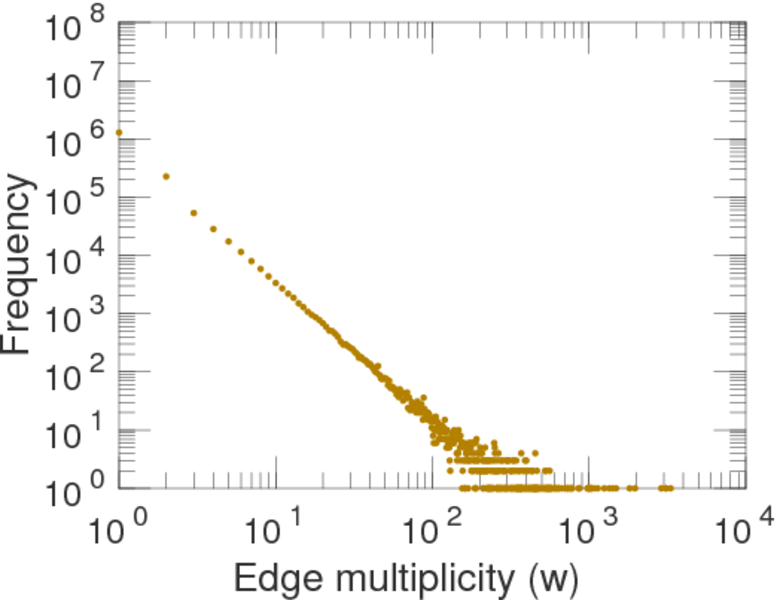
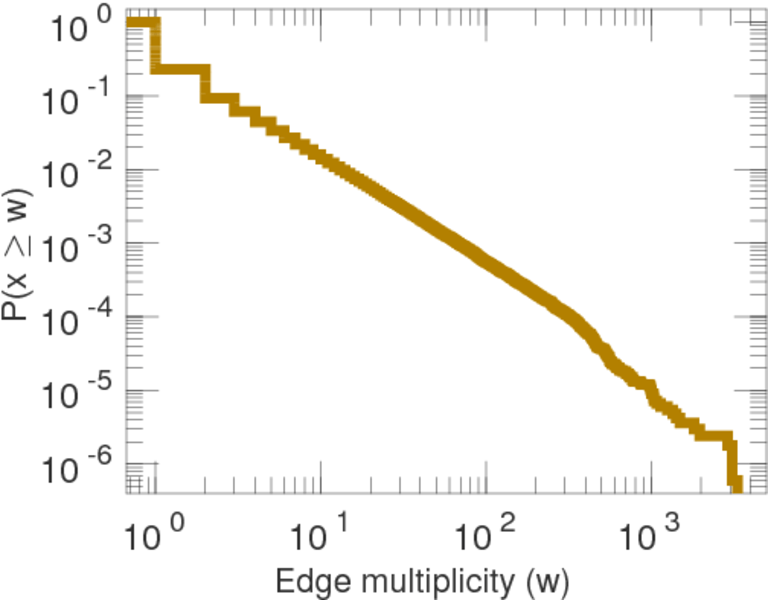
| Average edge multiplicity | m̃ = | 1.846 38
|
| Size of LCC | N = | 862,214
|
| Size of LSCC | Ns = | 36,356
|
| Relative size of LSCC | Nrs = | 0.042 086 2
|
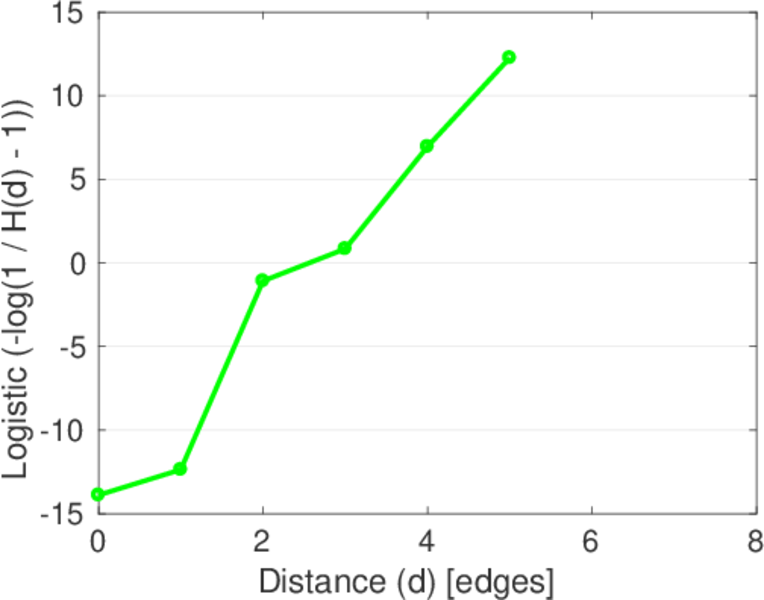
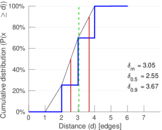
| Diameter | δ = | 7
|
| 50-Percentile effective diameter | δ0.5 = | 2.554 95
|
| 90-Percentile effective diameter | δ0.9 = | 3.670 68
|
| Median distance | δM = | 3
|
| Mean distance | δm = | 3.049 93
|
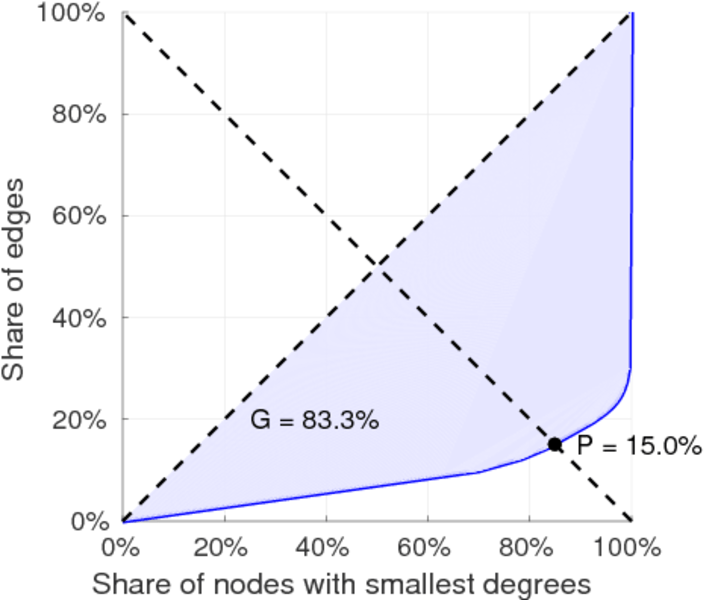
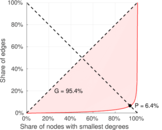
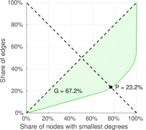
| Gini coefficient | G = | 0.832 891
|
| Balanced inequality ratio | P = | 0.149 587
|
| Outdegree balanced inequality ratio | P+ = | 0.064 084 9
|
| Indegree balanced inequality ratio | P− = | 0.232 251
|
| Relative edge distribution entropy | Her = | 0.681 910
|
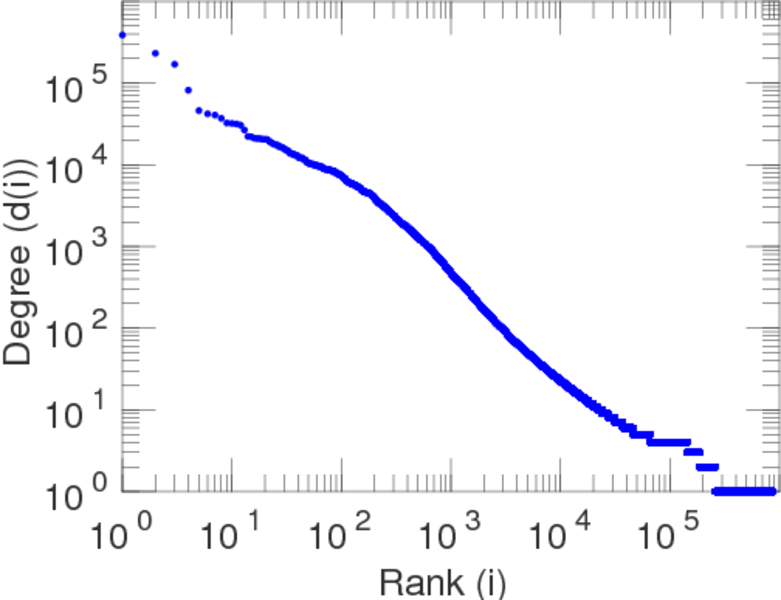
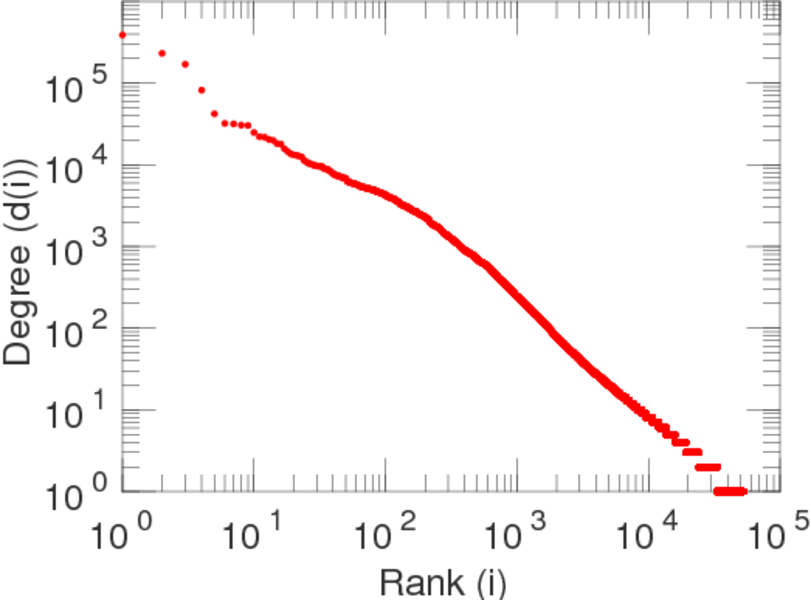
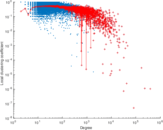
| Power law exponent | γ = | 4.229 38
|
| Tail power law exponent | γt = | 1.791 00
|
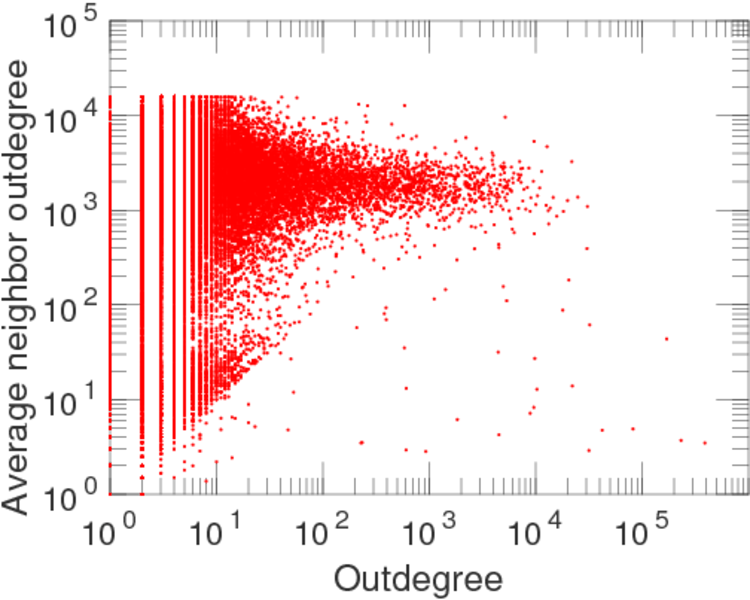
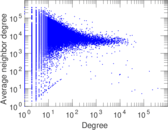
| Degree assortativity | ρ = | −0.301 420
|
| Degree assortativity p-value | pρ = | 0.000 00
|
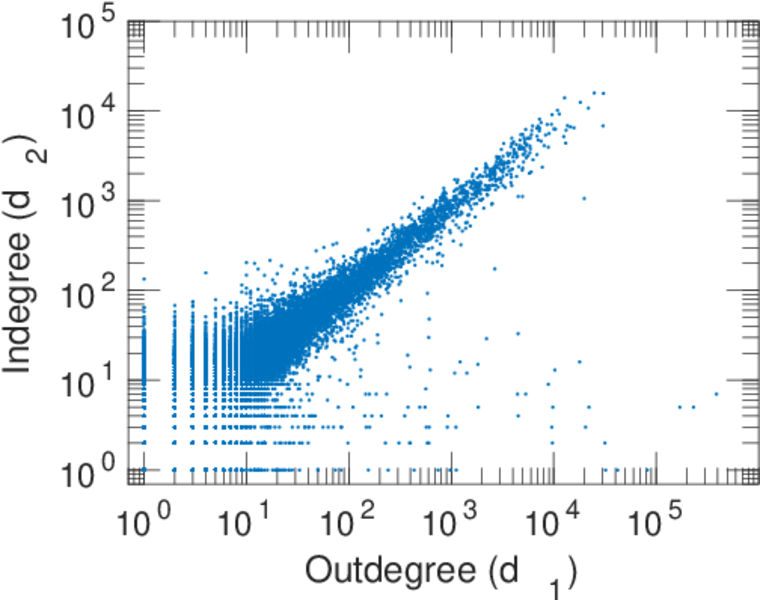
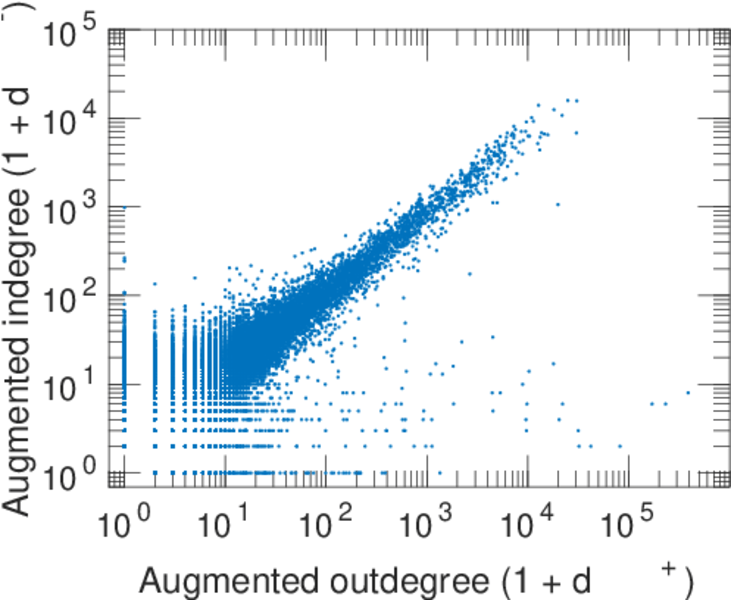
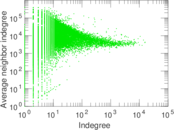
| In/outdegree correlation | ρ± = | +0.694 897
|
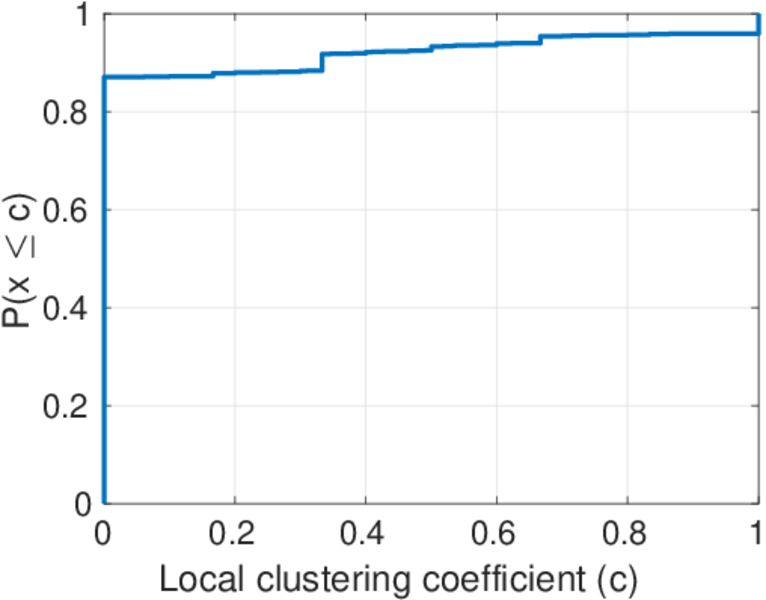
| Clustering coefficient | c = | 9.001 32 × 10−5
|
| Directed clustering coefficient | c± = | 0.030 690 5
|
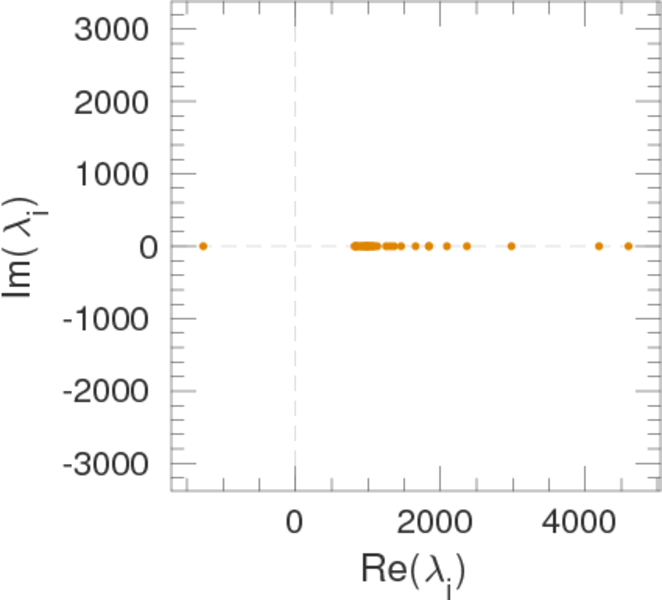
| Spectral norm | α = | 9,318.44
|
| Operator 2-norm | ν = | 4,750.84
|
| Cyclic eigenvalue | π = | 4,599.85
|
| Algebraic connectivity | a = | 0.102 767
|
| Spectral separation | |λ1[A] / λ2[A]| = | 1.103 69
|
| Reciprocity | y = | 0.174 273
|
| Non-bipartivity | bA = | 0.712 796
|
| Normalized non-bipartivity | bN = | 0.029 882 2
|
| Algebraic non-bipartivity | χ = | 0.067 031 7
|
| Spectral bipartite frustration | bK = | 0.004 722 98
|
| Controllability | C = | 831,096
|
| Relative controllability | Cr = | 0.962 088
|
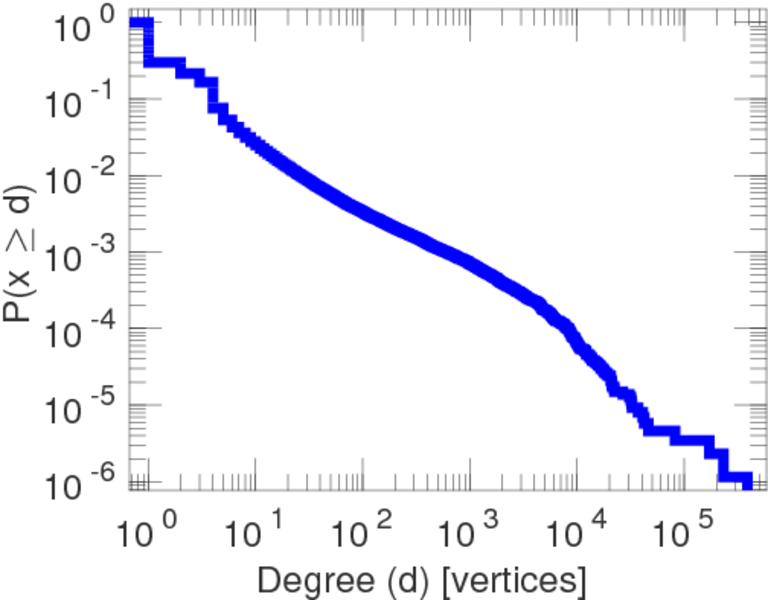
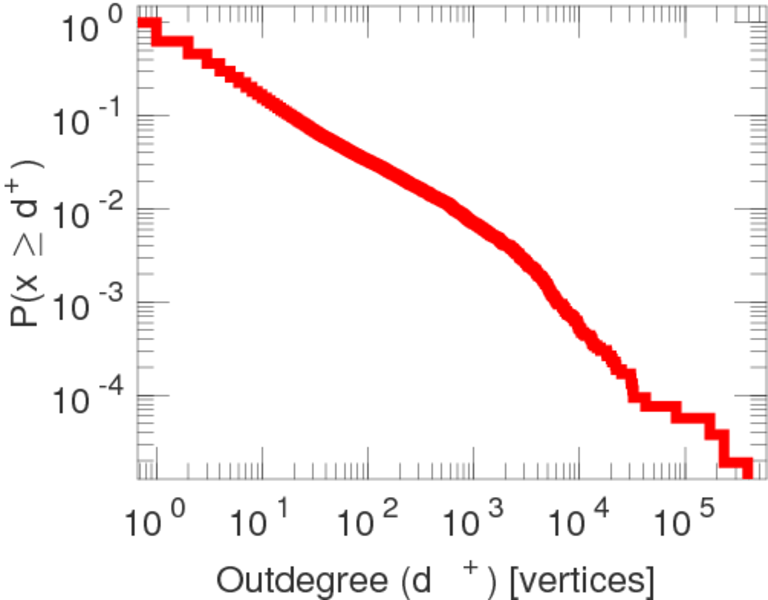
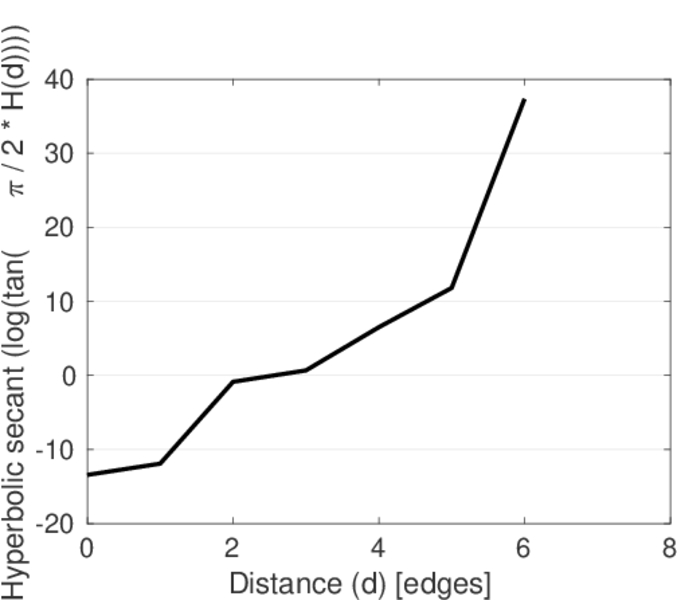
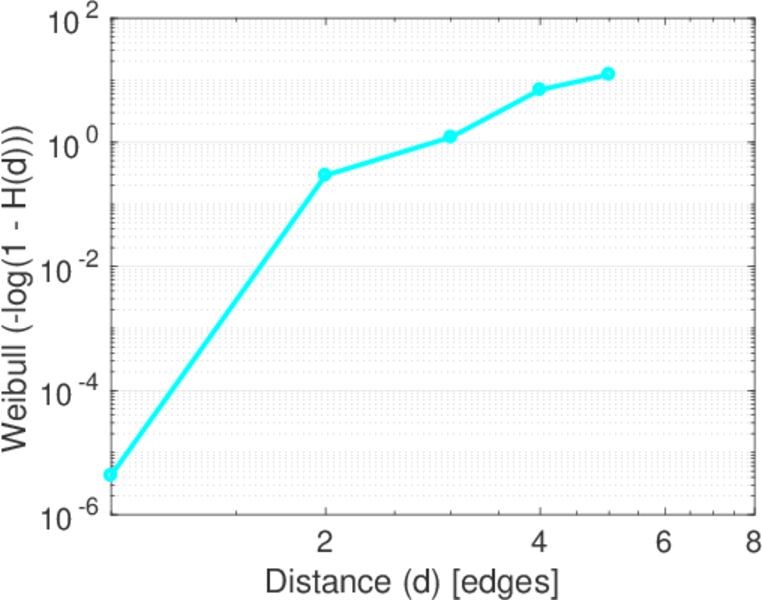
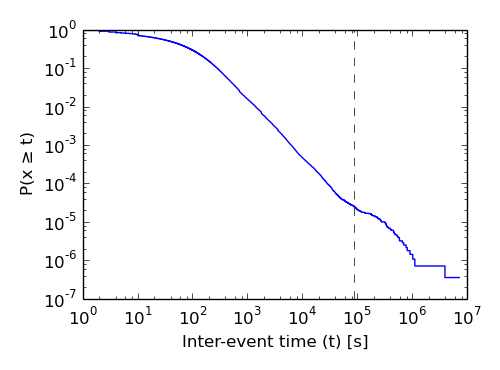
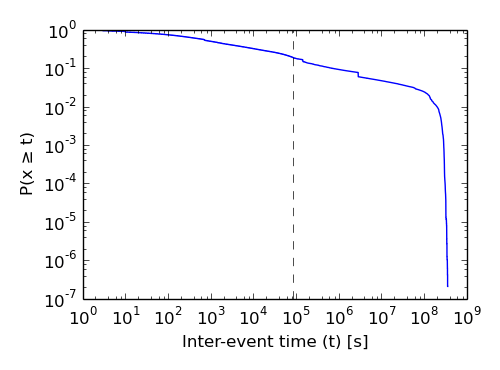
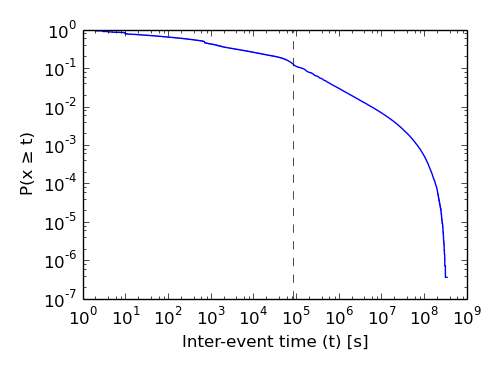
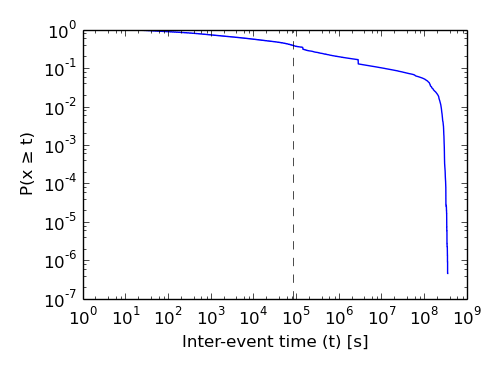
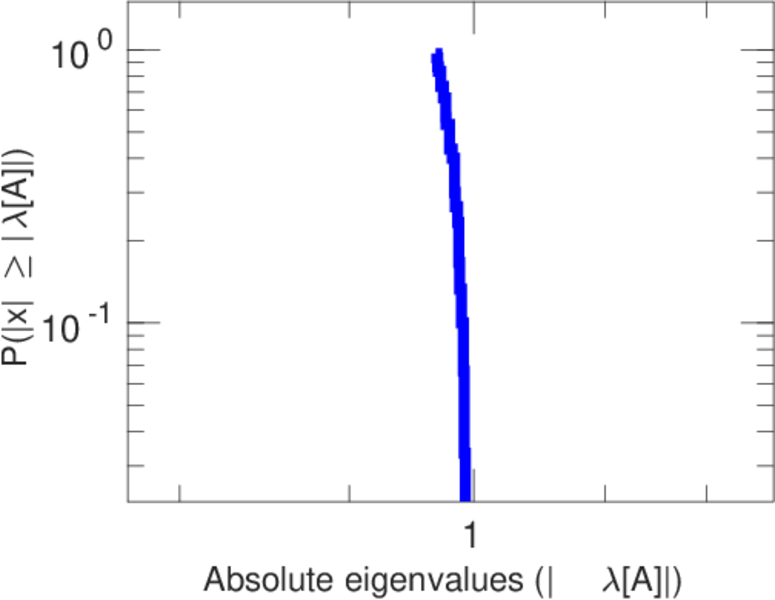
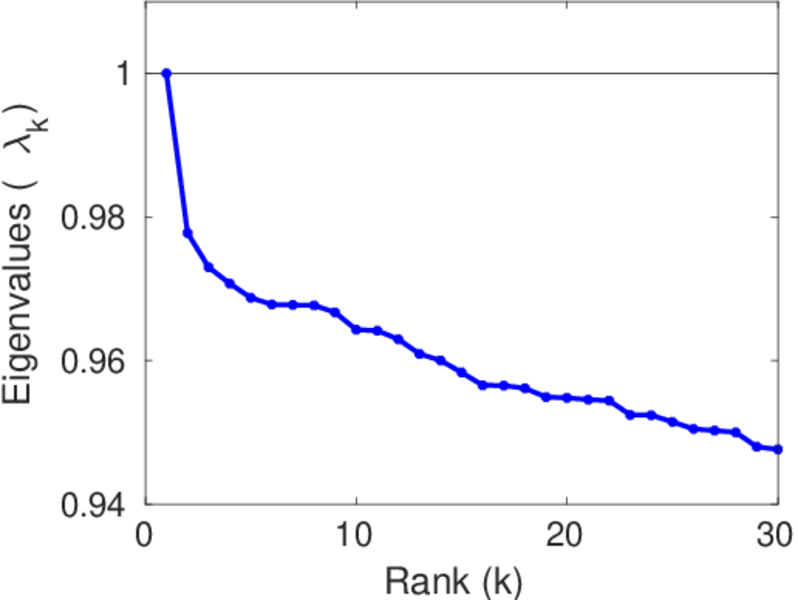
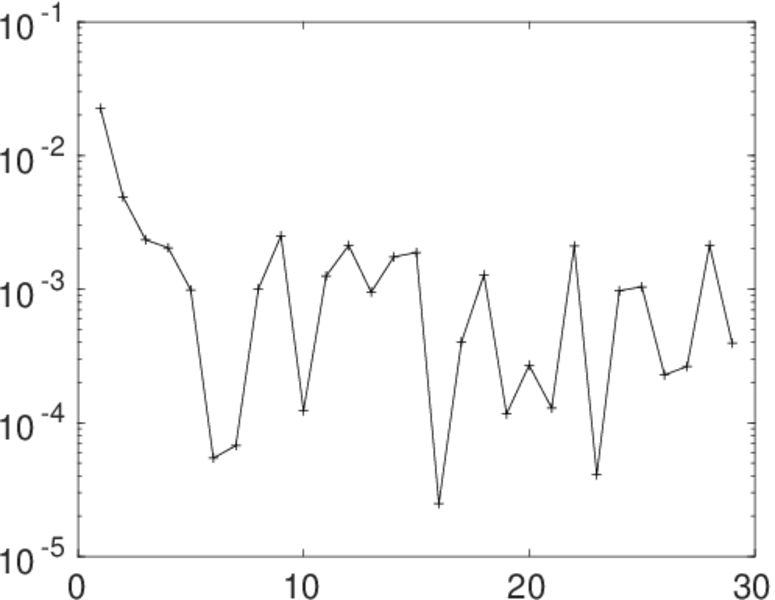
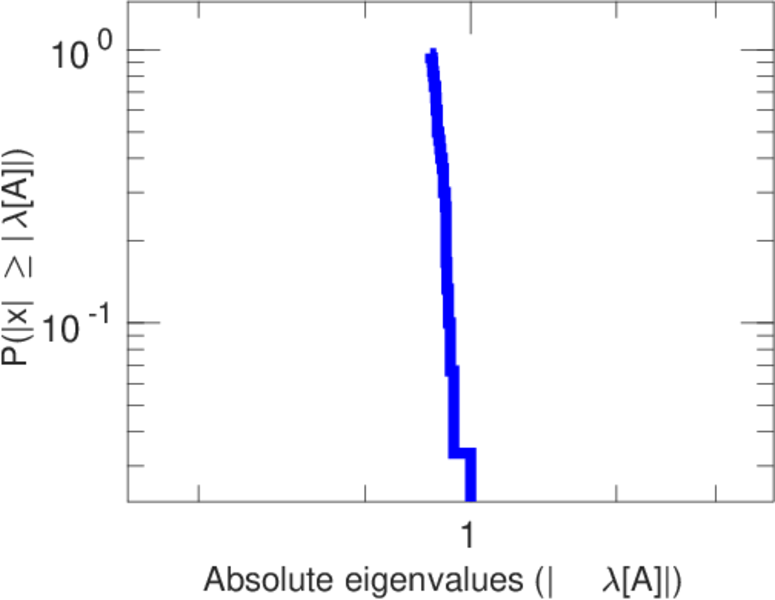
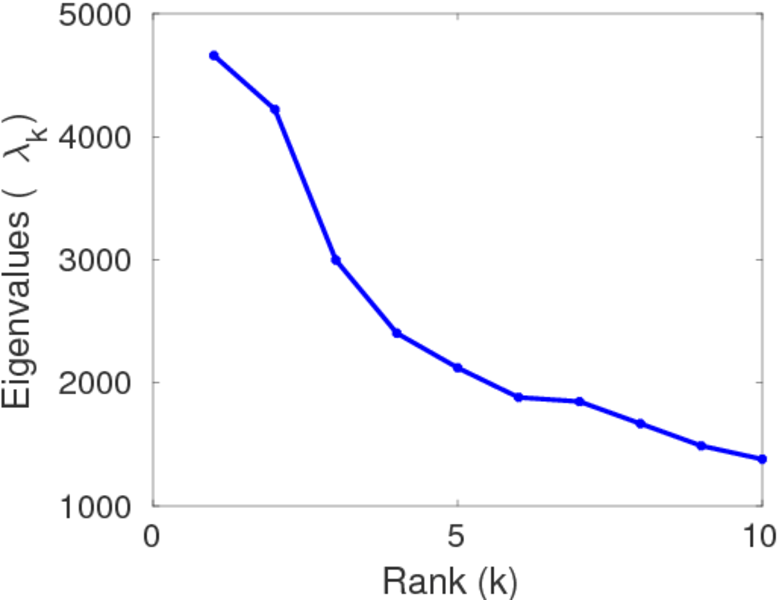
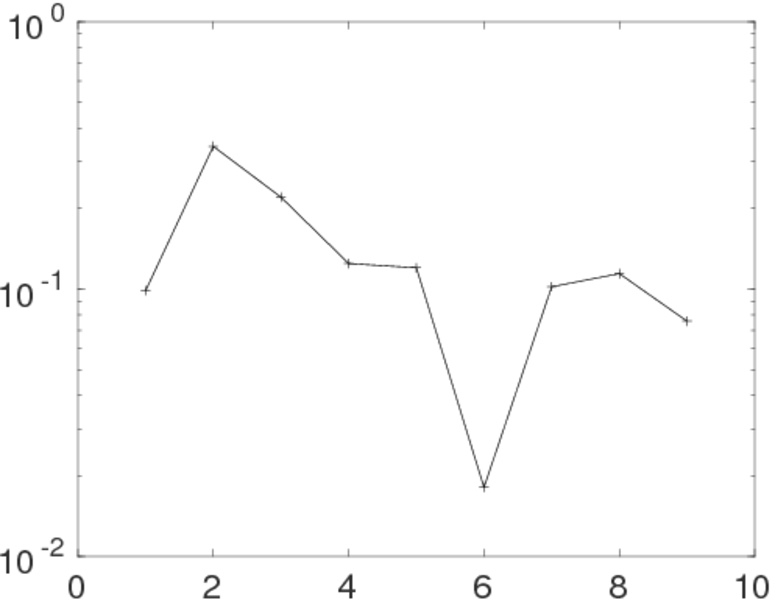
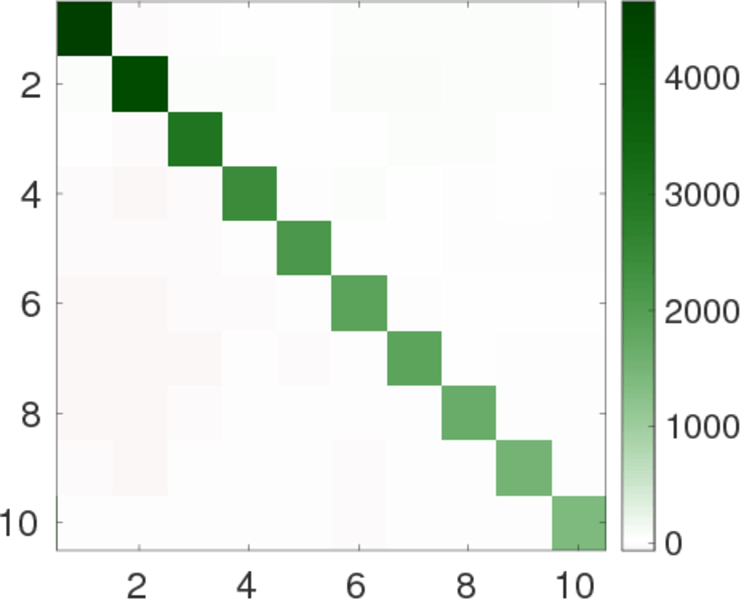
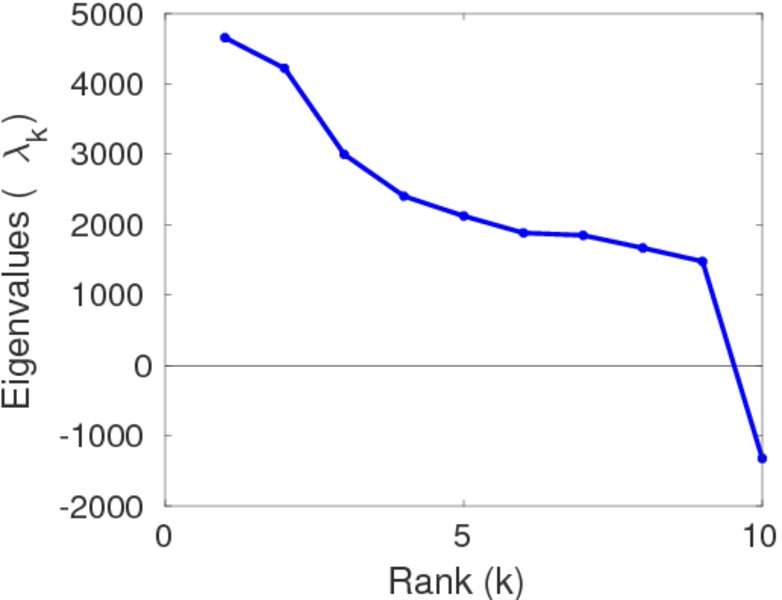
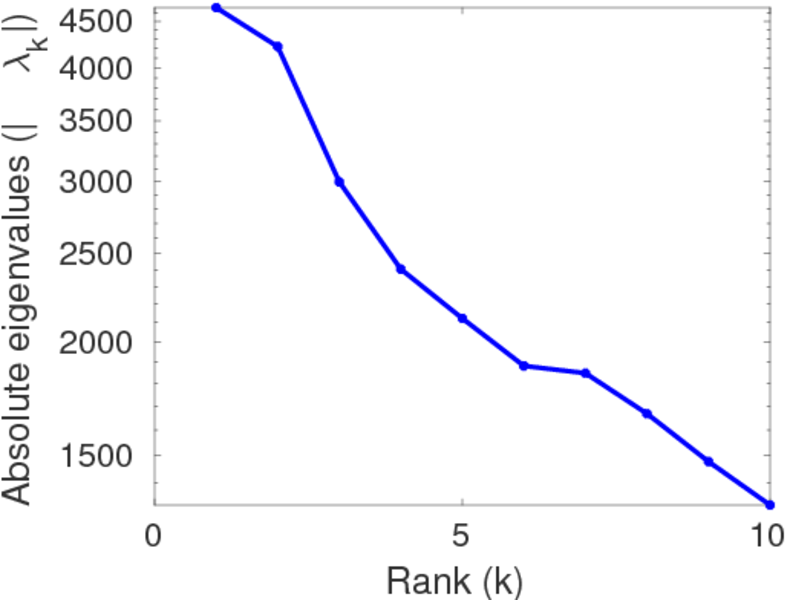
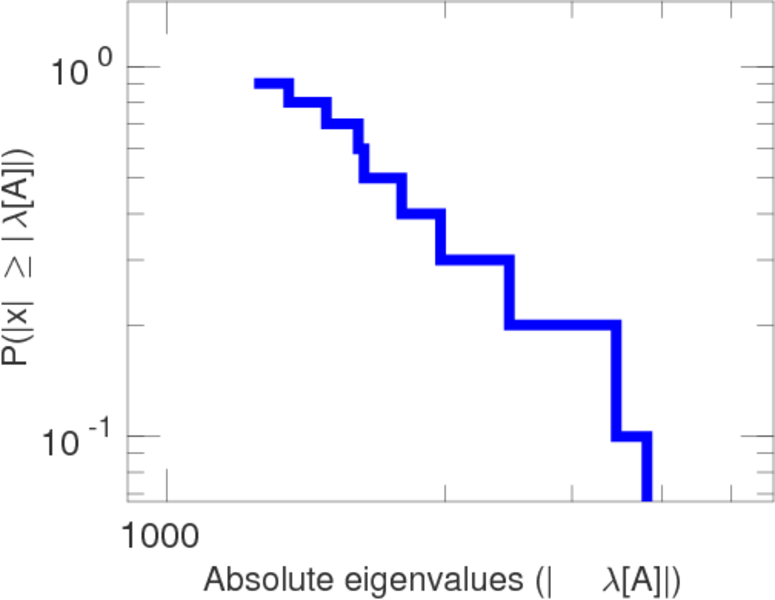
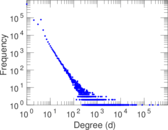
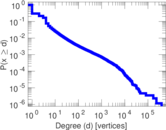
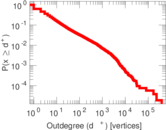
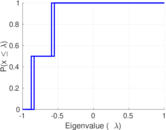
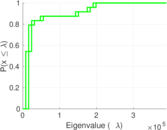
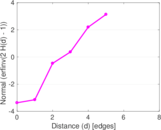
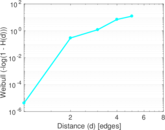
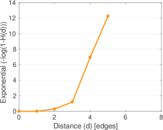
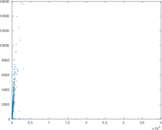
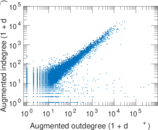
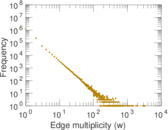
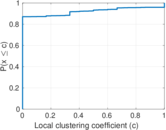
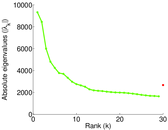
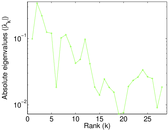
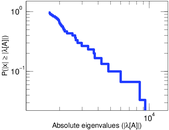
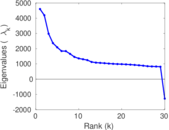
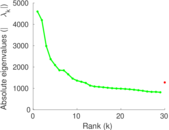
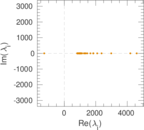
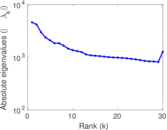
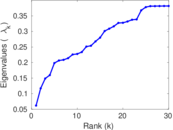
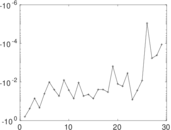
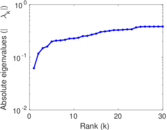
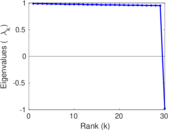
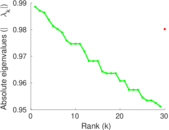
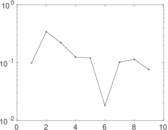
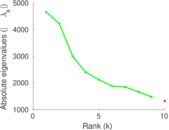
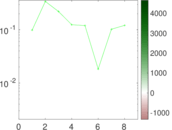
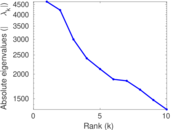
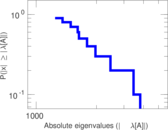
Plots


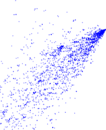
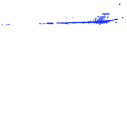


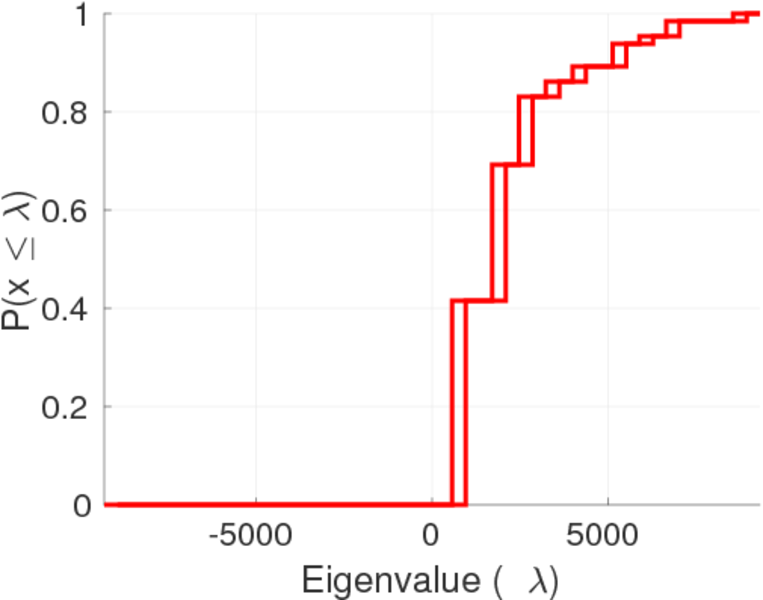
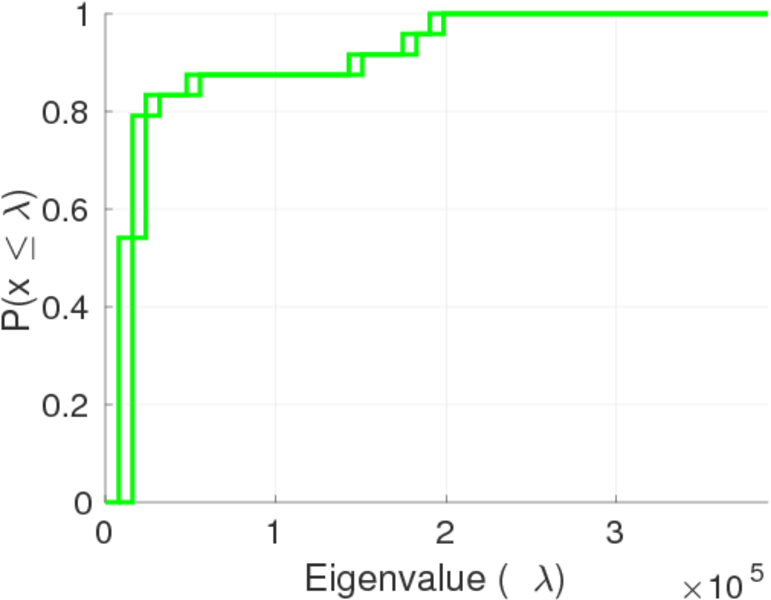
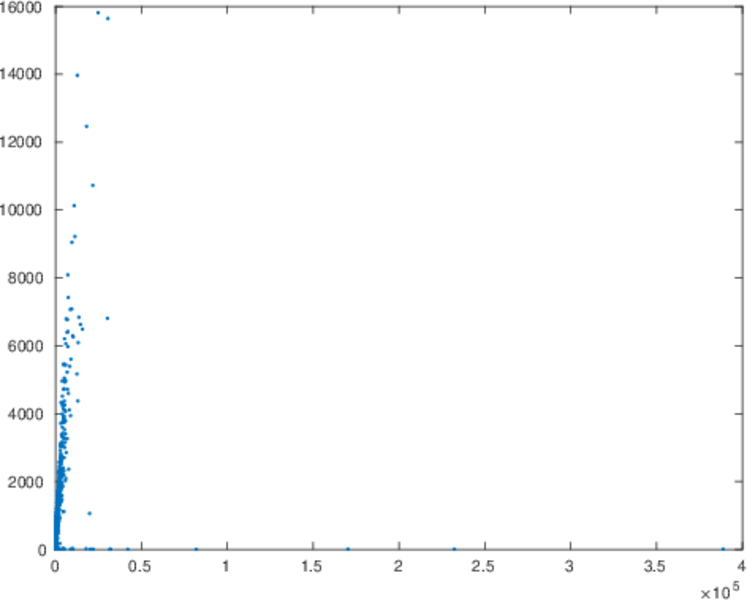
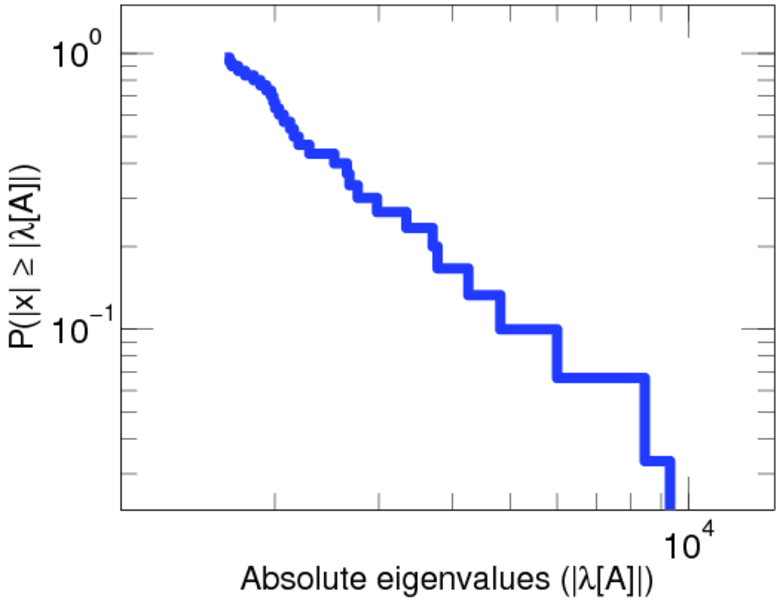
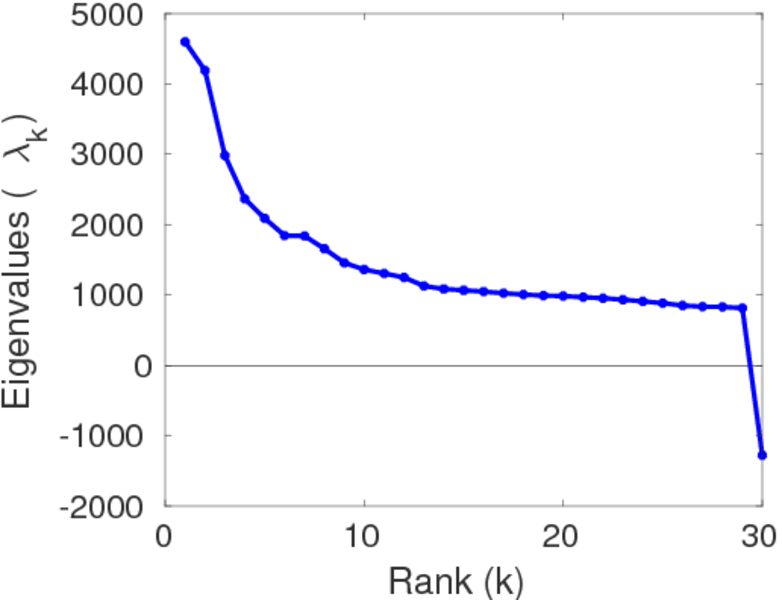
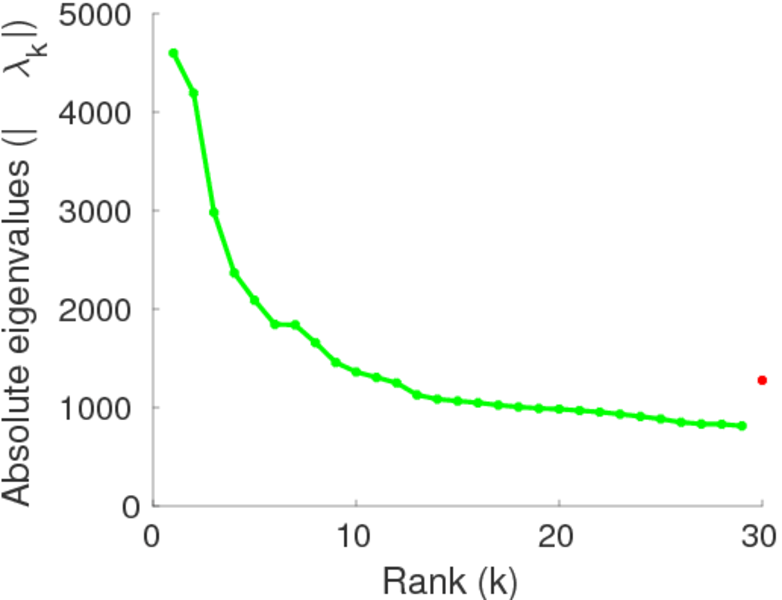
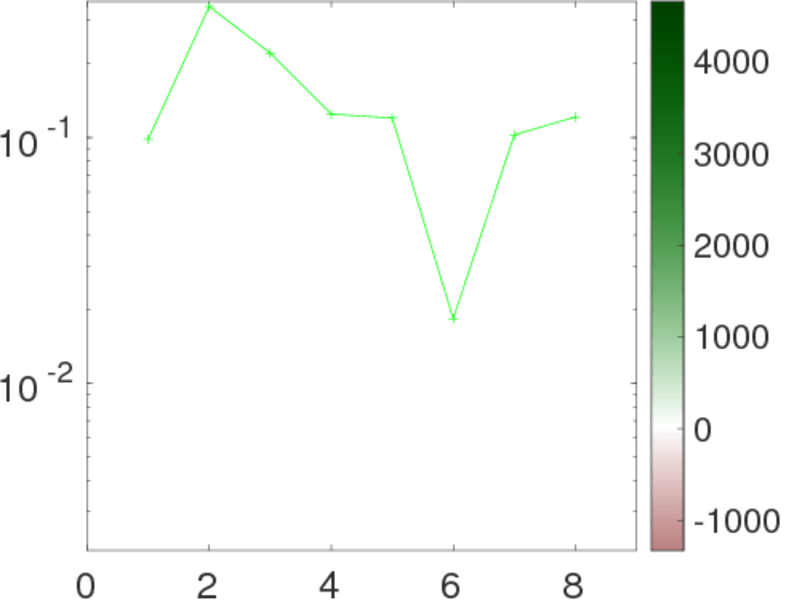
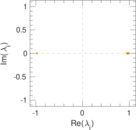
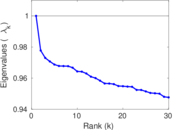
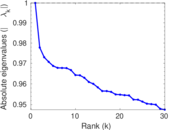
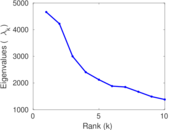
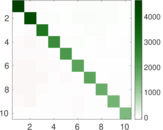
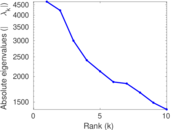
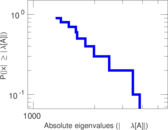
Matrix decompositions plots


Downloads
References
|
[1]
|
Jérôme Kunegis.
KONECT – The Koblenz Network Collection.
In Proc. Int. Conf. on World Wide Web Companion, pages
1343–1350, 2013.
[ http ]
|
|
[2]
|
Jun Sun, Jérôme Kunegis, and Steffen Staab.
Predicting user roles in social networks using transfer learning with
feature transformation.
In Proc. ICDM Workshop on Data Min. in Netw., 2016.
|
 KONECT ‣ Networks ‣
Buy Me a Coffee
KONECT ‣ Networks ‣
Buy Me a Coffee