Wikipedia talk (nl)
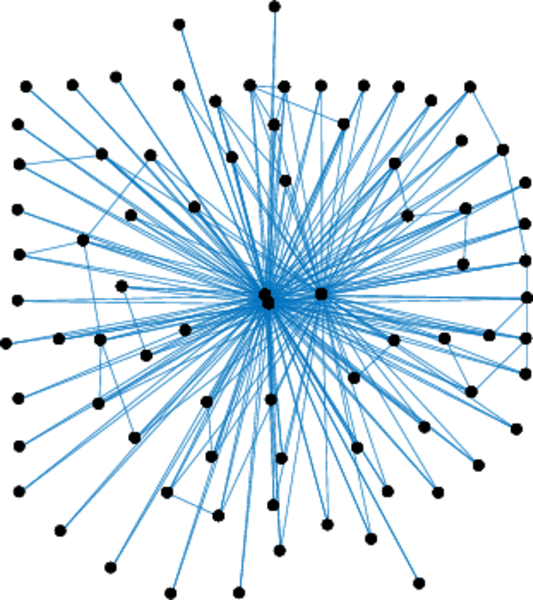
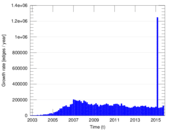
This is the communication network of the Dutch Wikipedia. Nodes represent
users, and an edge from user A to user B denotes that user A wrote a message on
the talk page of user B at a certain timestamp.
Metadata
Statistics
| Size | n = | 225,749
|
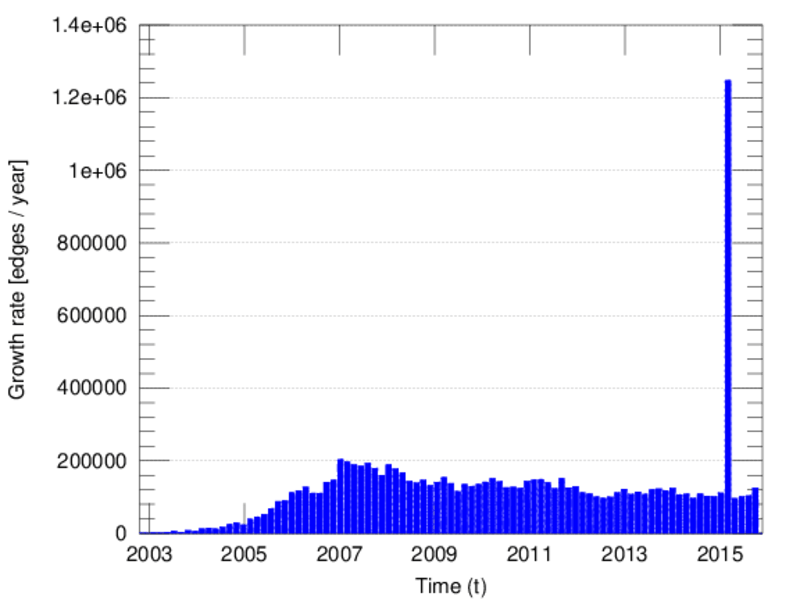
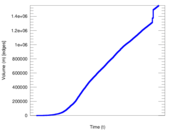
| Volume | m = | 1,554,699
|
| Unique edge count | m̿ = | 565,477
|
| Loop count | l = | 416,428
|
| Wedge count | s = | 6,058,956,301
|
| Claw count | z = | 108,915,376,971,202
|
| Triangle count | t = | 1,873,710
|
| Square count | q = | 1,925,439,105
|
| 4-Tour count | T4 = | 39,640,359,028
|
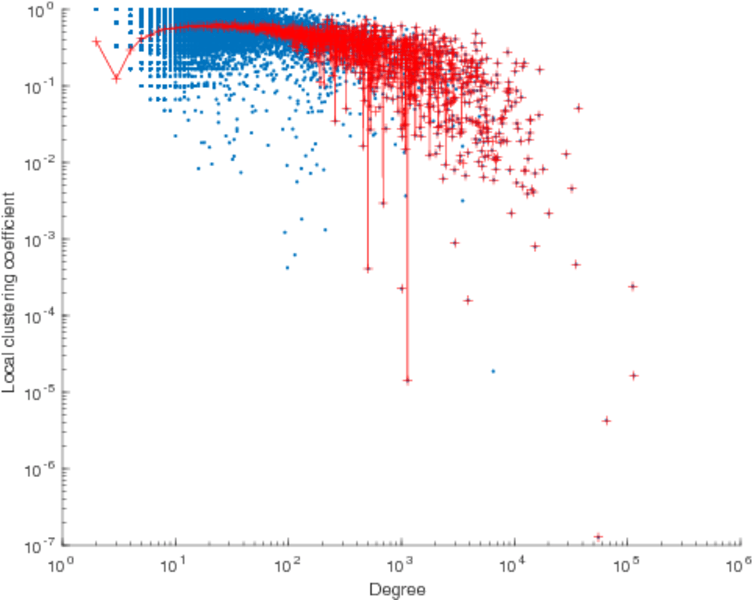
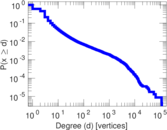
| Maximum degree | dmax = | 113,872
|
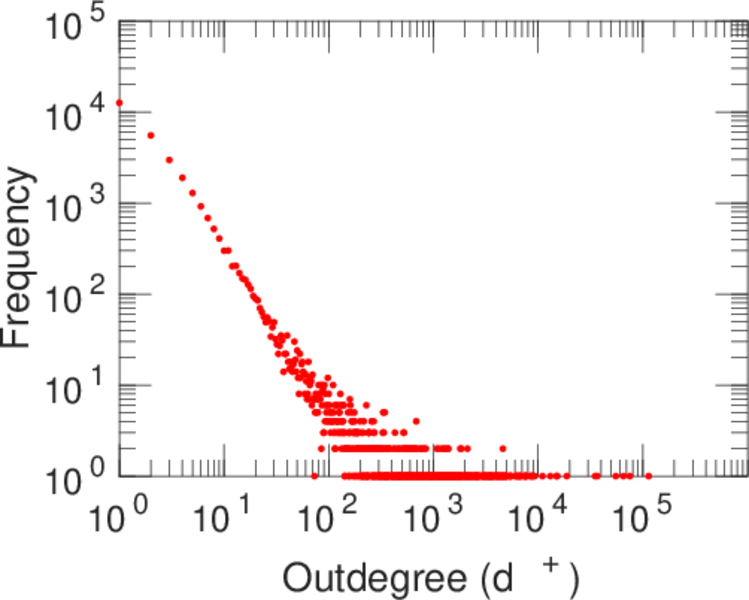
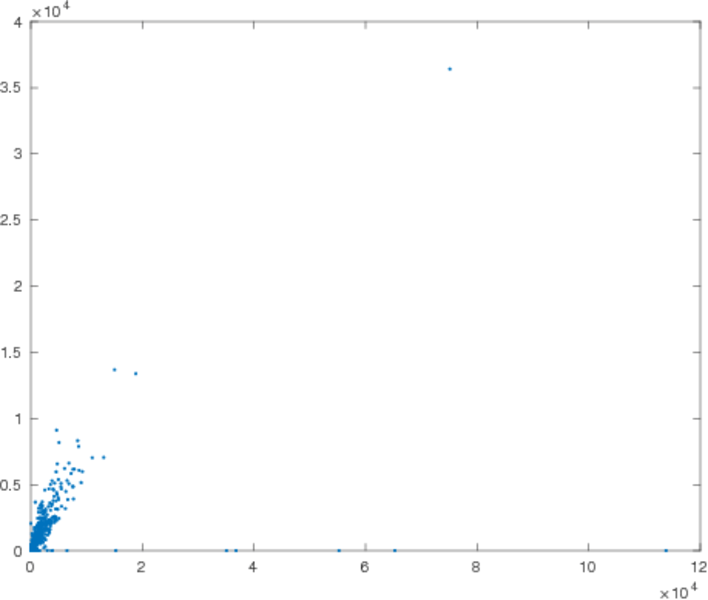
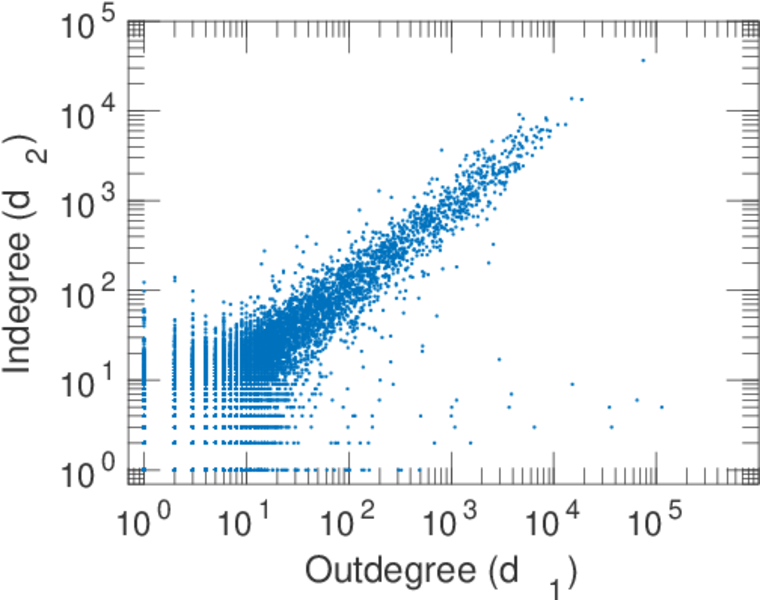
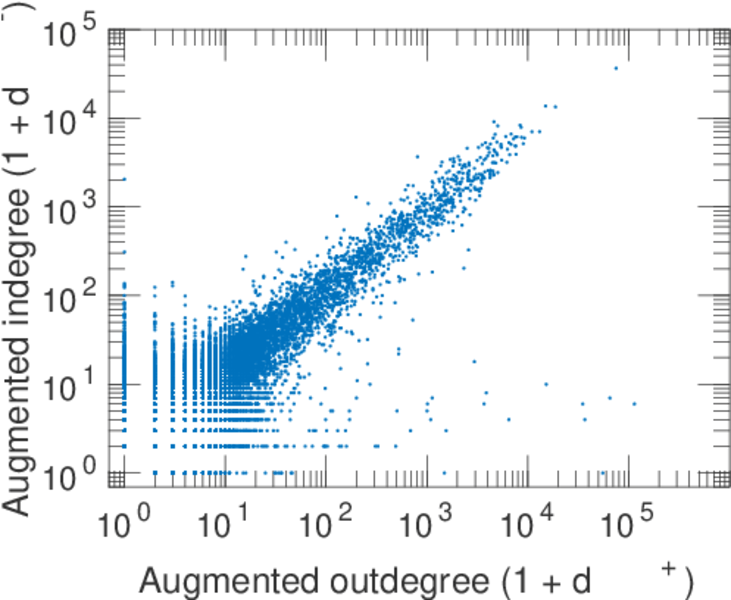
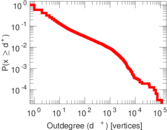
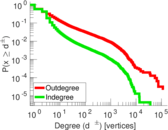
| Maximum outdegree | d+max = | 113,867
|
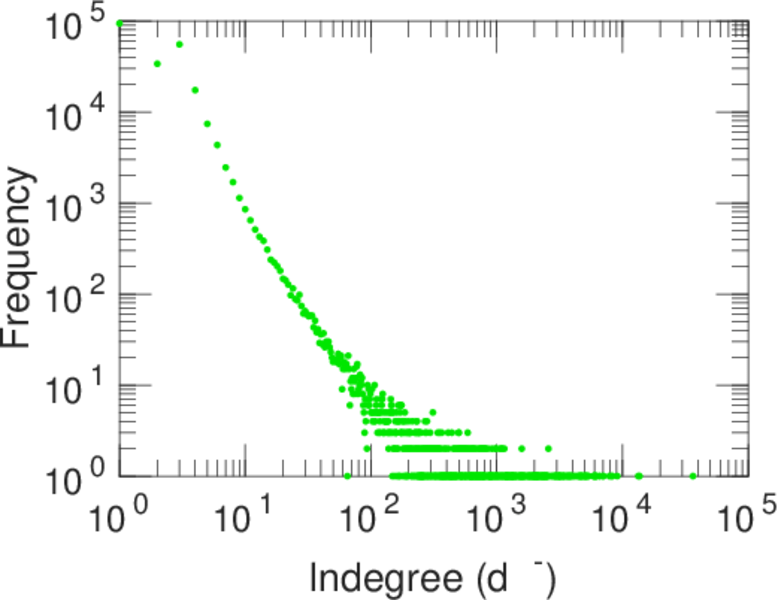
| Maximum indegree | d−max = | 36,413
|
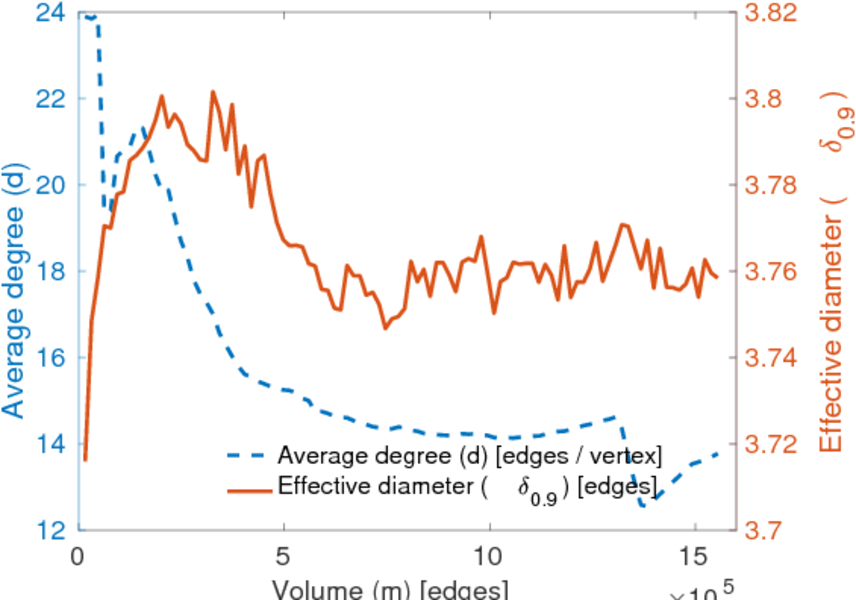
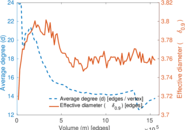
| Average degree | d = | 13.773 7
|
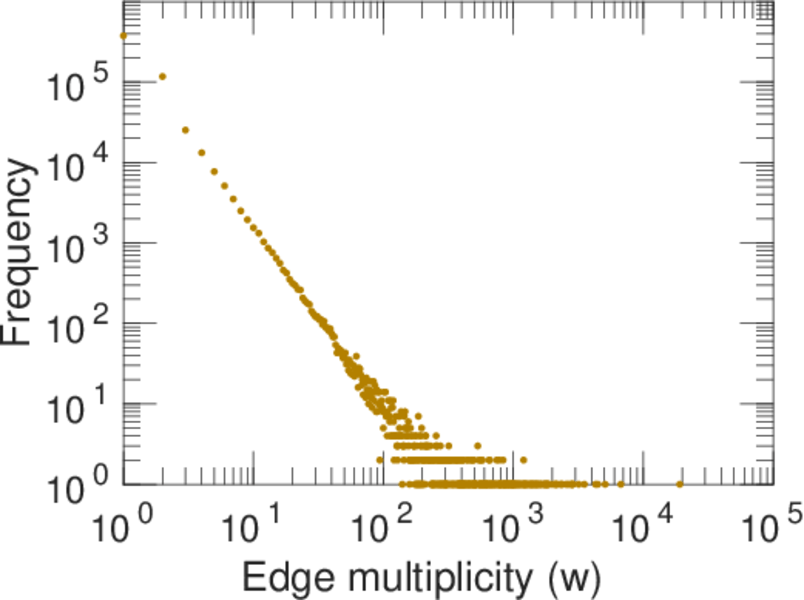
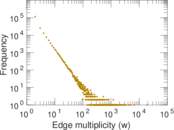
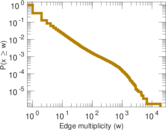
| Average edge multiplicity | m̃ = | 2.749 36
|
| Size of LCC | N = | 224,185
|
| Size of LSCC | Ns = | 18,598
|
| Relative size of LSCC | Nrs = | 0.082 383 5
|
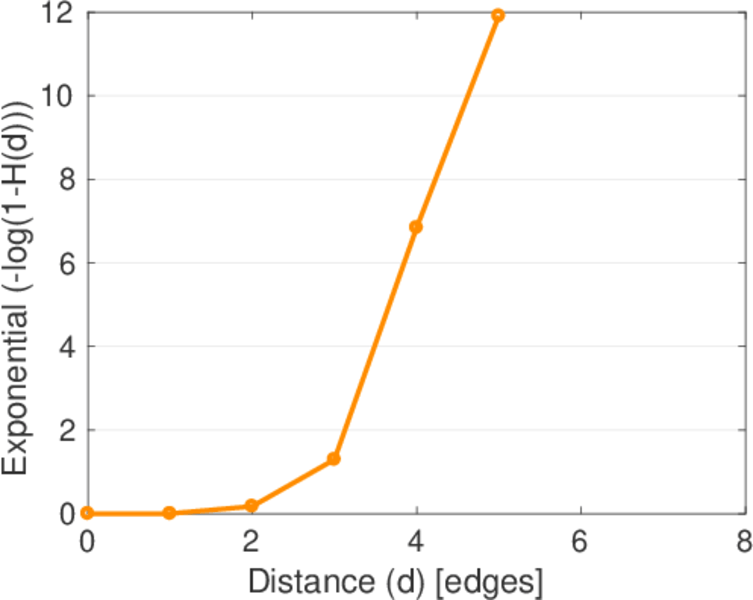
| Diameter | δ = | 7
|
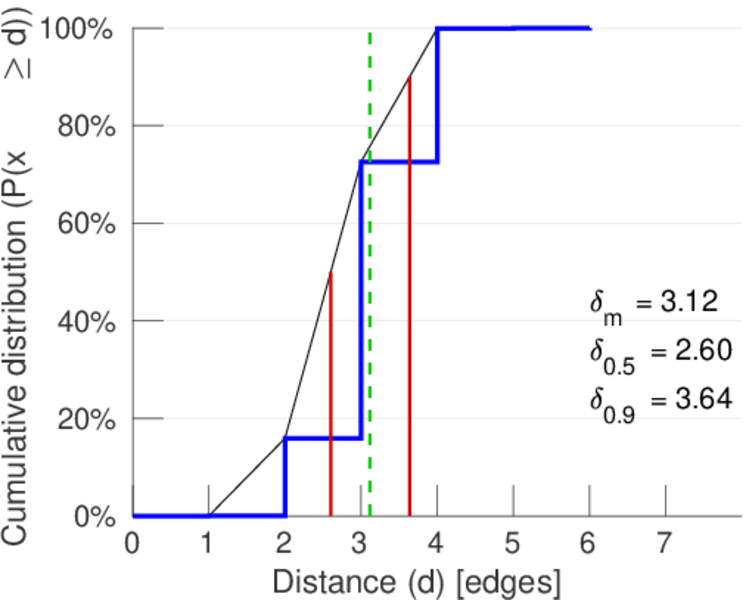
| 50-Percentile effective diameter | δ0.5 = | 2.601 71
|
| 90-Percentile effective diameter | δ0.9 = | 3.637 83
|
| Median distance | δM = | 3
|
| Mean distance | δm = | 3.116 36
|
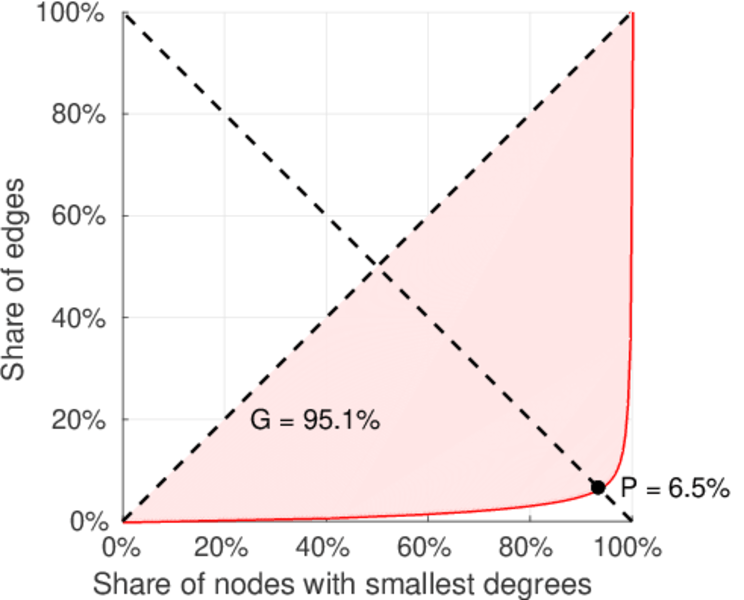
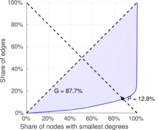
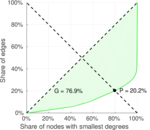
| Gini coefficient | G = | 0.876 668
|
| Balanced inequality ratio | P = | 0.127 784
|
| Outdegree balanced inequality ratio | P+ = | 0.064 844 7
|
| Indegree balanced inequality ratio | P− = | 0.202 136
|
| Relative edge distribution entropy | Her = | 0.721 712
|
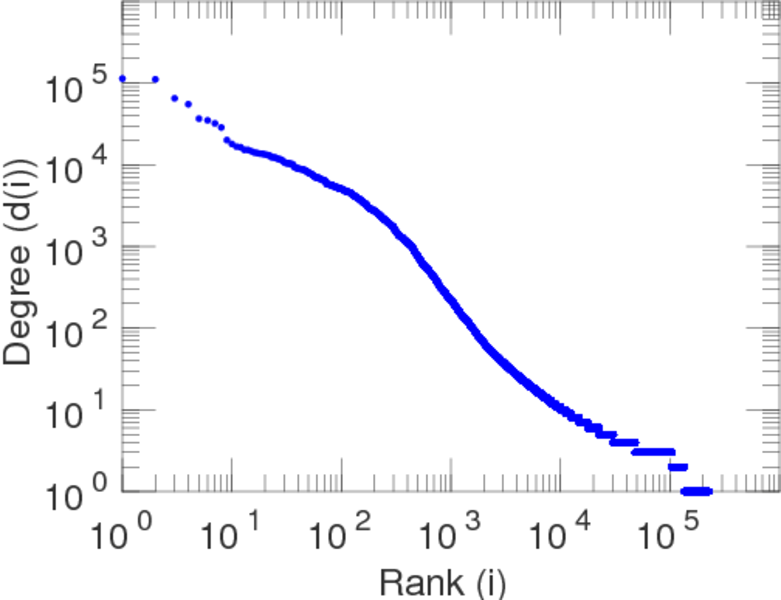
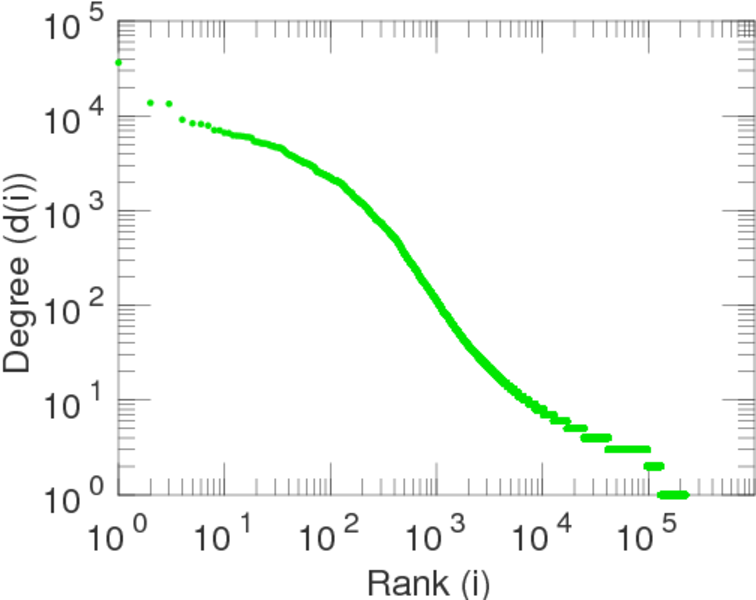
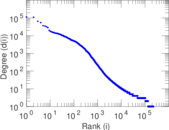
| Power law exponent | γ = | 2.821 60
|
| Tail power law exponent | γt = | 2.961 00
|
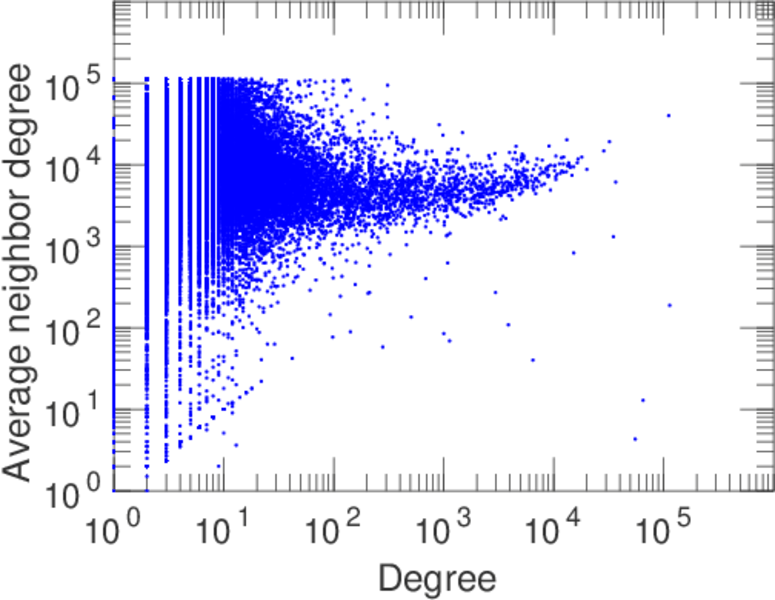
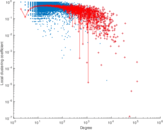
| Degree assortativity | ρ = | −0.284 167
|
| Degree assortativity p-value | pρ = | 0.000 00
|
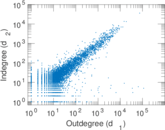
| In/outdegree correlation | ρ± = | +0.680 567
|
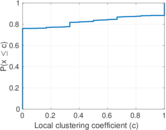
| Clustering coefficient | c = | 0.000 927 739
|
| Directed clustering coefficient | c± = | 0.027 380 8
|
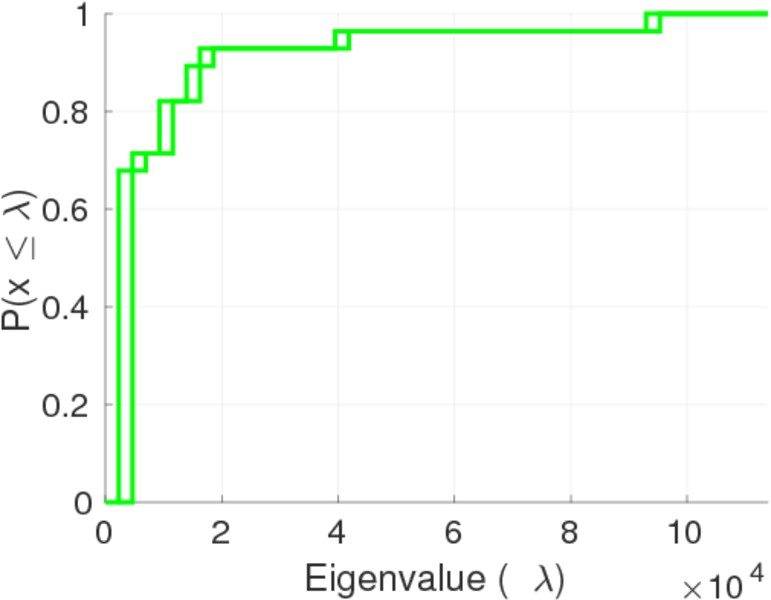
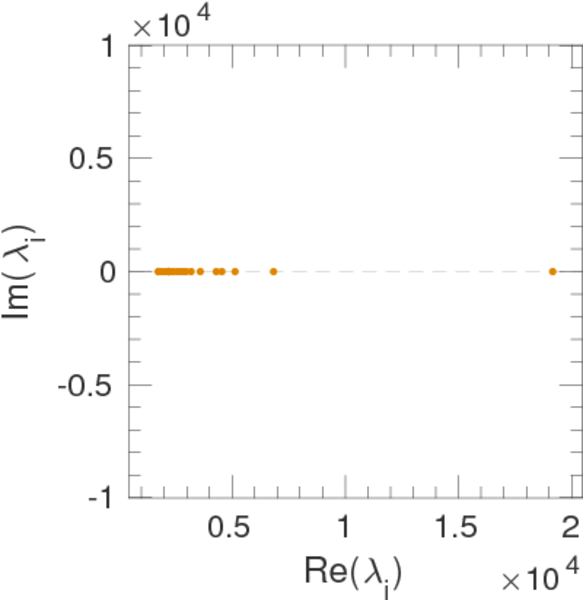
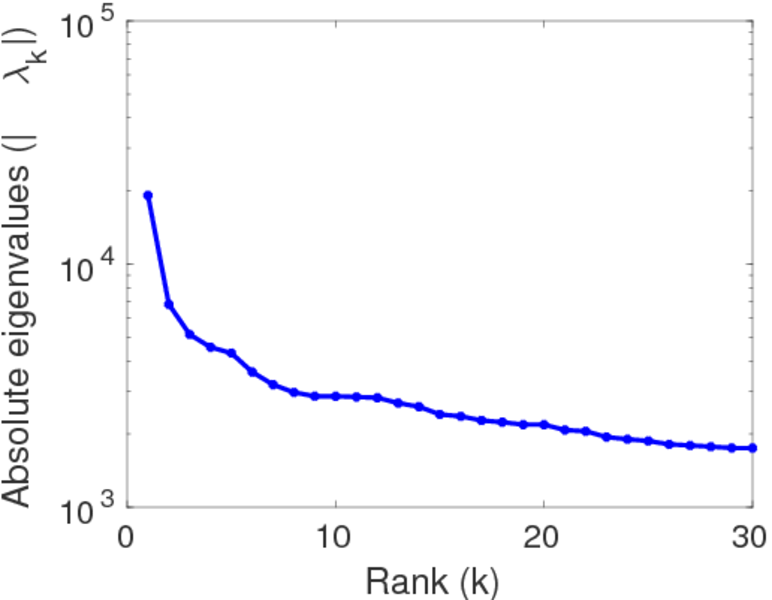
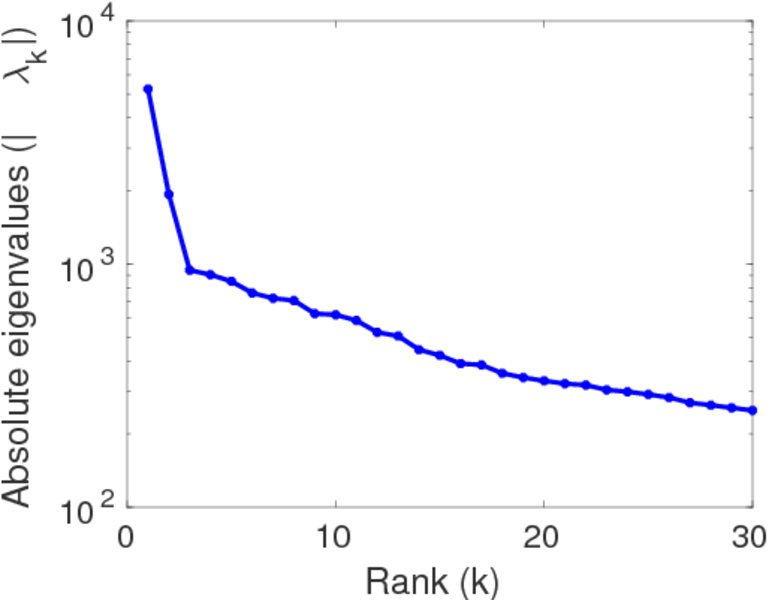
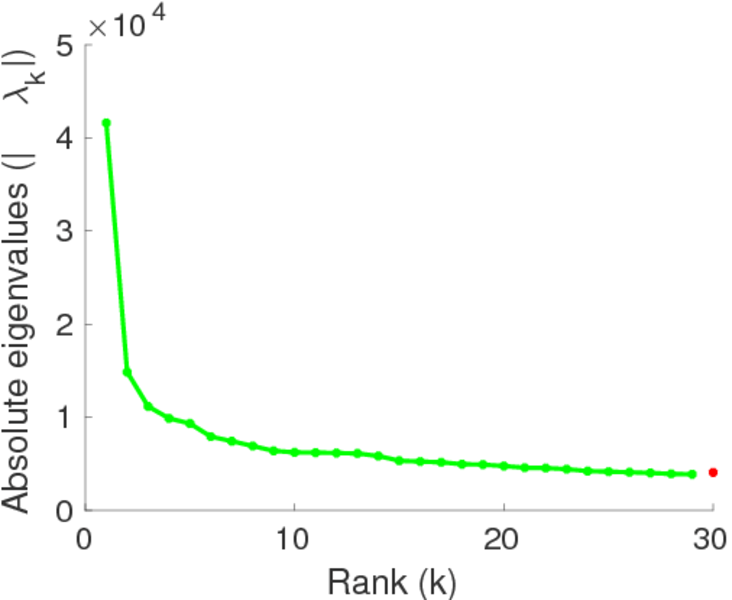
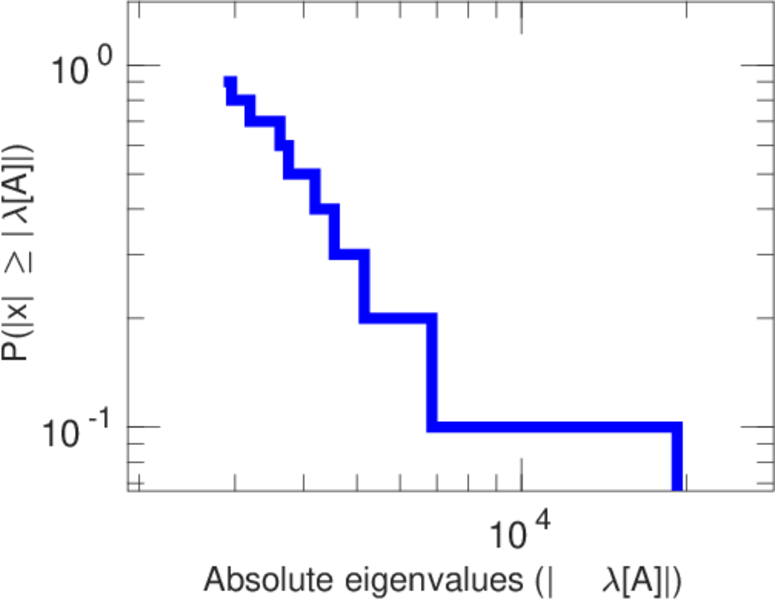
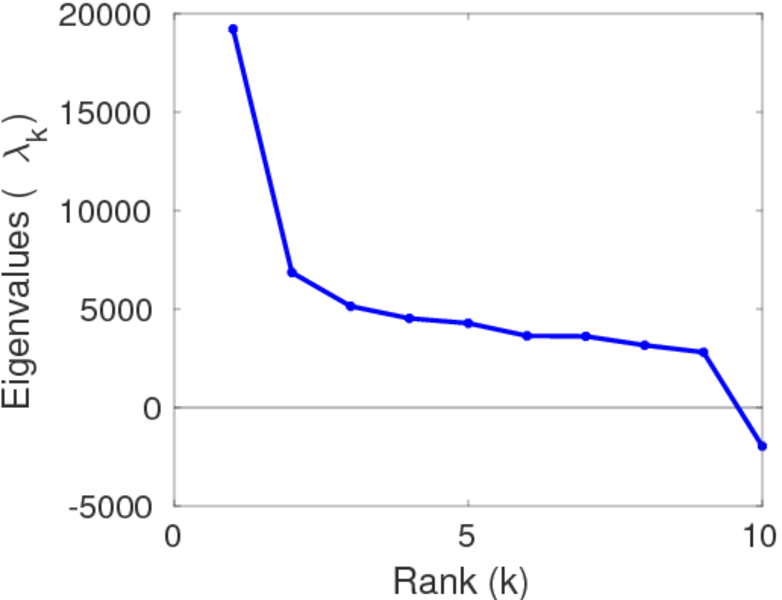
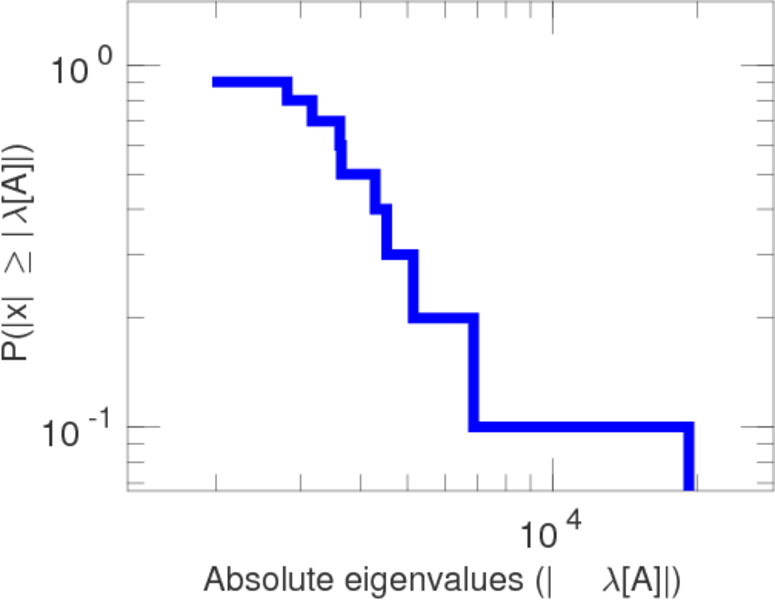
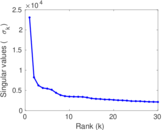
| Operator 2-norm | ν = | 19,257.0
|
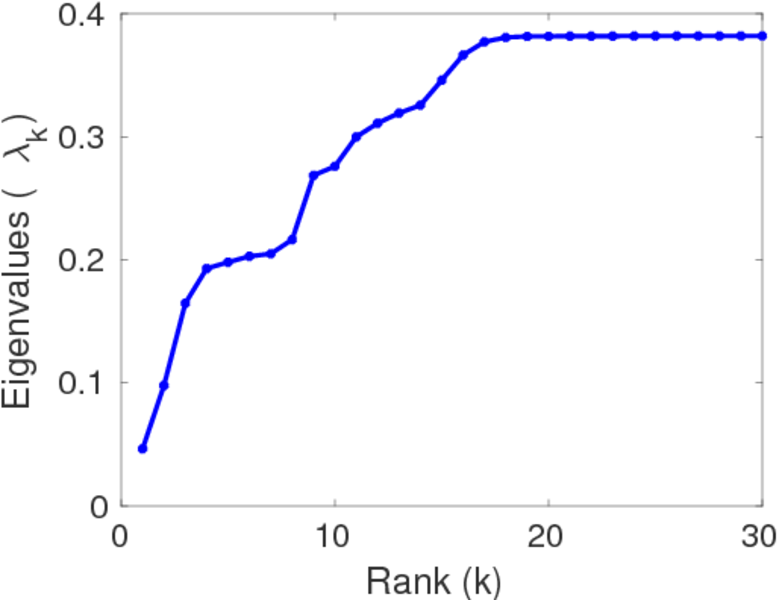
| Algebraic connectivity | a = | 0.046 493 8
|
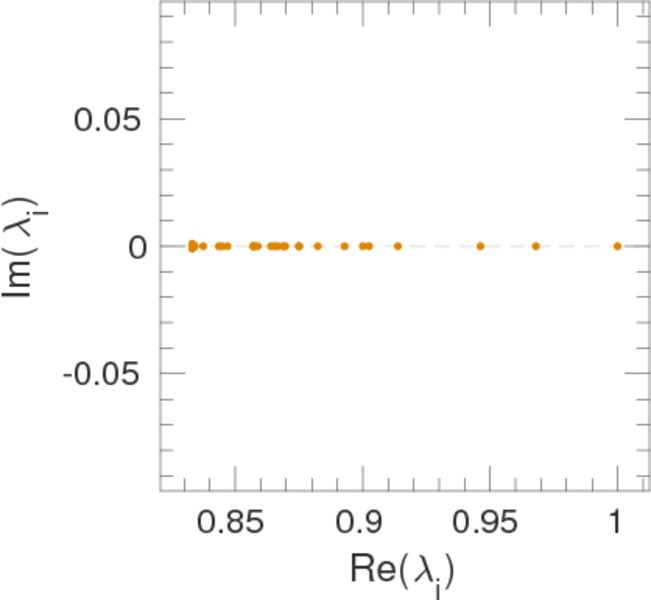
| Spectral separation | |λ1[A] / λ2[A]| = | 2.802 31
|
| Reciprocity | y = | 0.160 926
|
| Normalized non-bipartivity | bN = | 0.020 941 1
|
| Algebraic non-bipartivity | χ = | 0.043 211 4
|
| Spectral bipartite frustration | bK = | 0.002 293 82
|
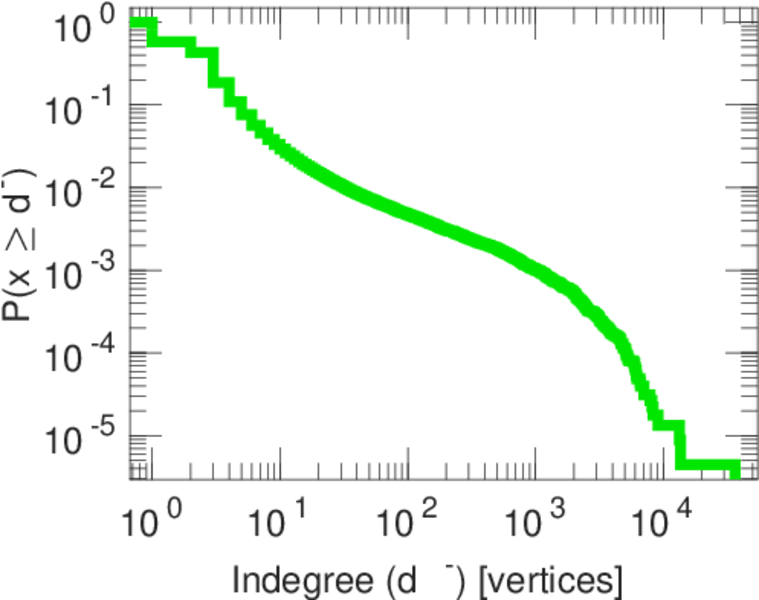
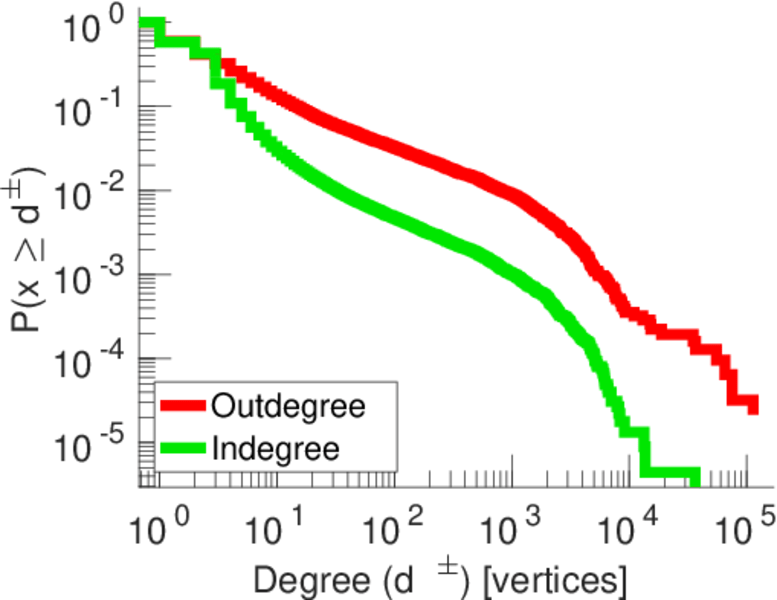
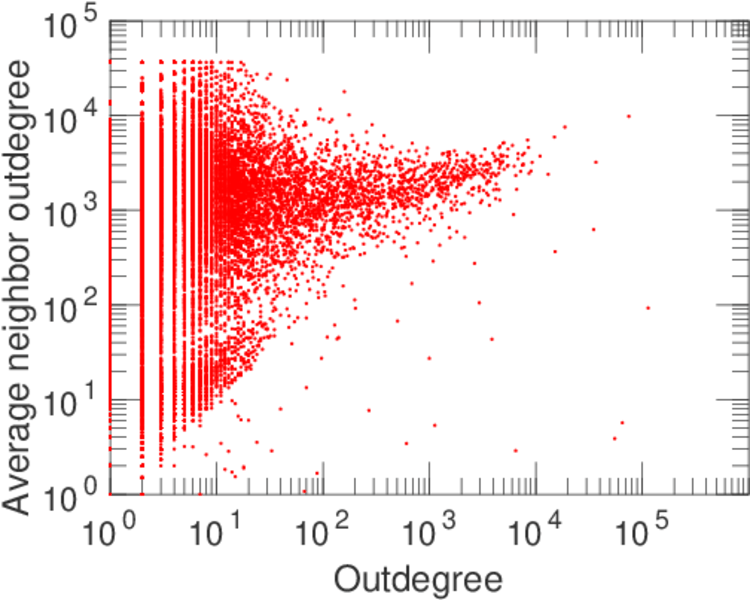
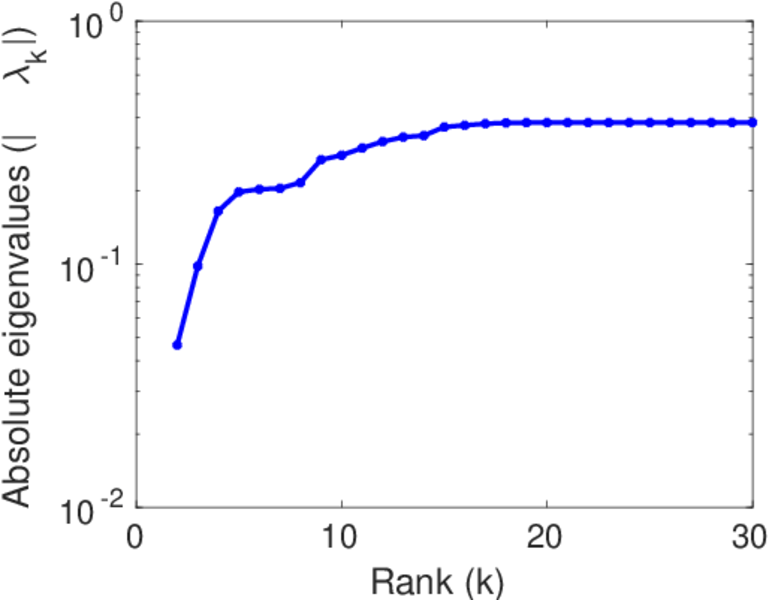
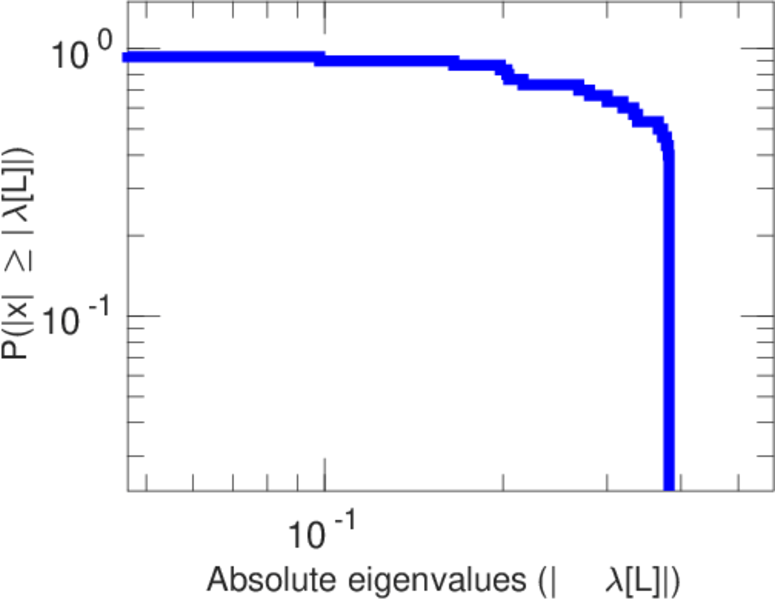
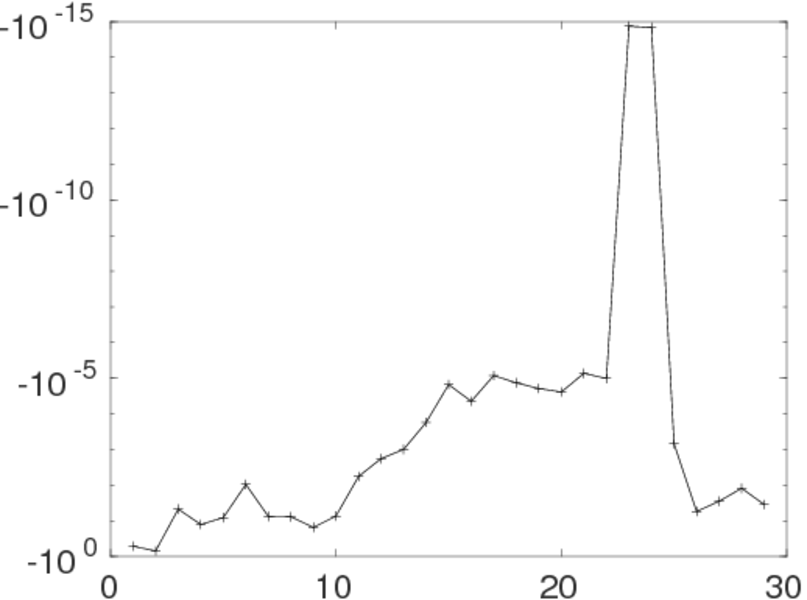
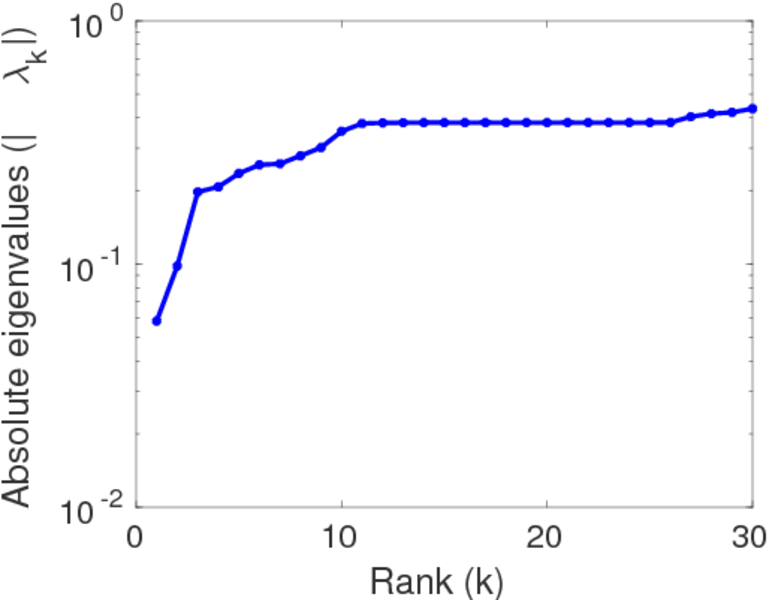
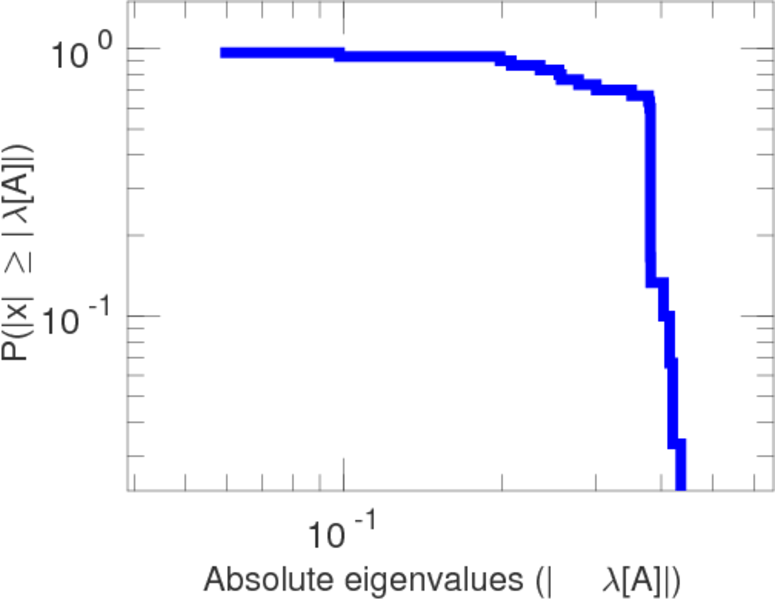
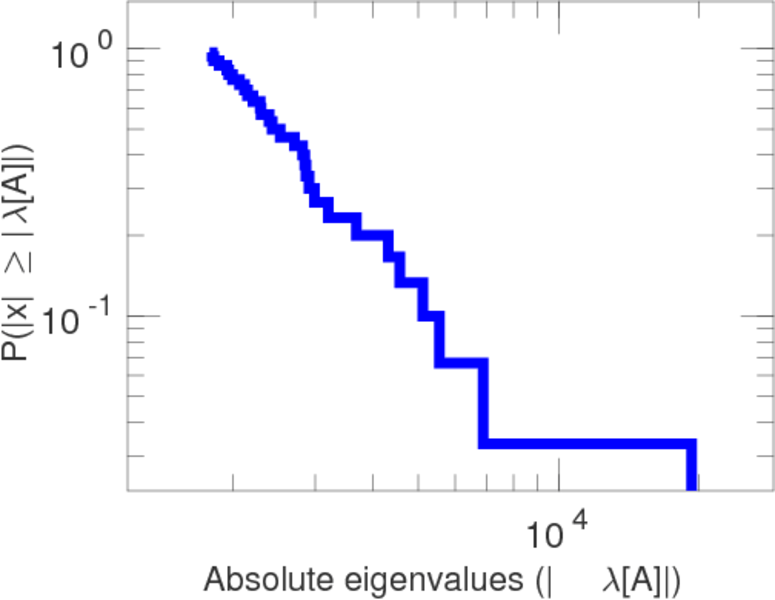
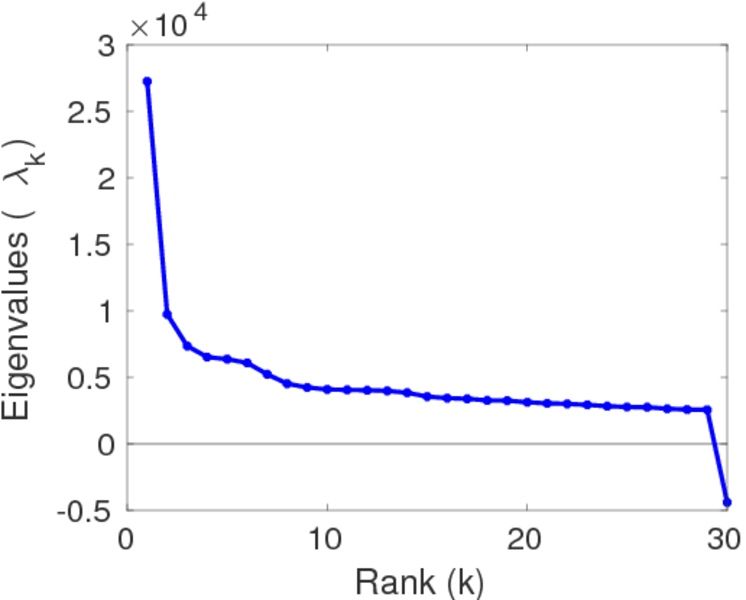
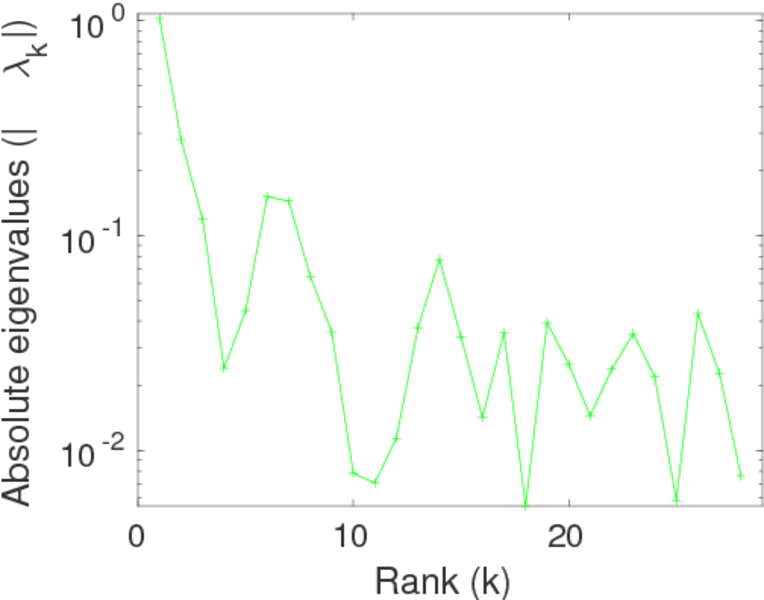
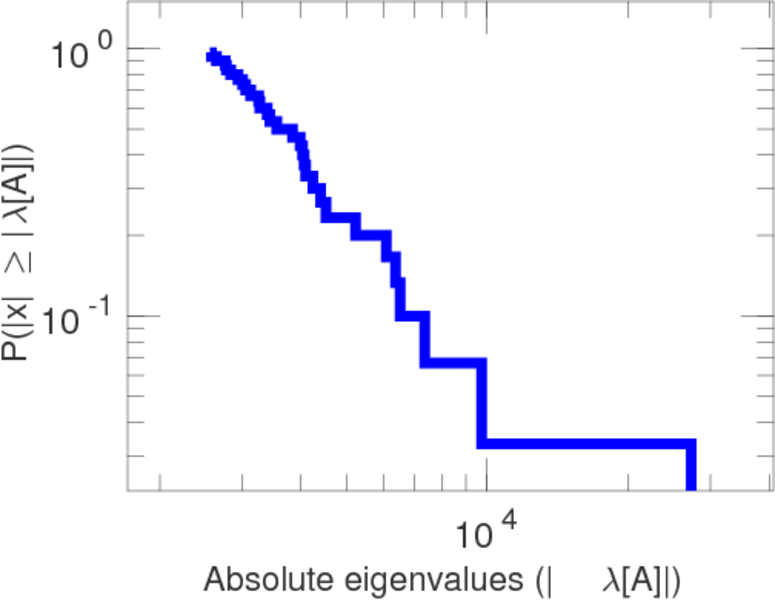
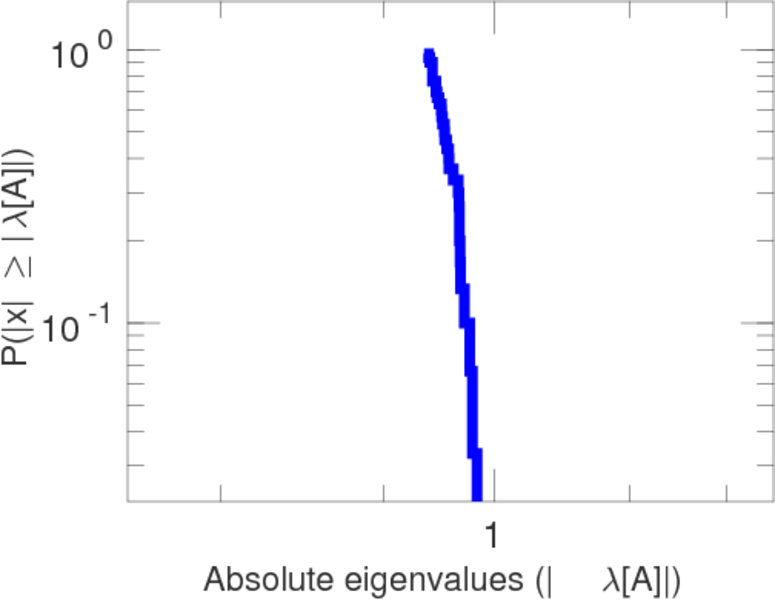
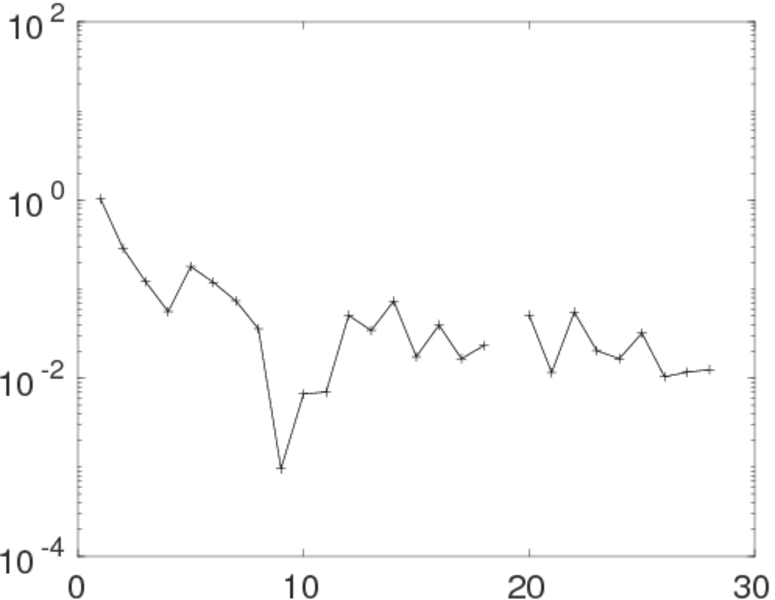
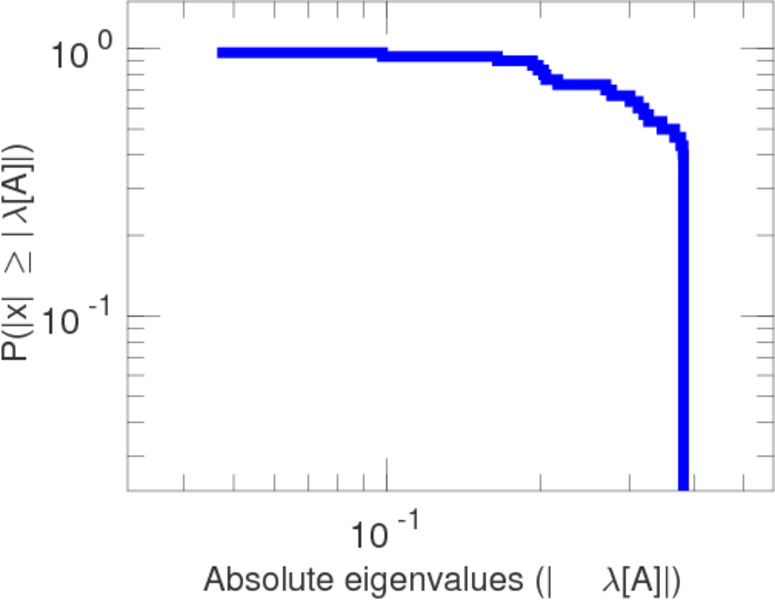
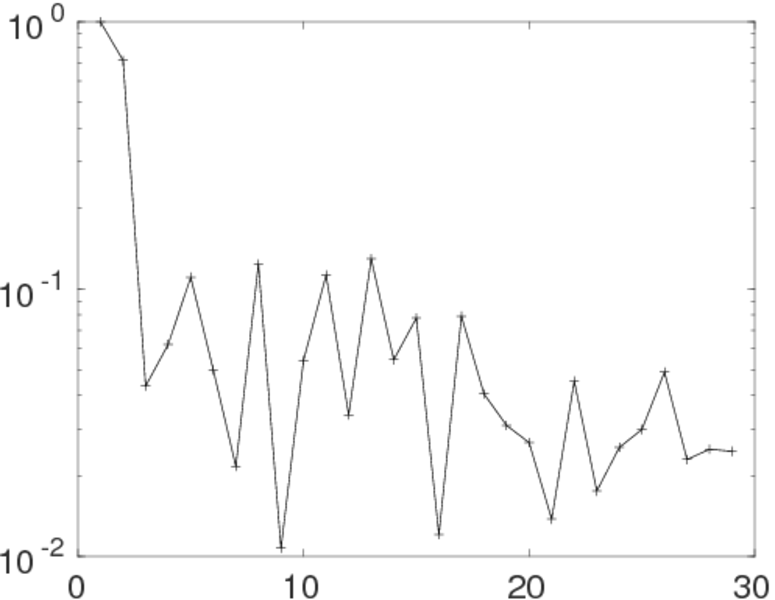
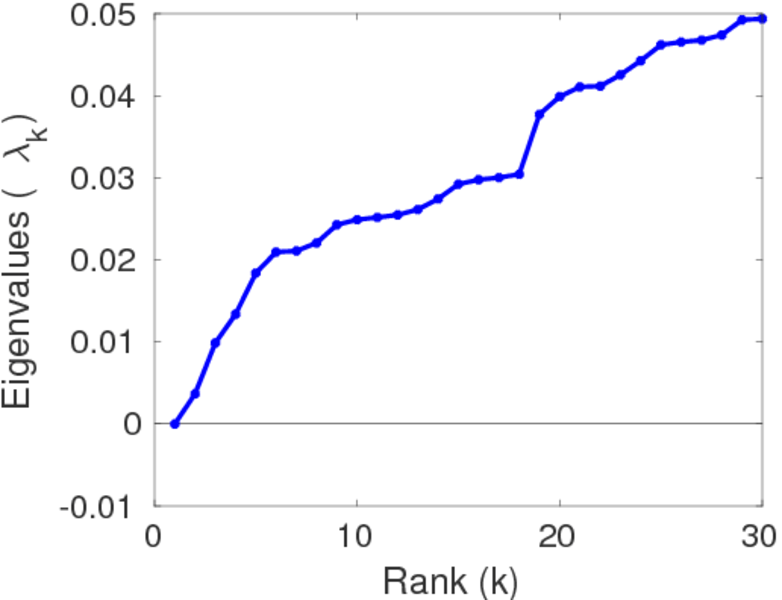
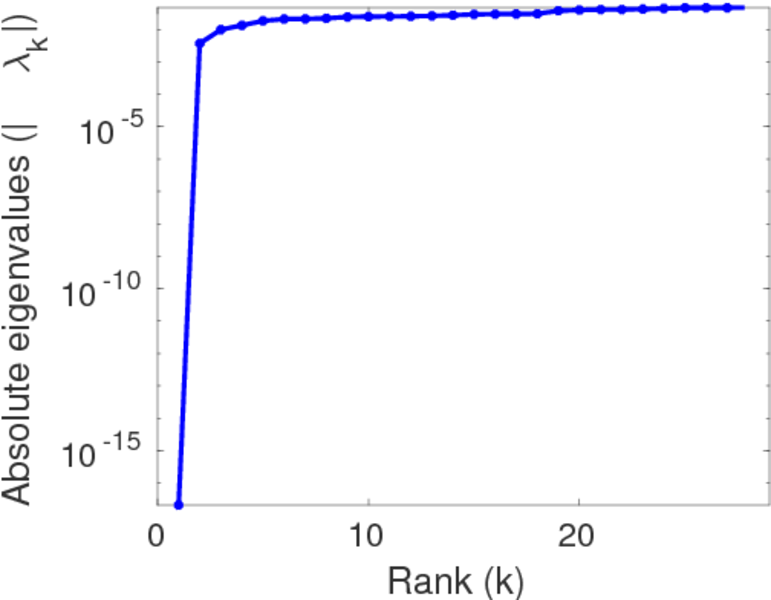
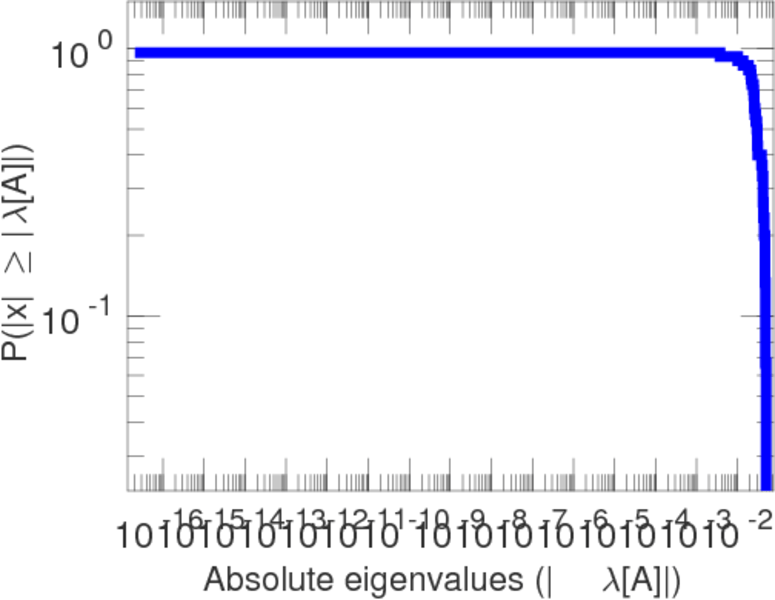
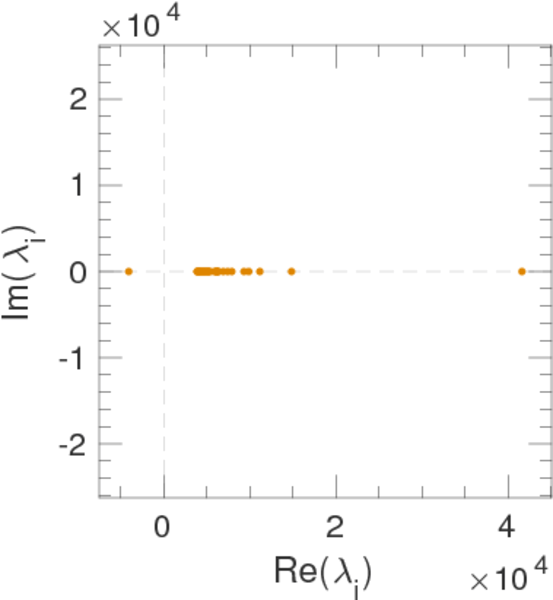
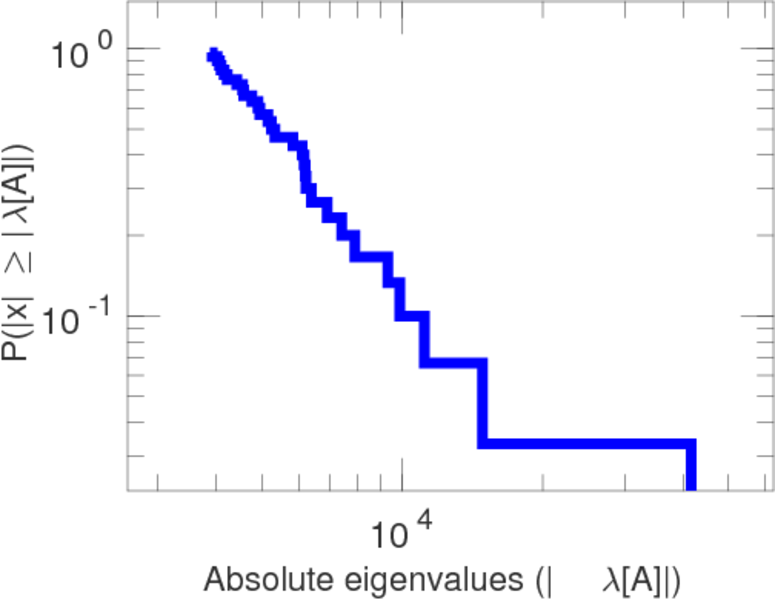
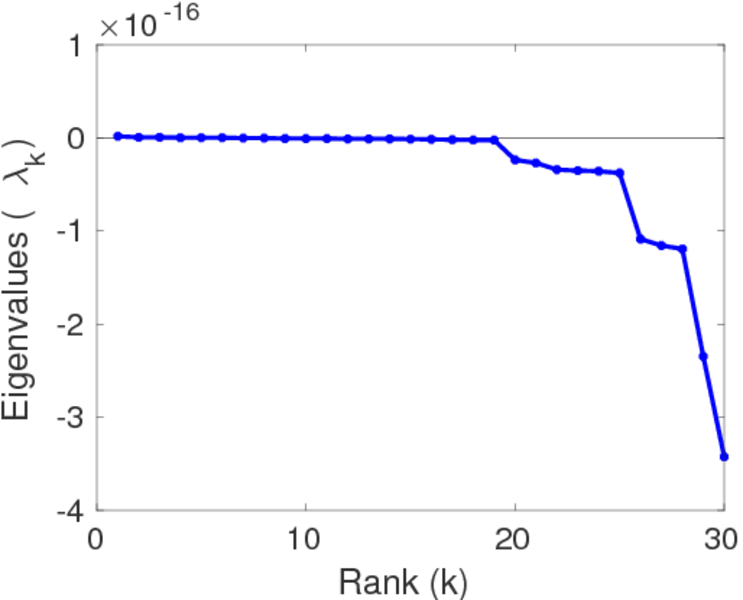
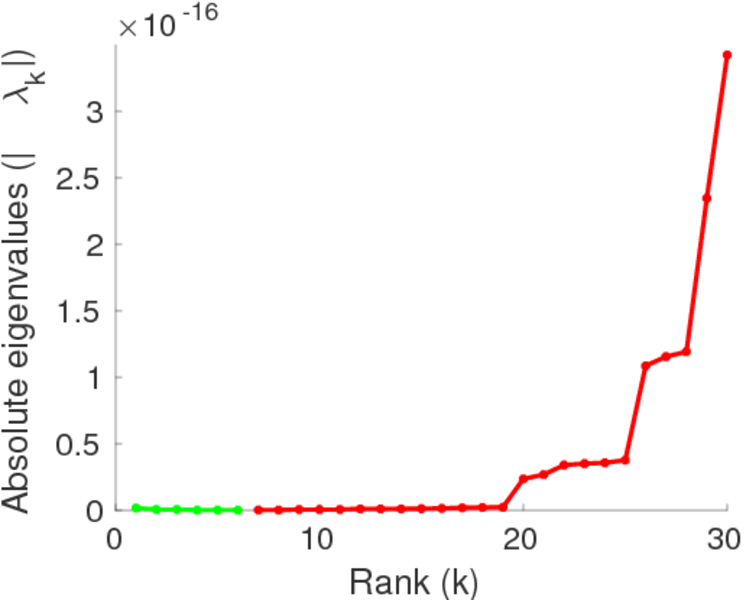
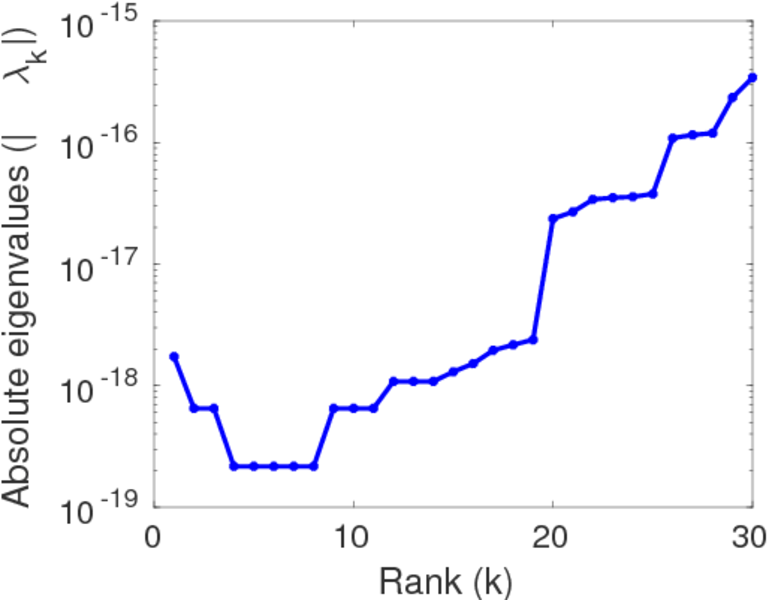
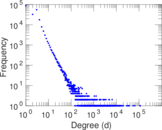
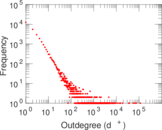
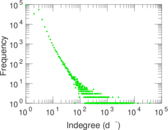
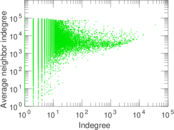
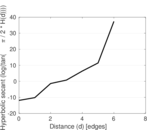
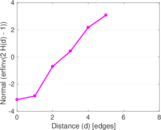
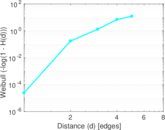
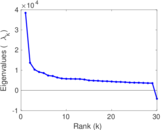
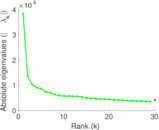
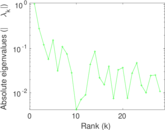
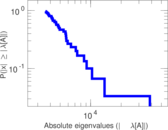
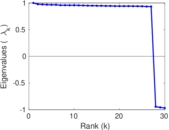
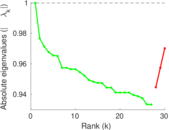
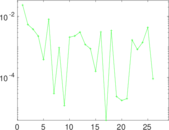
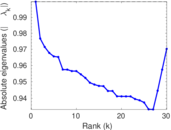
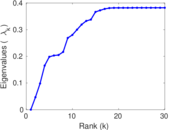
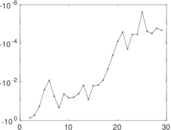
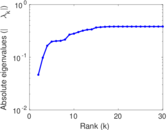
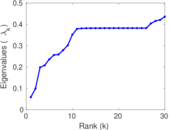
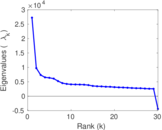
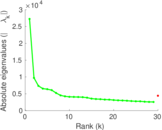
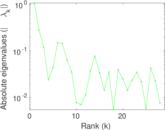
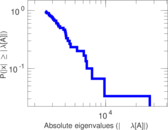
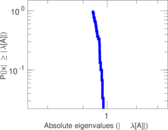
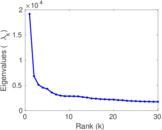
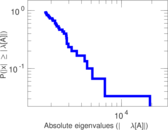
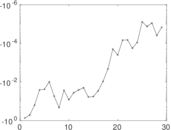
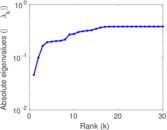
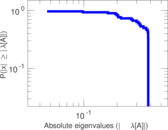
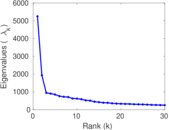
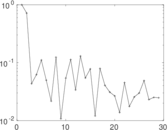
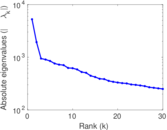
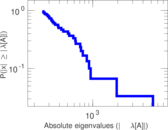
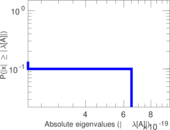
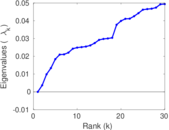
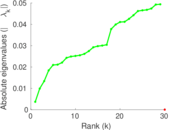
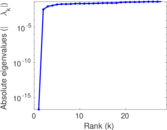
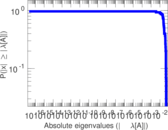
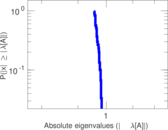
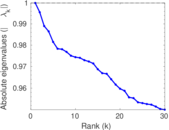
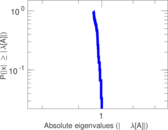
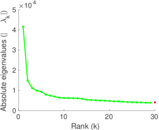
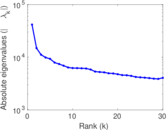
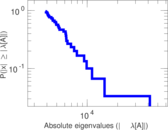
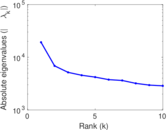
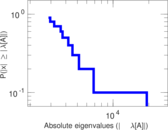
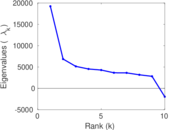
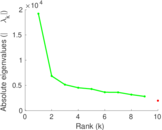
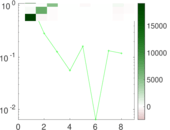
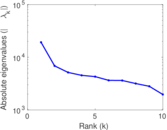
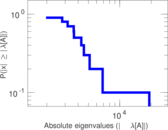
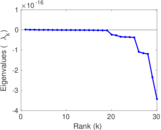
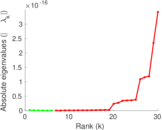
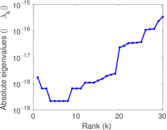
Plots


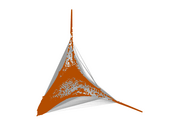


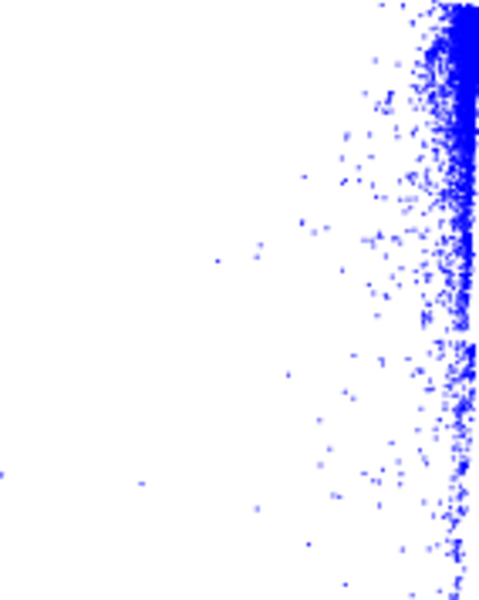
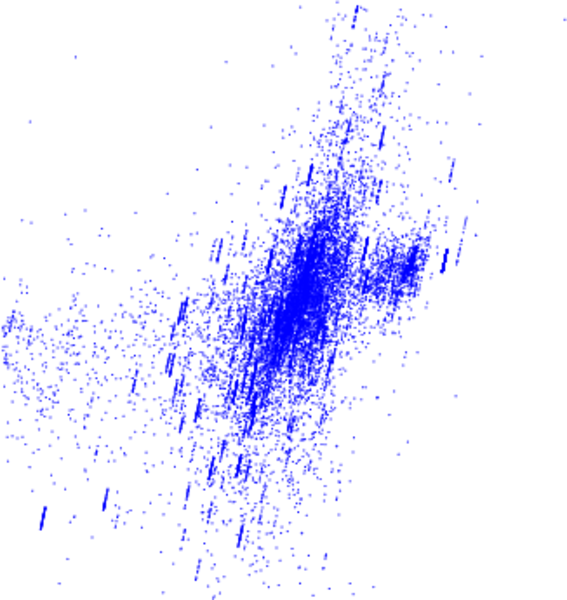
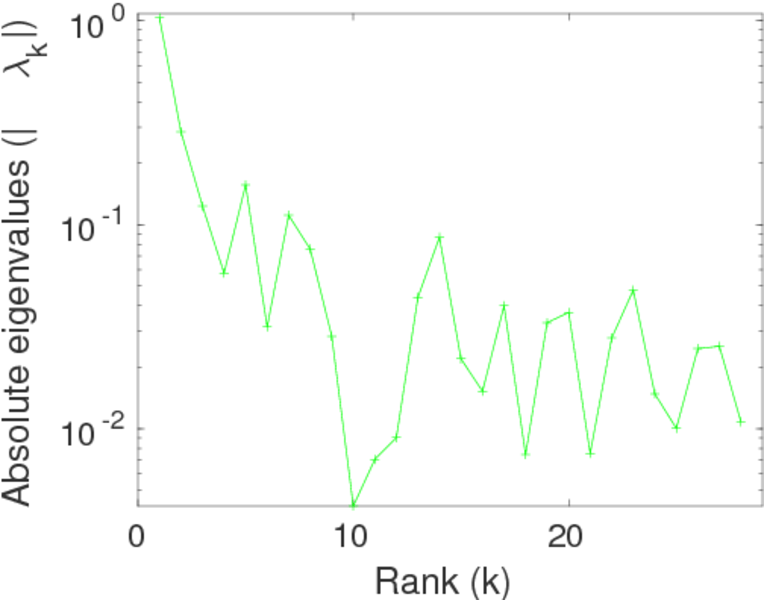
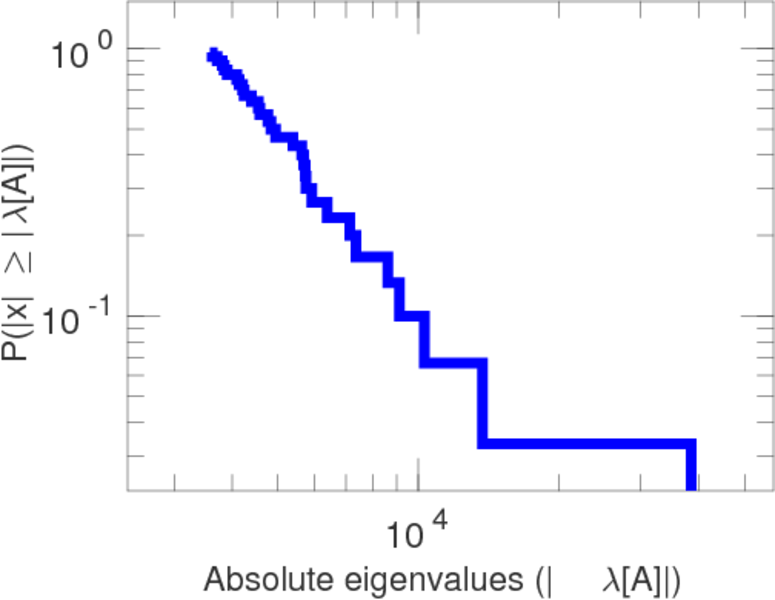
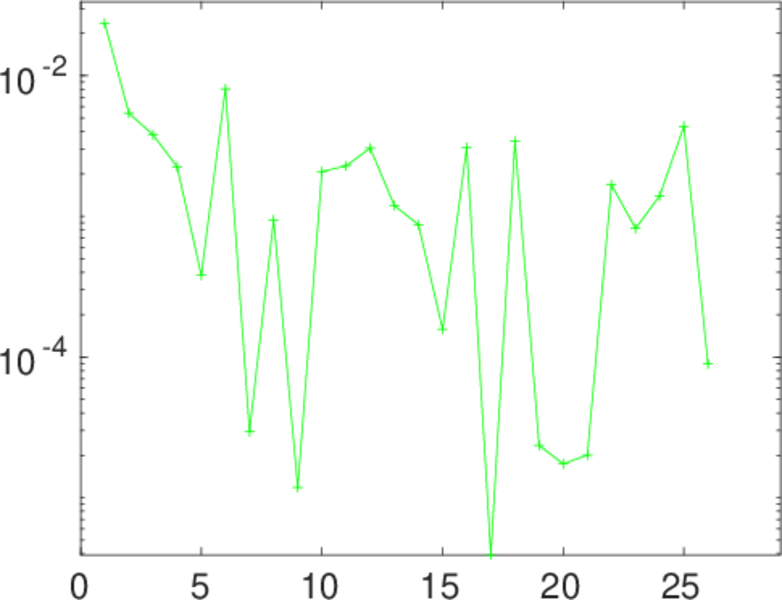
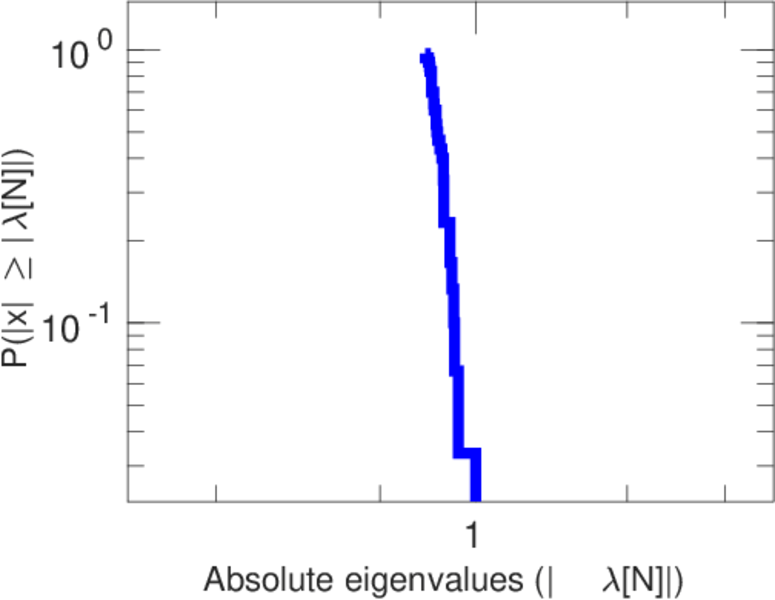
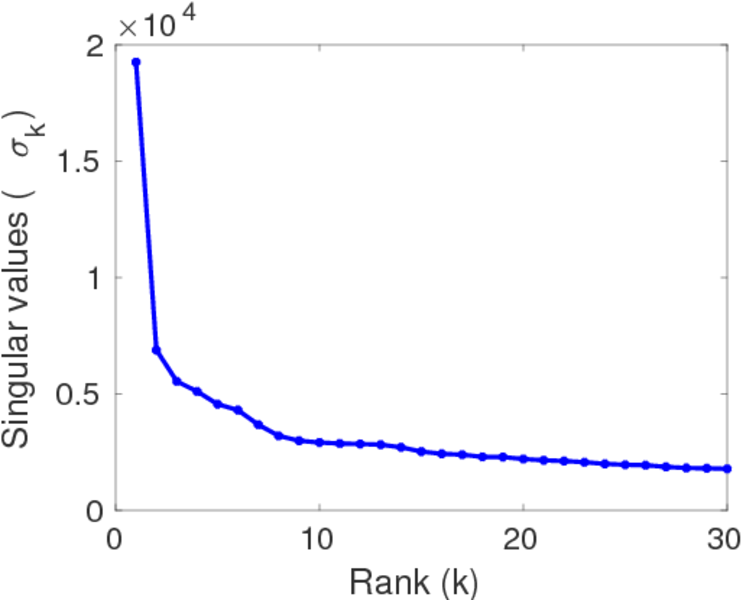
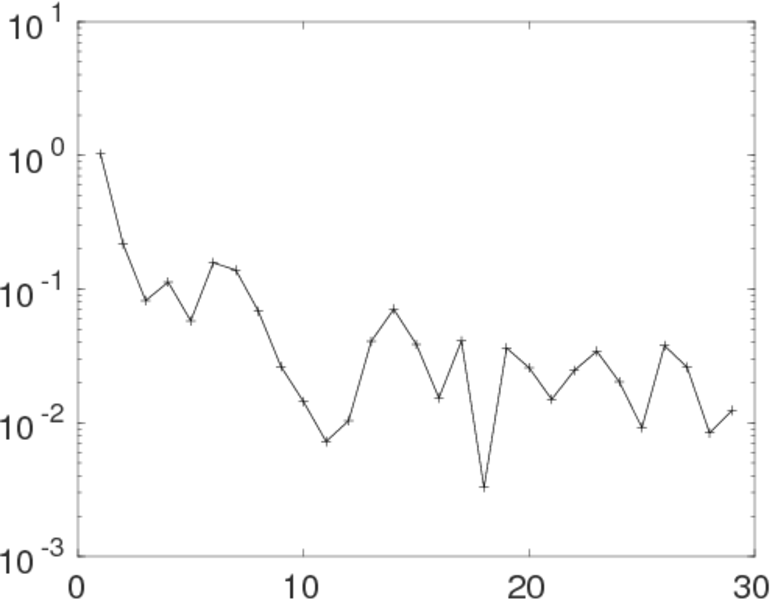
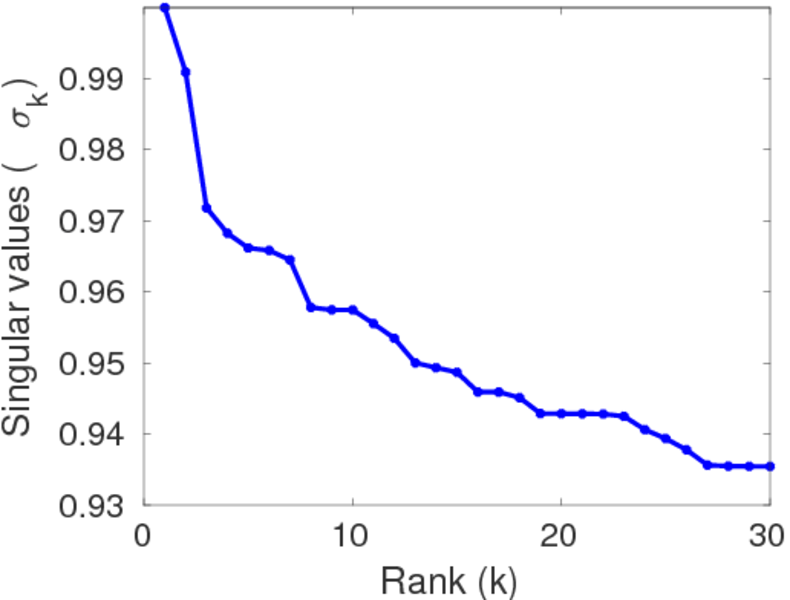
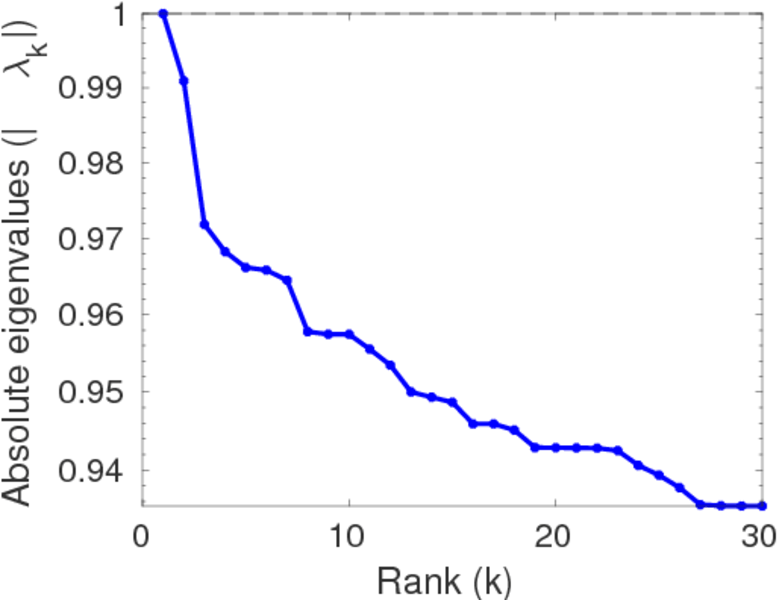
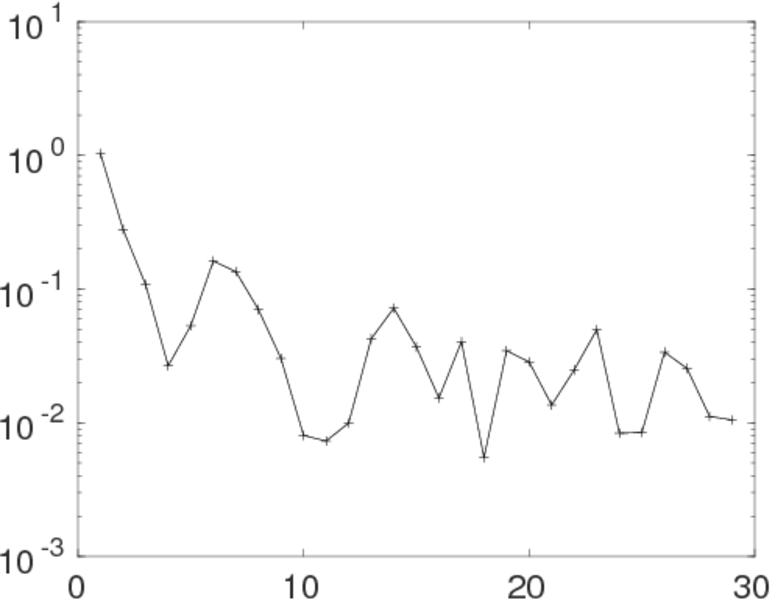
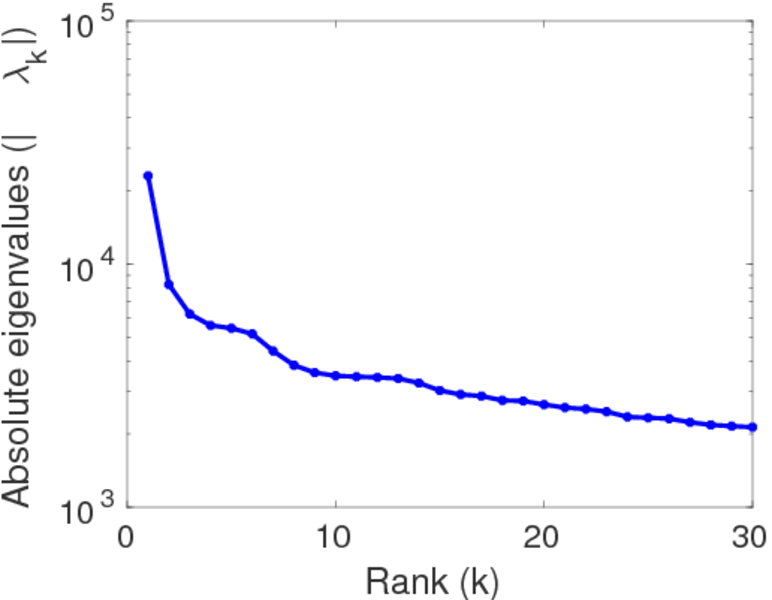
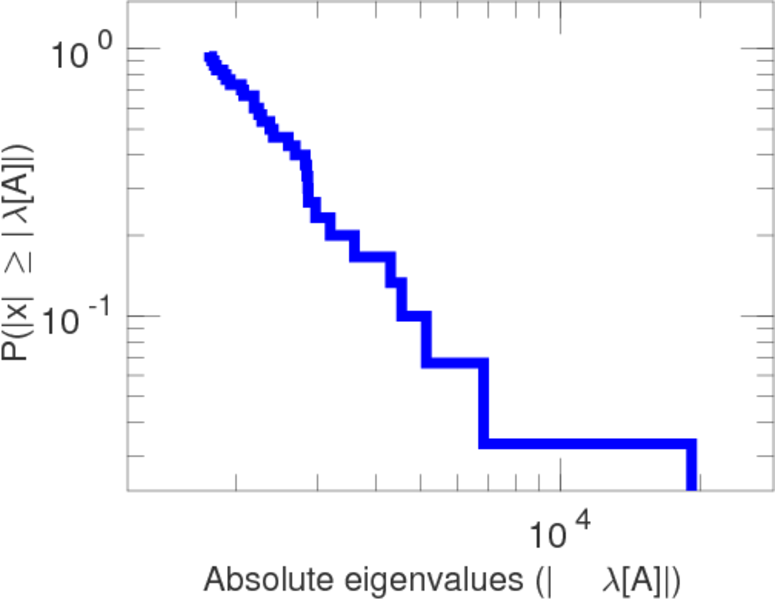
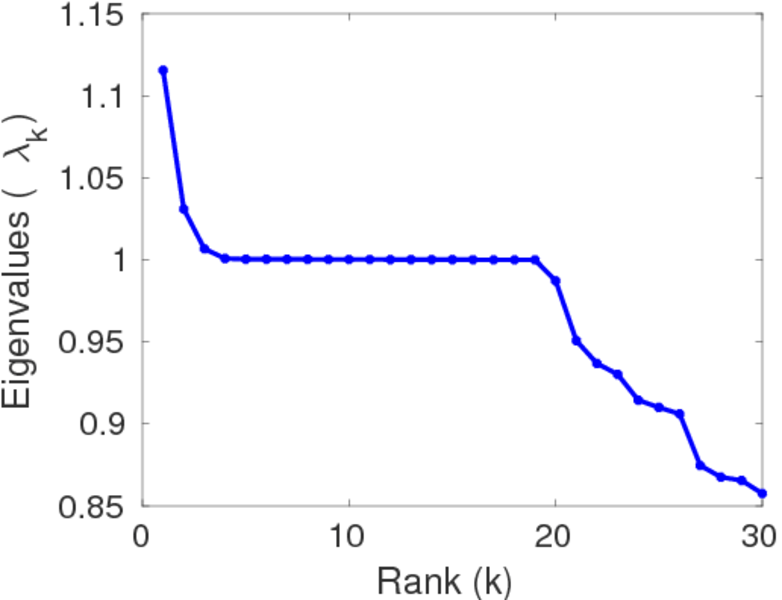
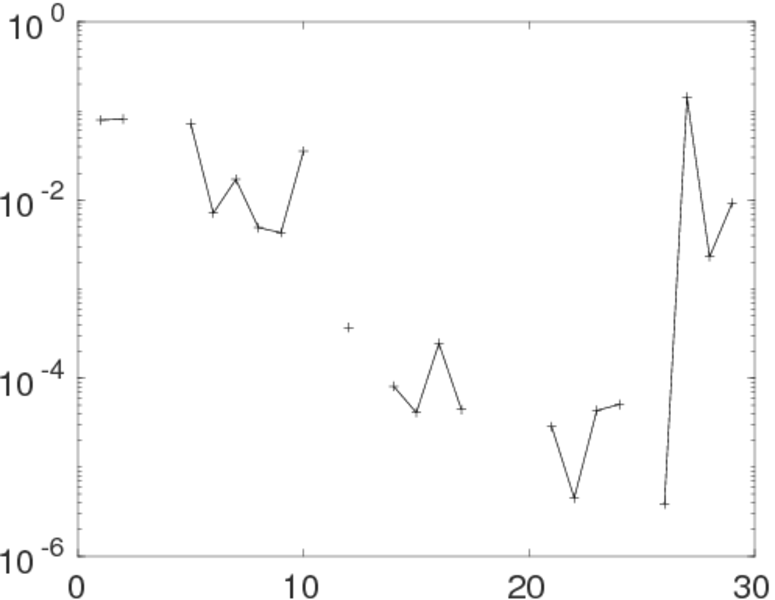
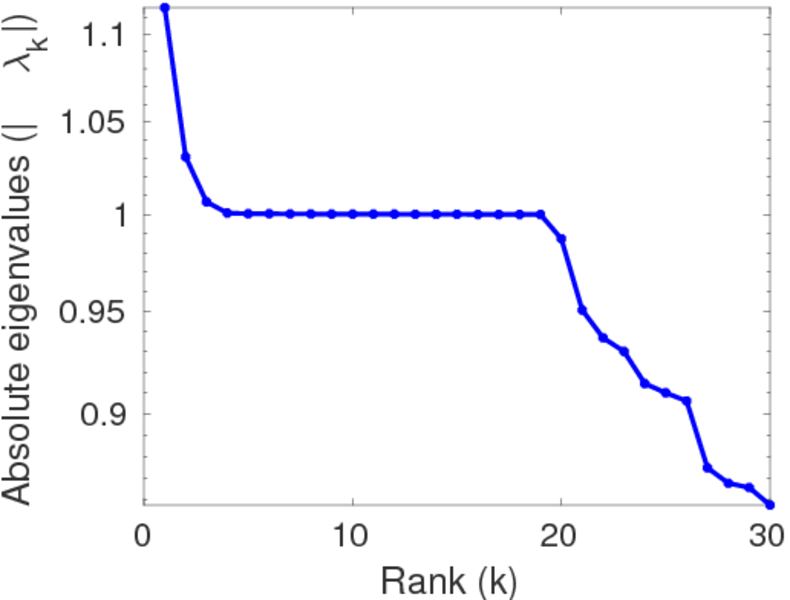
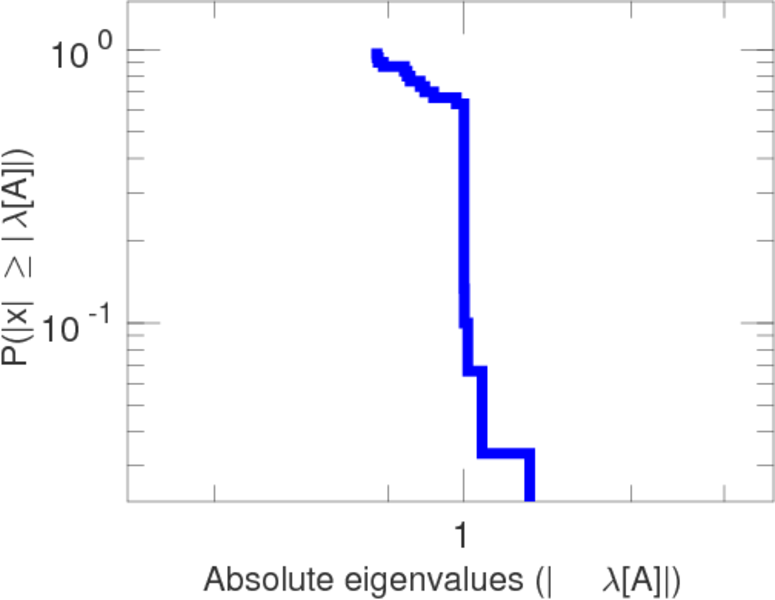
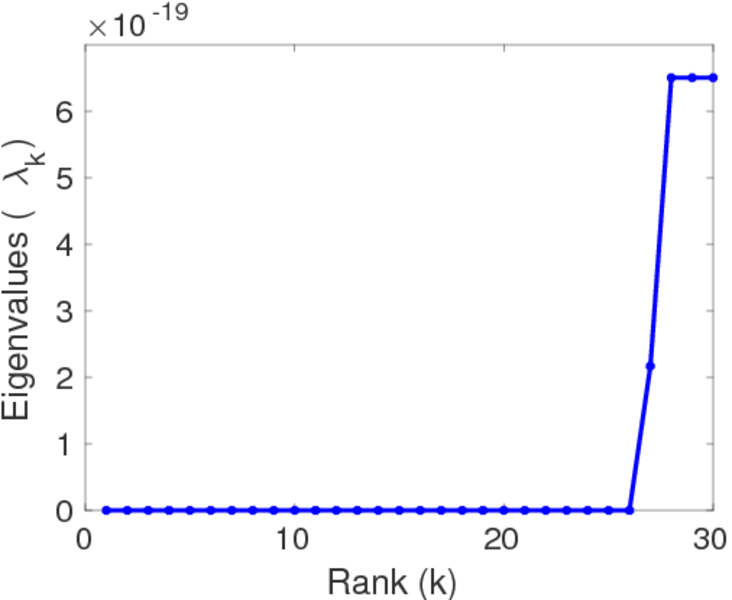
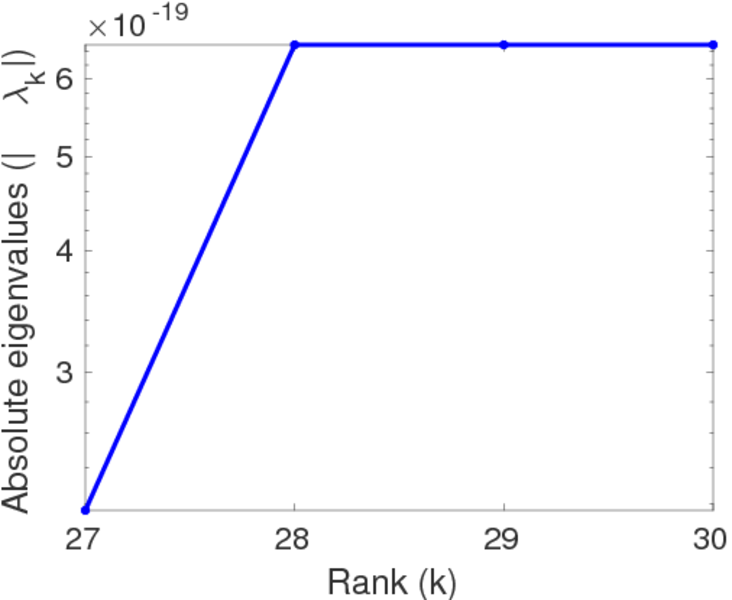
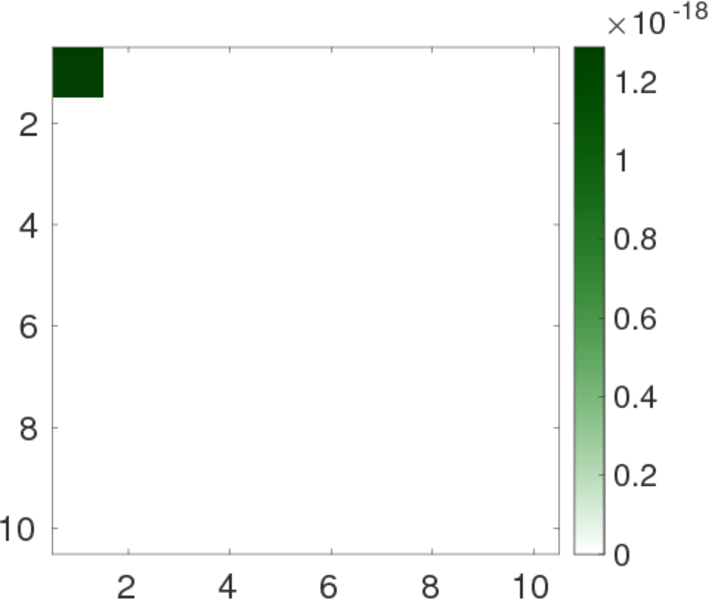
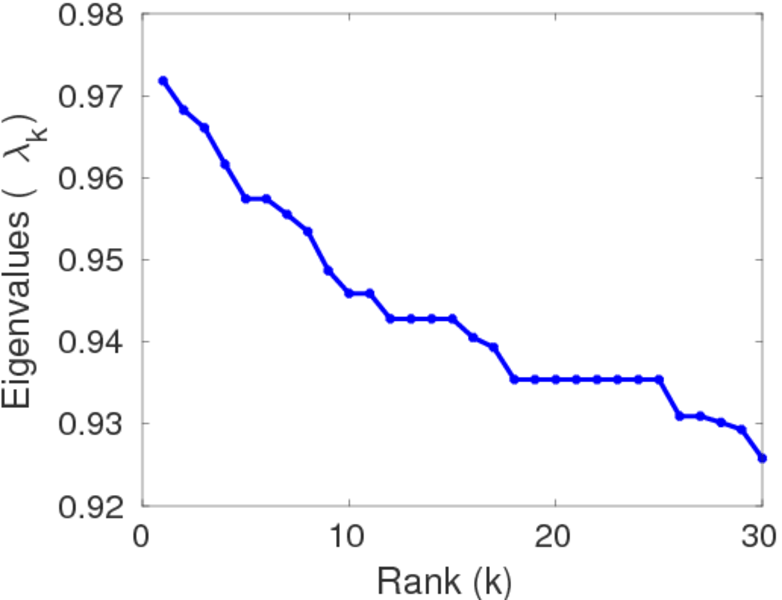
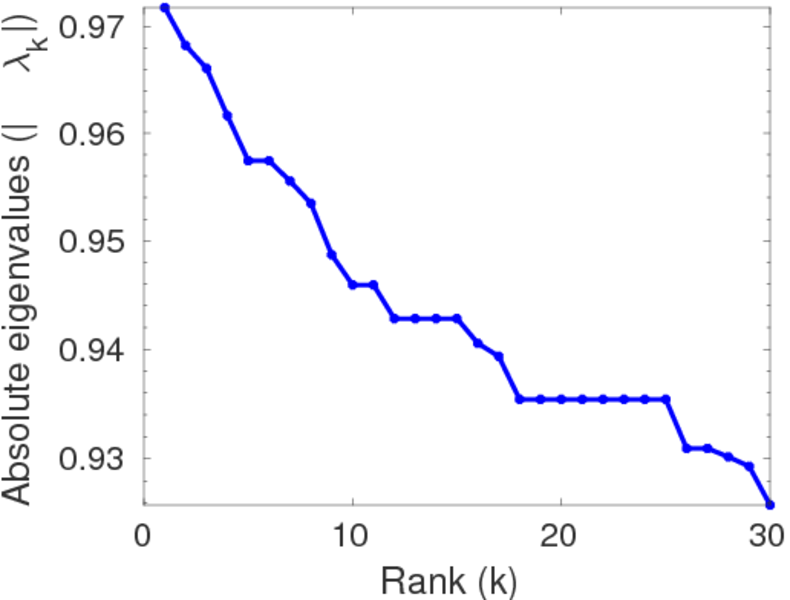
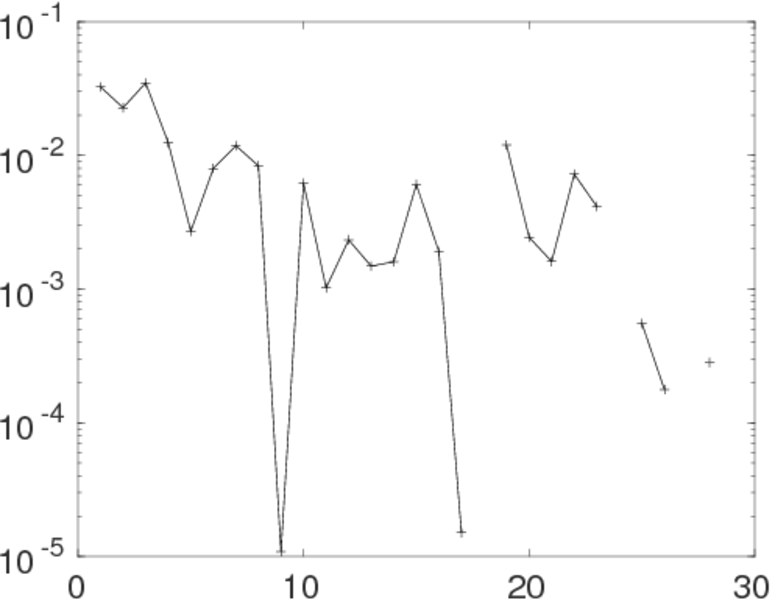
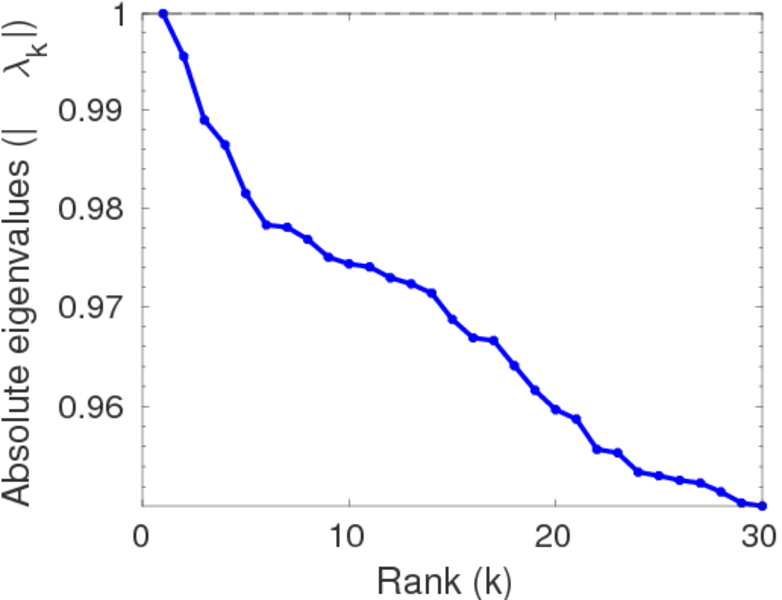
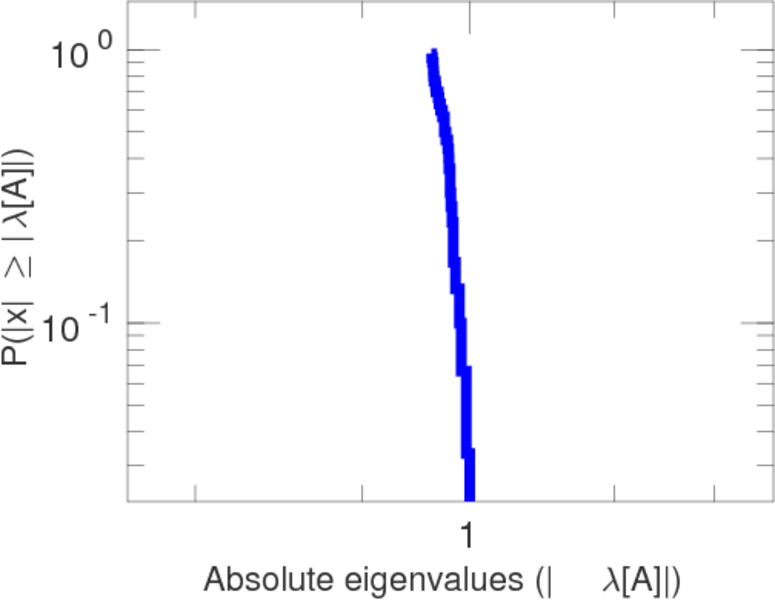
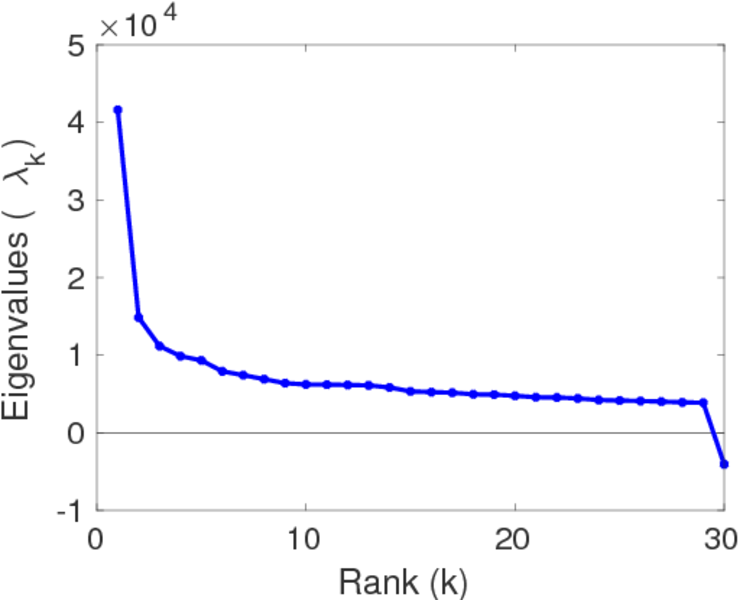
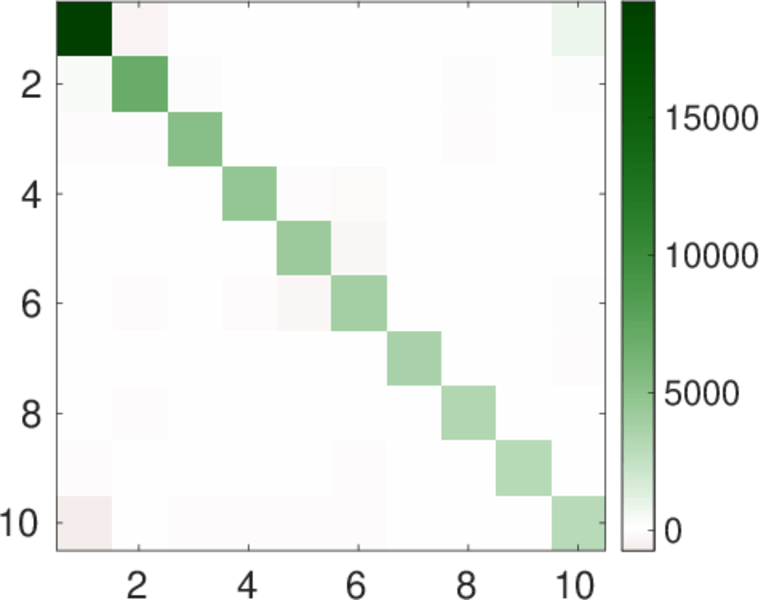
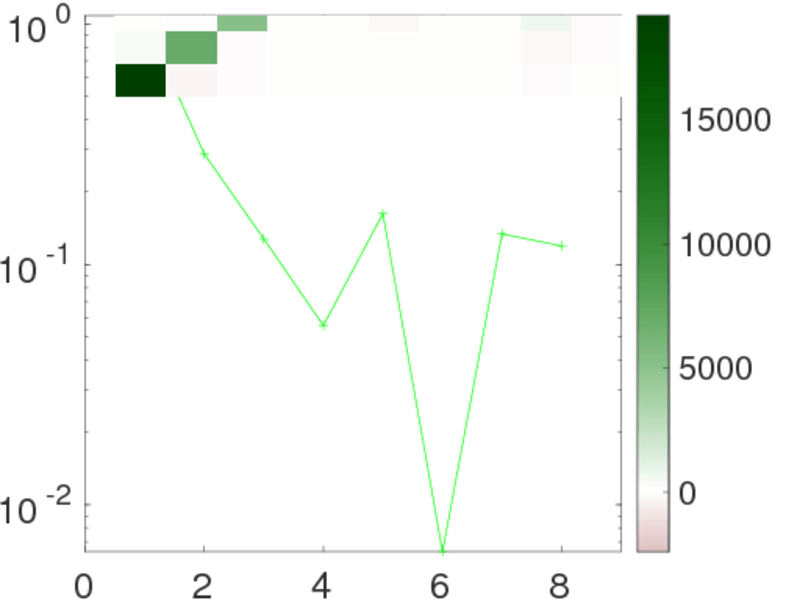
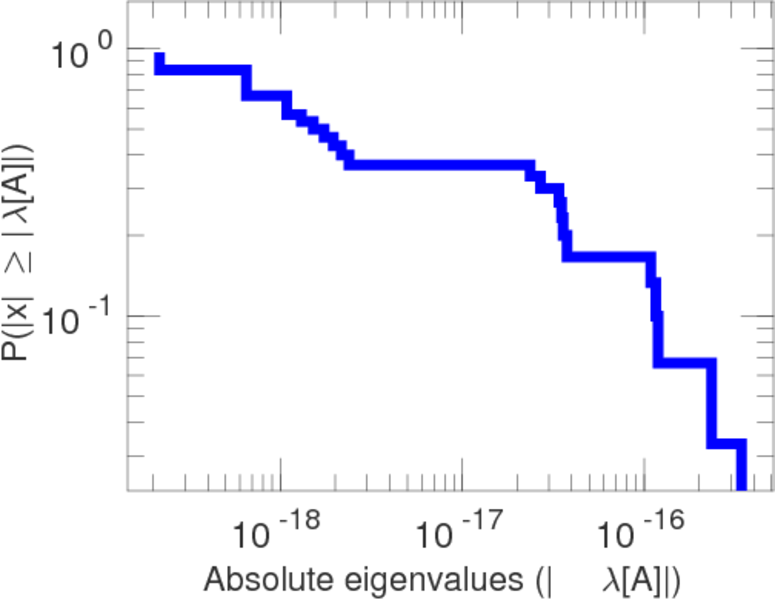
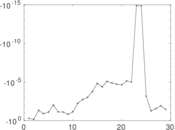
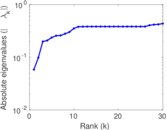
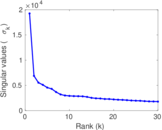
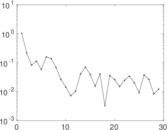
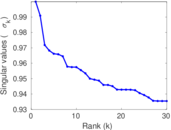
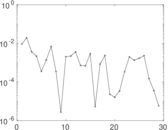
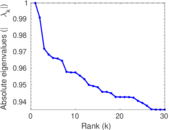
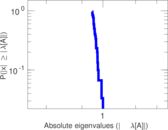
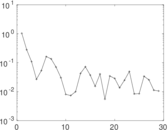
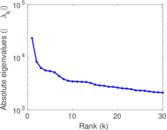
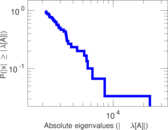
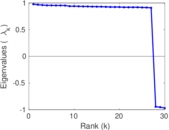
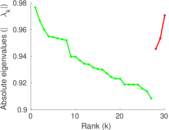
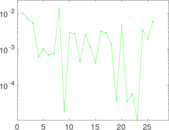
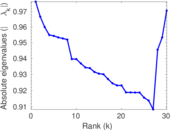
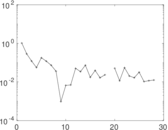
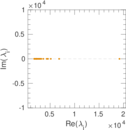
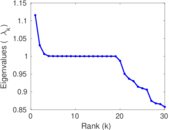
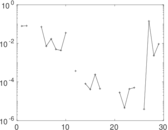
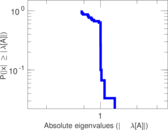
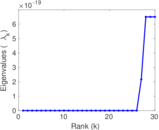
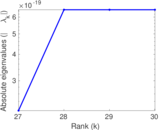
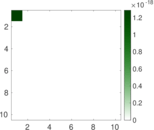
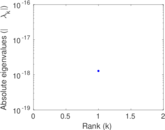
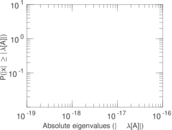
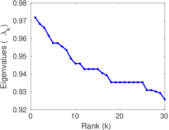
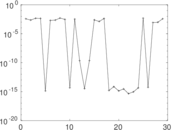
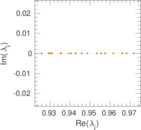
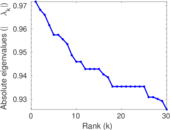
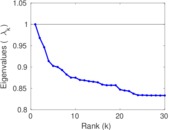
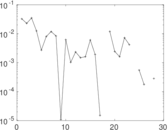
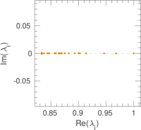
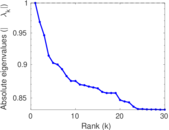
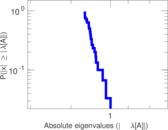
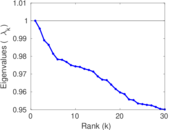
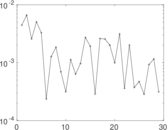
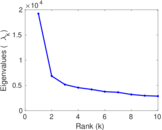
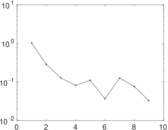
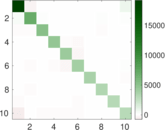
Matrix decompositions plots


Downloads
References
|
[1]
|
Jérôme Kunegis.
KONECT – The Koblenz Network Collection.
In Proc. Int. Conf. on World Wide Web Companion, pages
1343–1350, 2013.
[ http ]
|
|
[2]
|
Jun Sun, Jérôme Kunegis, and Steffen Staab.
Predicting user roles in social networks using transfer learning with
feature transformation.
In Proc. ICDM Workshop on Data Min. in Netw., 2016.
|
 KONECT ‣ Networks ‣
Buy Me a Coffee
KONECT ‣ Networks ‣
Buy Me a Coffee