Wikipedia talk (pl)
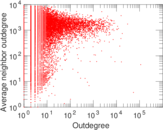
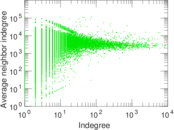
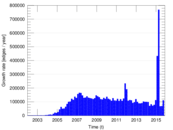
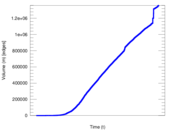
This is the communication network of the Polish Wikipedia. Nodes represent
users, and an edge from user A to user B denotes that user A wrote a message on
the talk page of user B at a certain timestamp.
Metadata
Statistics
| Size | n = | 155,820
|
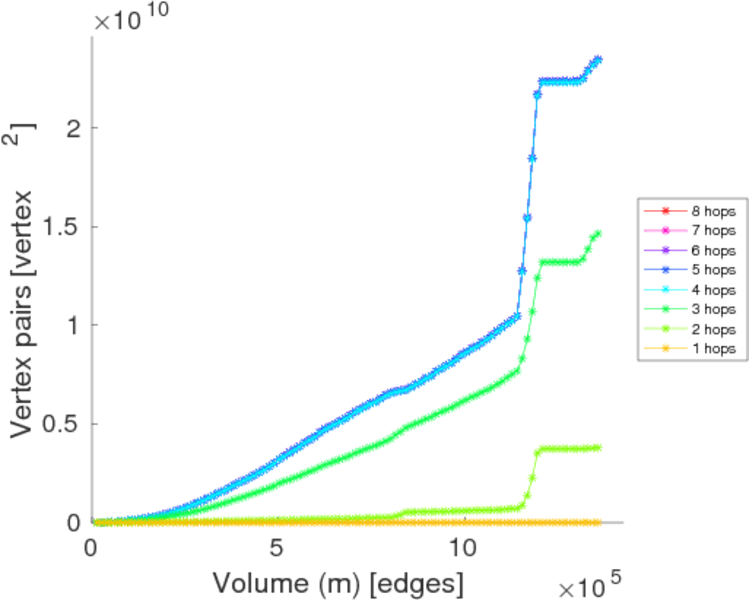
| Volume | m = | 1,358,426
|
| Unique edge count | m̿ = | 549,603
|
| Wedge count | s = | 3,473,856,834
|
| Claw count | z = | 56,155,788,572,697
|
| Triangle count | t = | 2,292,943
|
| Square count | q = | 1,928,005,260
|
| 4-Tour count | T4 = | 29,320,369,940
|
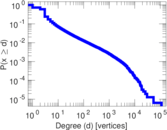
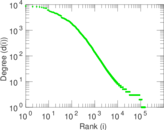
| Maximum degree | dmax = | 112,031
|
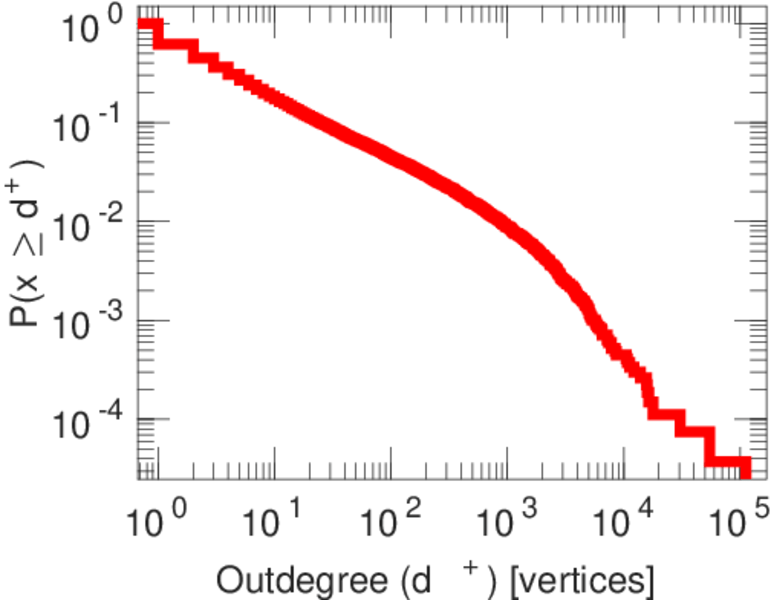
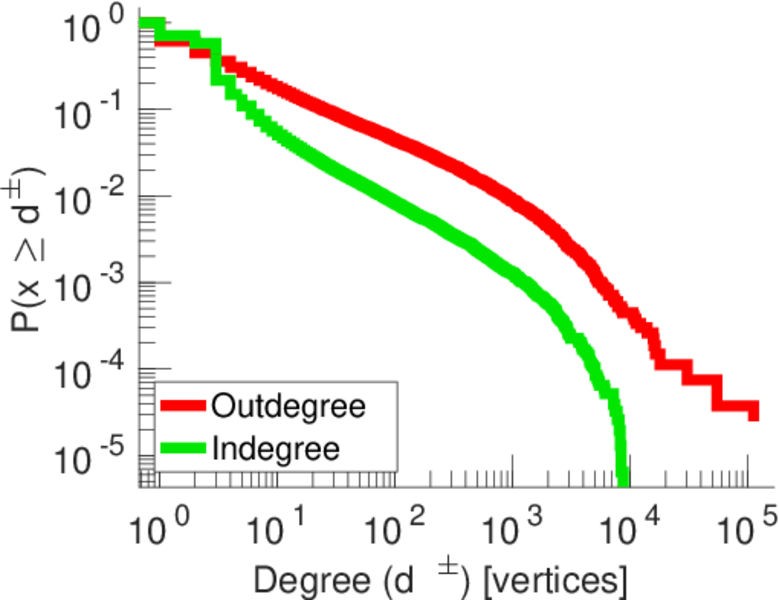
| Maximum outdegree | d+max = | 112,031
|
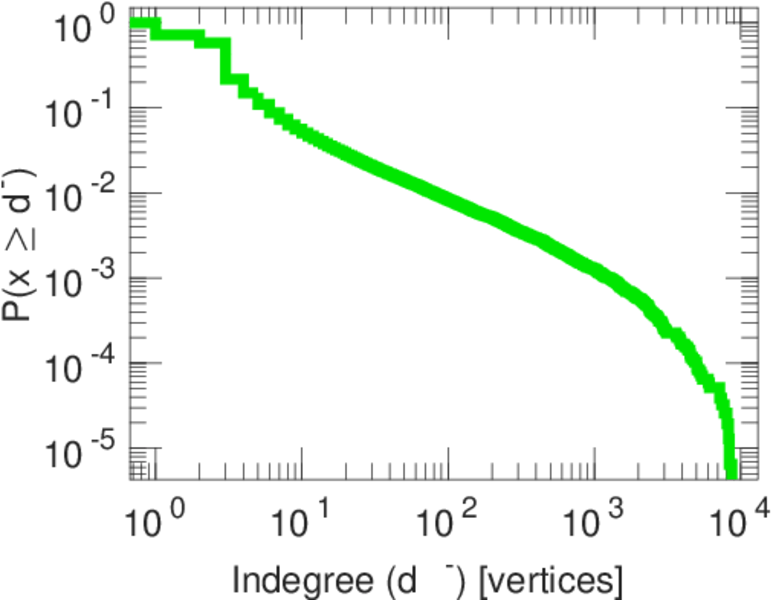
| Maximum indegree | d−max = | 8,726
|
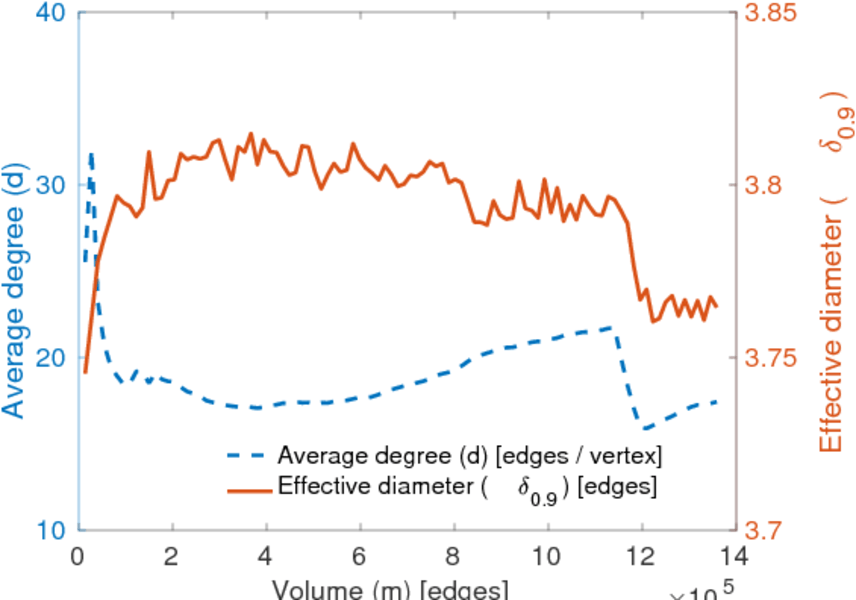
| Average degree | d = | 17.435 8
|
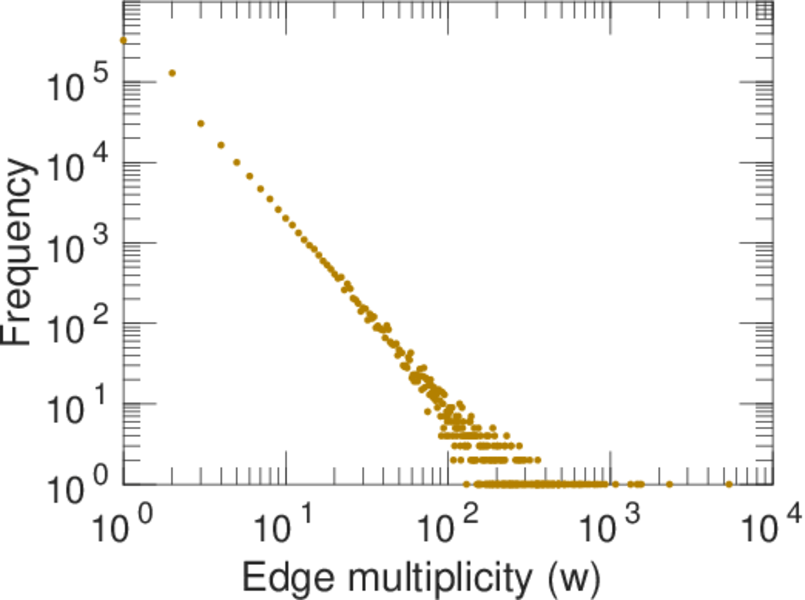
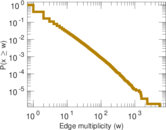
| Average edge multiplicity | m̃ = | 2.471 65
|
| Size of LCC | N = | 153,167
|
| Size of LSCC | Ns = | 15,994
|
| Relative size of LSCC | Nrs = | 0.102 644
|
| Diameter | δ = | 7
|
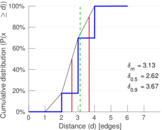
| 50-Percentile effective diameter | δ0.5 = | 2.621 82
|
| 90-Percentile effective diameter | δ0.9 = | 3.671 64
|
| Median distance | δM = | 3
|
| Mean distance | δm = | 3.127 80
|
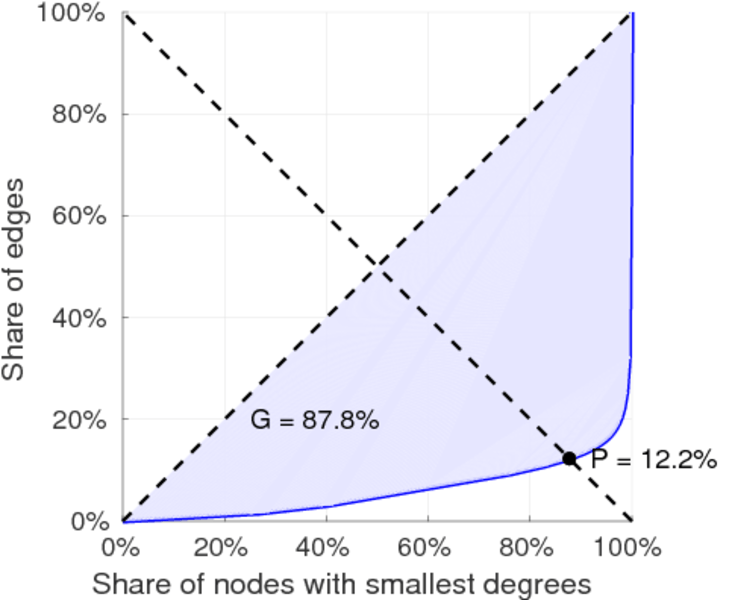
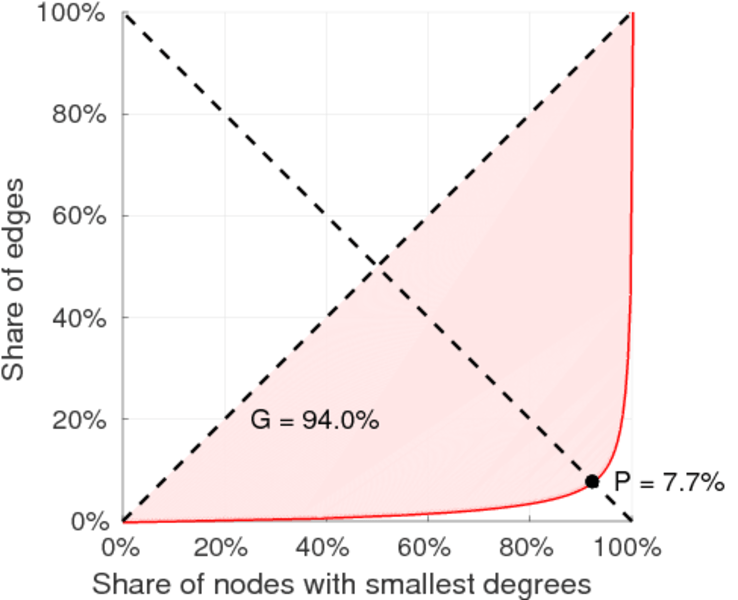
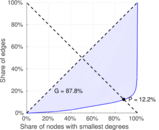
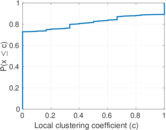
| Gini coefficient | G = | 0.878 303
|
| Balanced inequality ratio | P = | 0.121 534
|
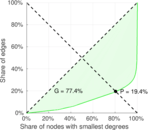
| Outdegree balanced inequality ratio | P+ = | 0.076 517 2
|
| Indegree balanced inequality ratio | P− = | 0.193 785
|
| Relative edge distribution entropy | Her = | 0.736 134
|
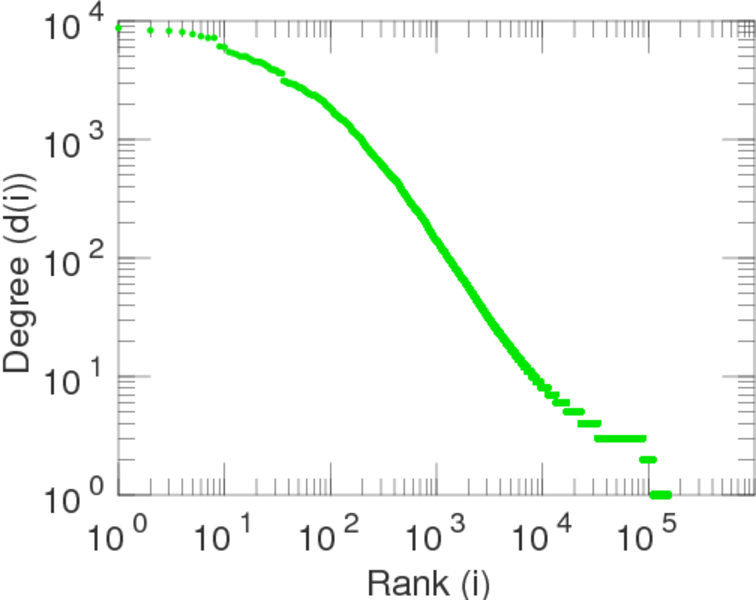
| Power law exponent | γ = | 2.433 03
|
| Tail power law exponent | γt = | 1.841 00
|
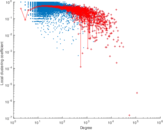
| Degree assortativity | ρ = | −0.189 731
|
| Degree assortativity p-value | pρ = | 0.000 00
|
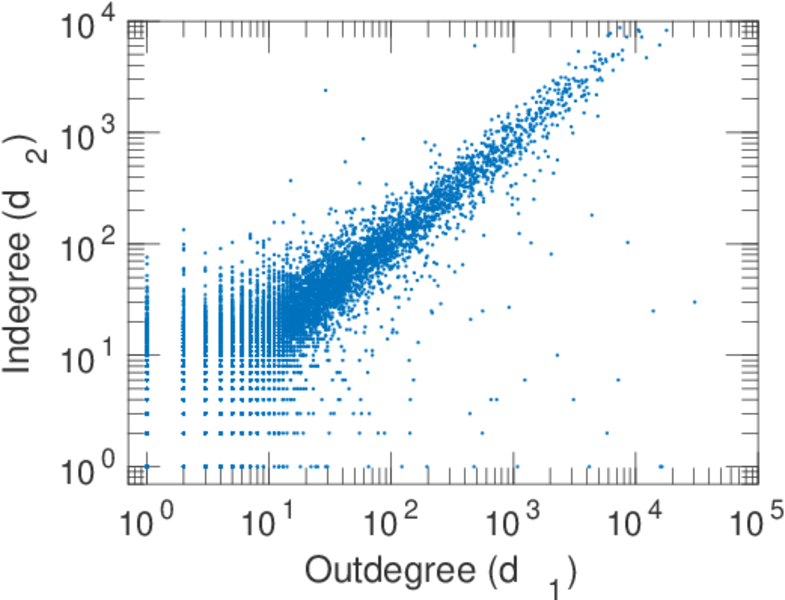
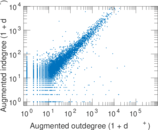
| In/outdegree correlation | ρ± = | +0.748 227
|
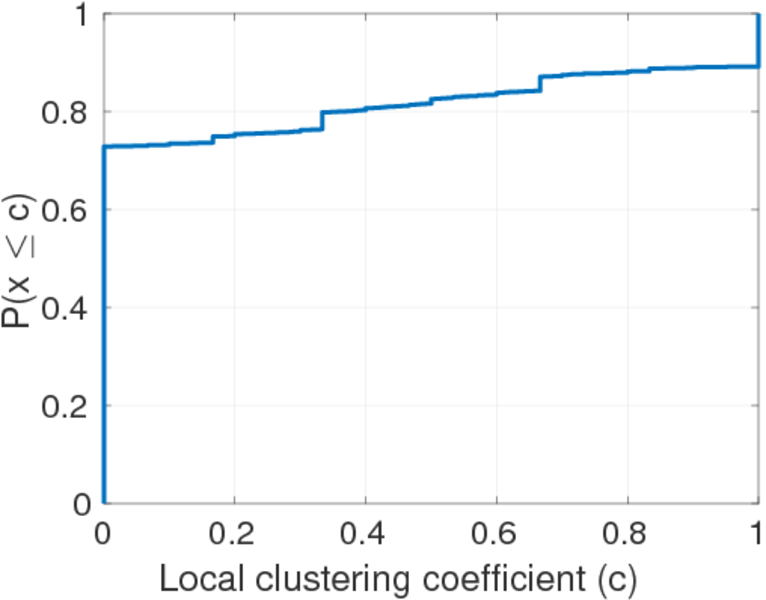
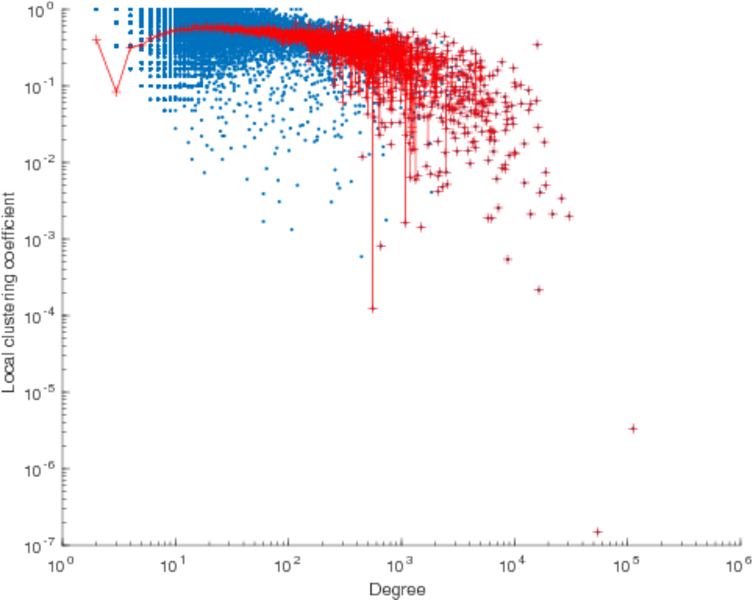
| Clustering coefficient | c = | 0.001 980 17
|
| Directed clustering coefficient | c± = | 0.058 978 0
|
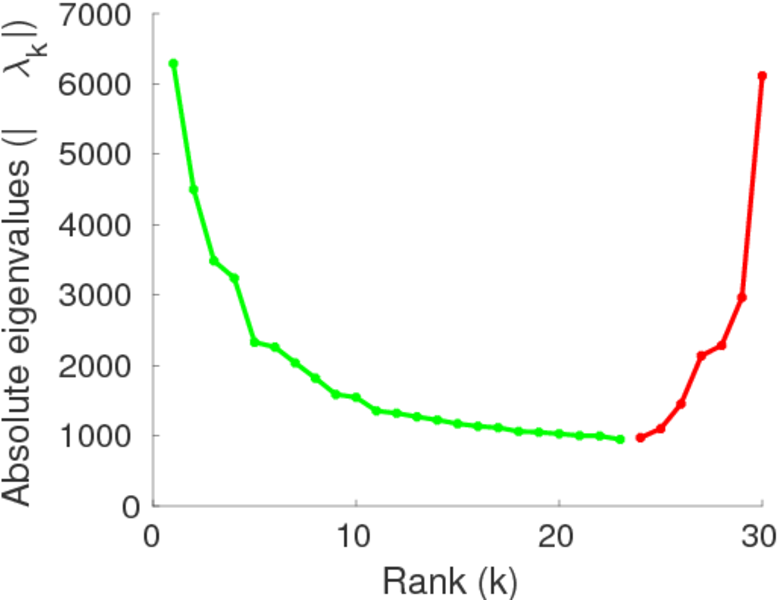
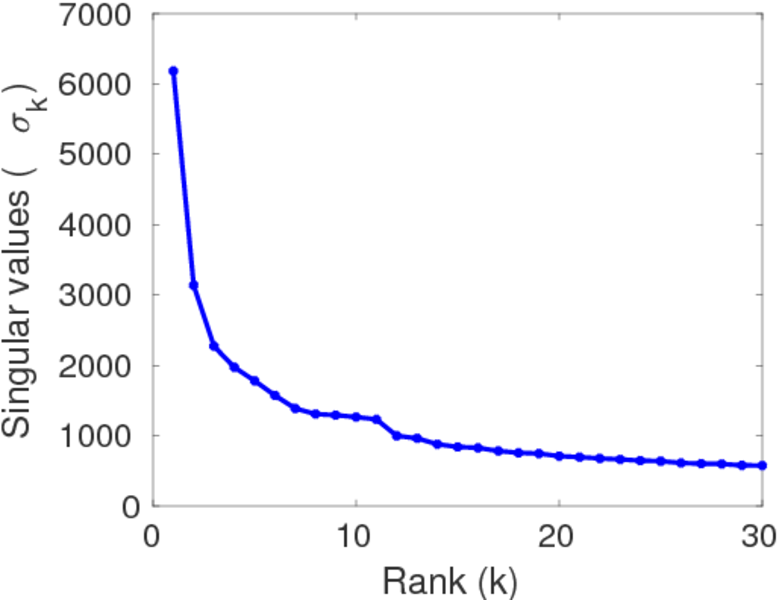
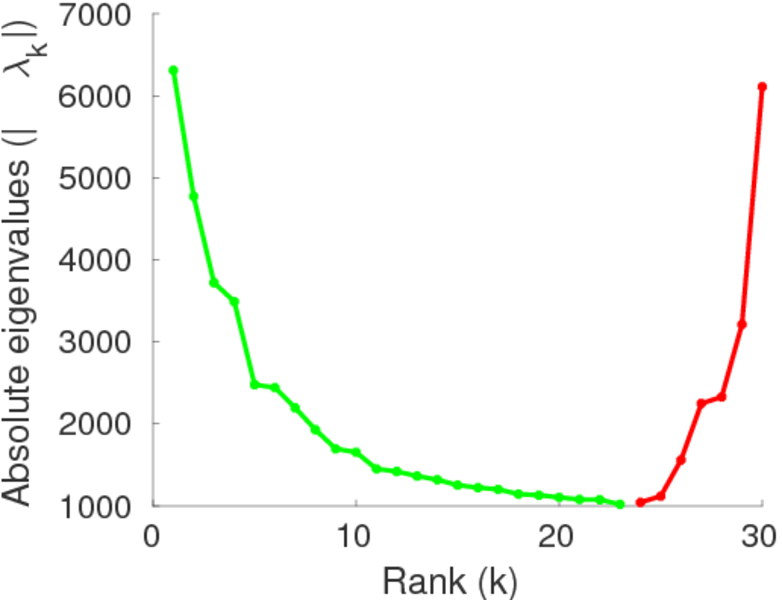
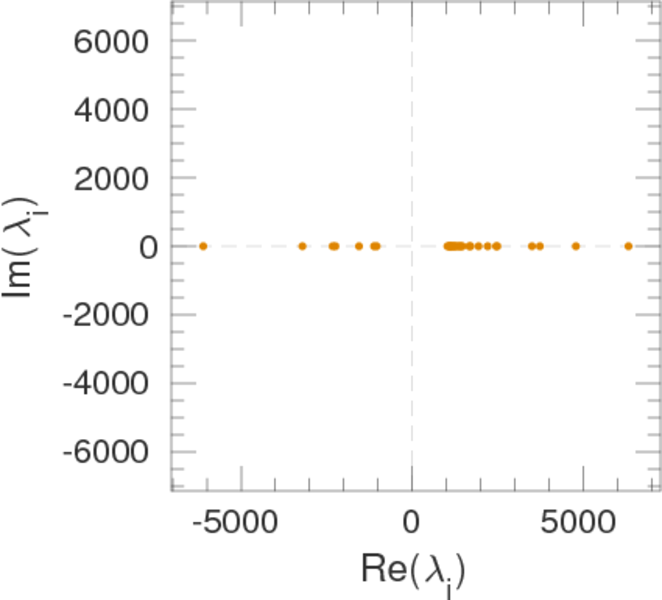
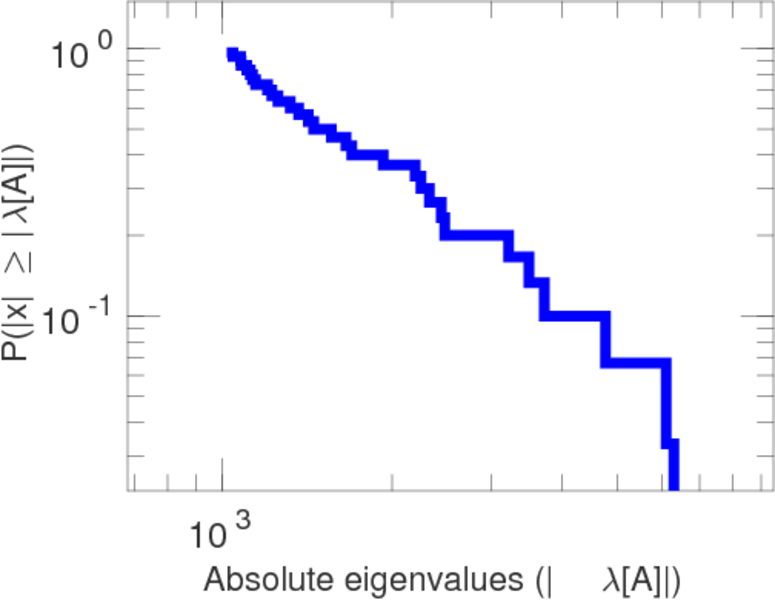
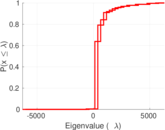
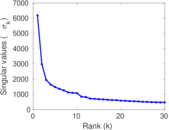
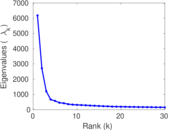
| Spectral norm | α = | 6,290.51
|
| Operator 2-norm | ν = | 6,183.55
|
| Algebraic connectivity | a = | 0.110 017
|
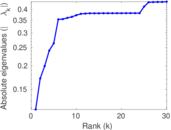
| Spectral separation | |λ1[A] / λ2[A]| = | 1.028 78
|
| Non-bipartivity | bA = | 0.027 970 6
|
| Algebraic non-bipartivity | χ = | 0.106 509
|
| Spectral bipartite frustration | bK = | 0.004 392 51
|
| Controllability | C = | 136,879
|
| Relative controllability | Cr = | 0.878 443
|
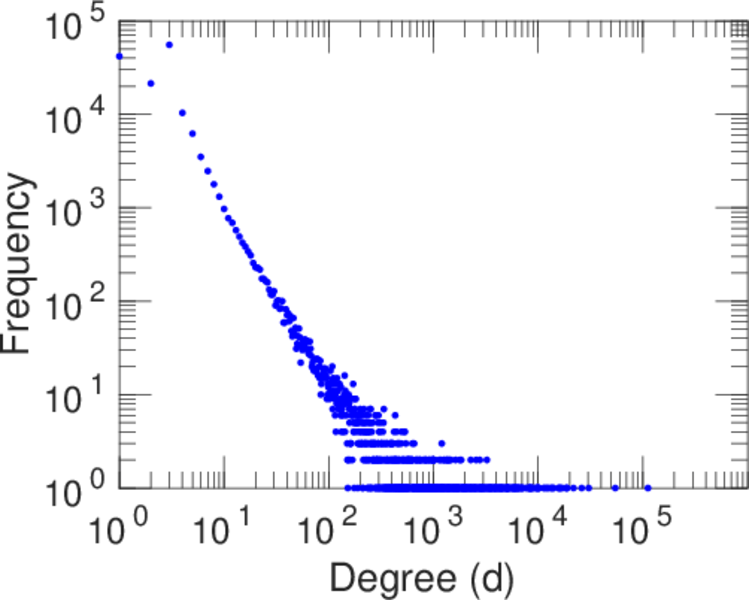
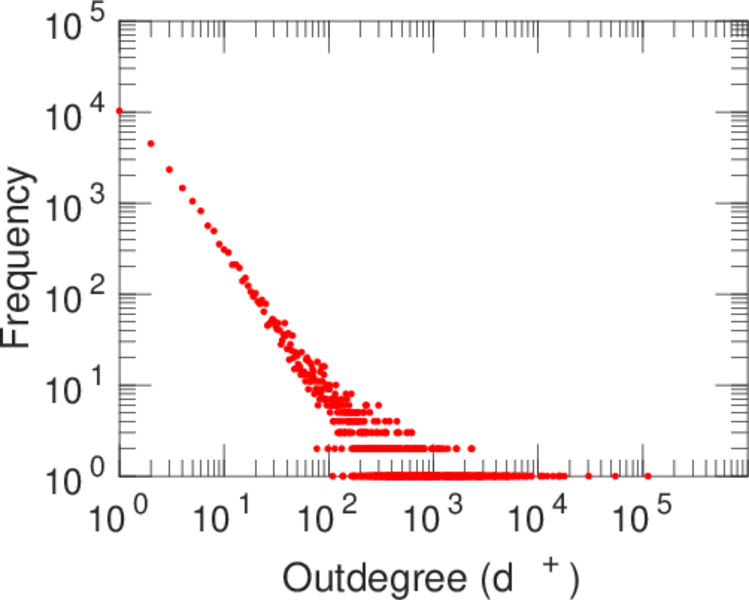
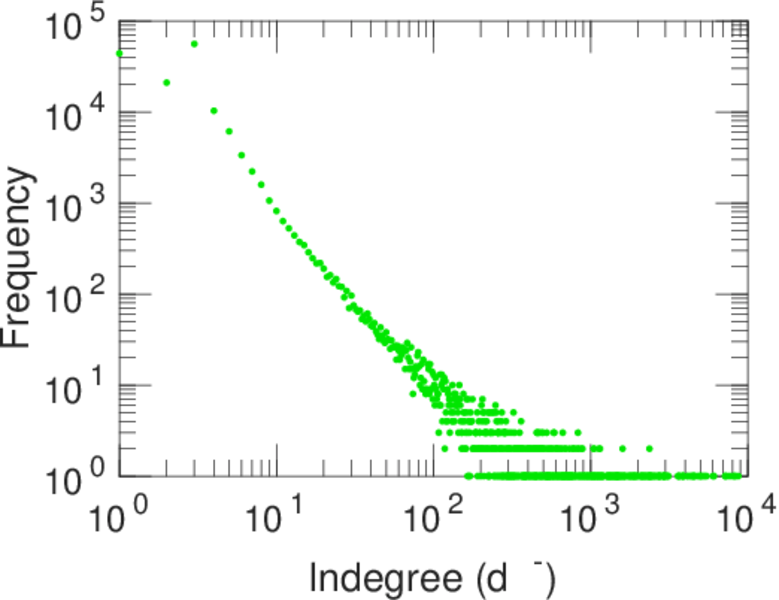
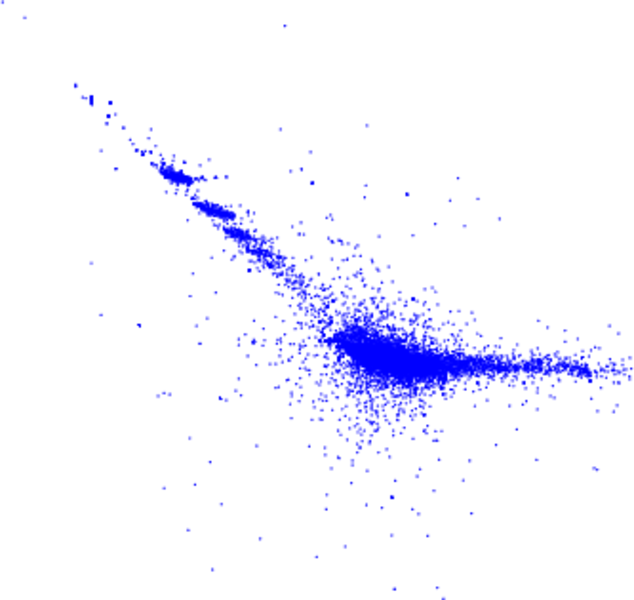
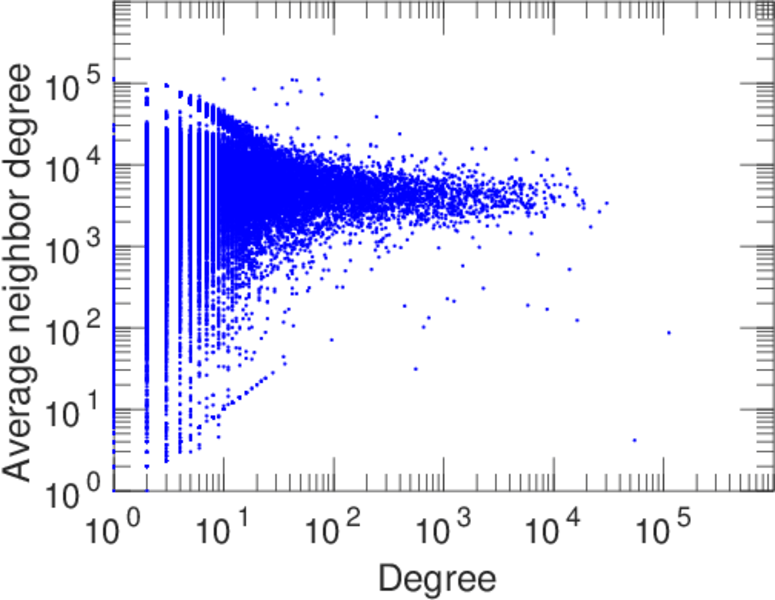
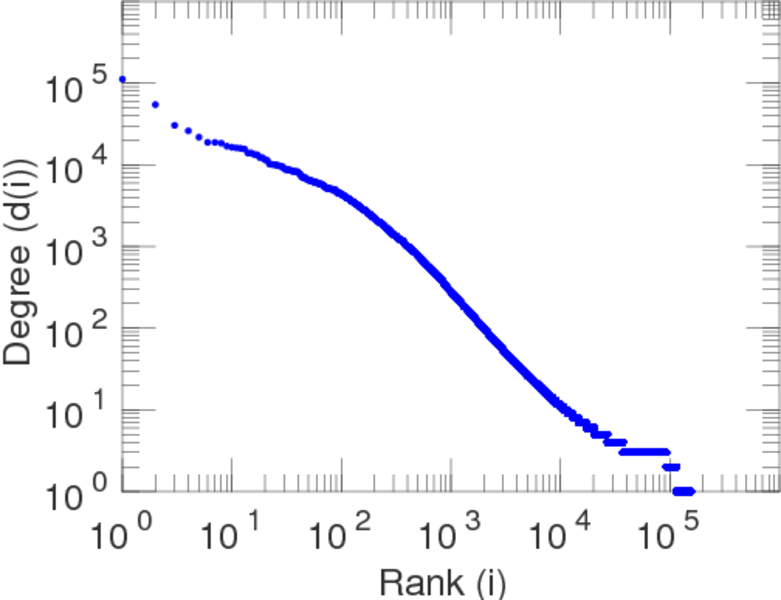
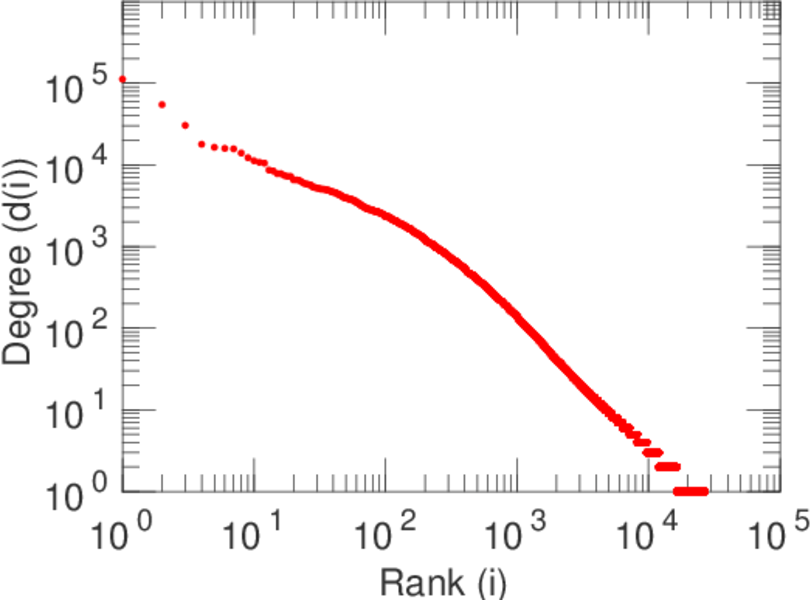
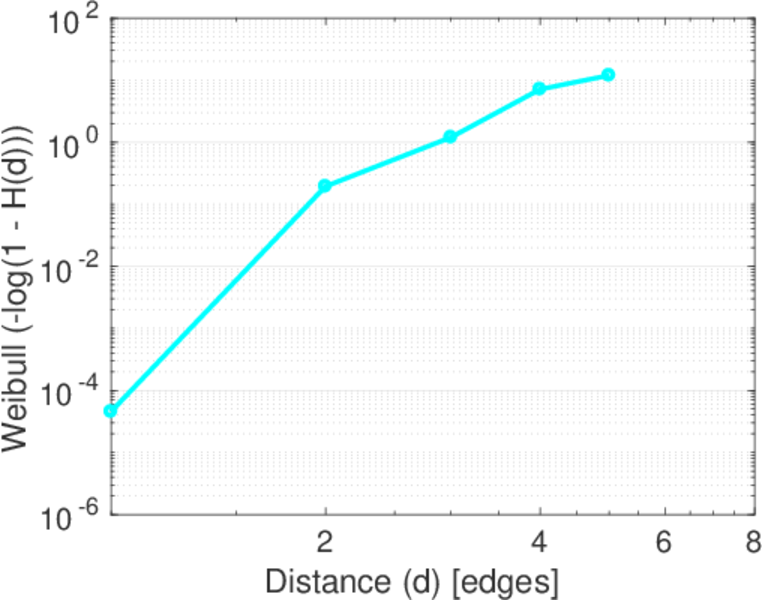
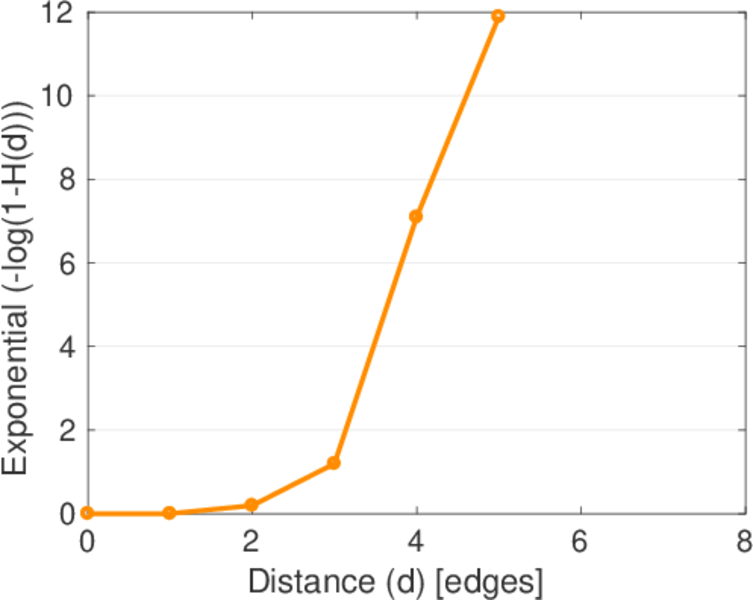
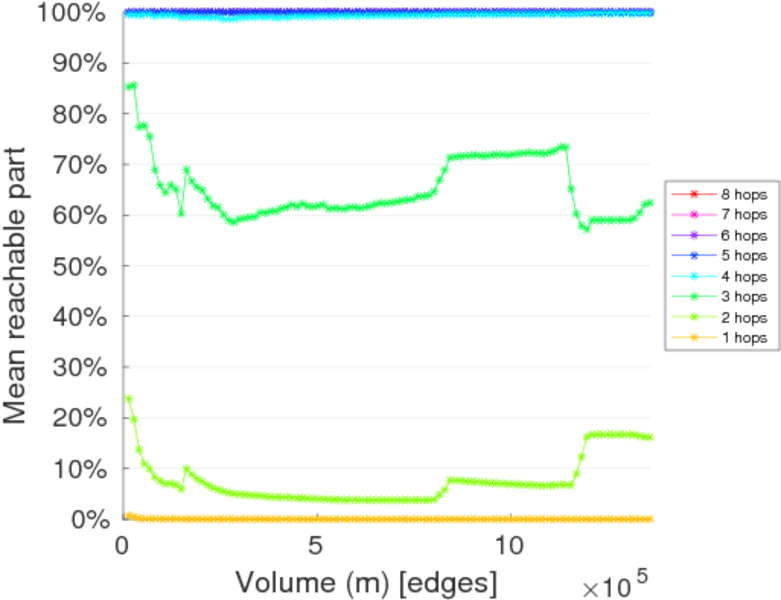
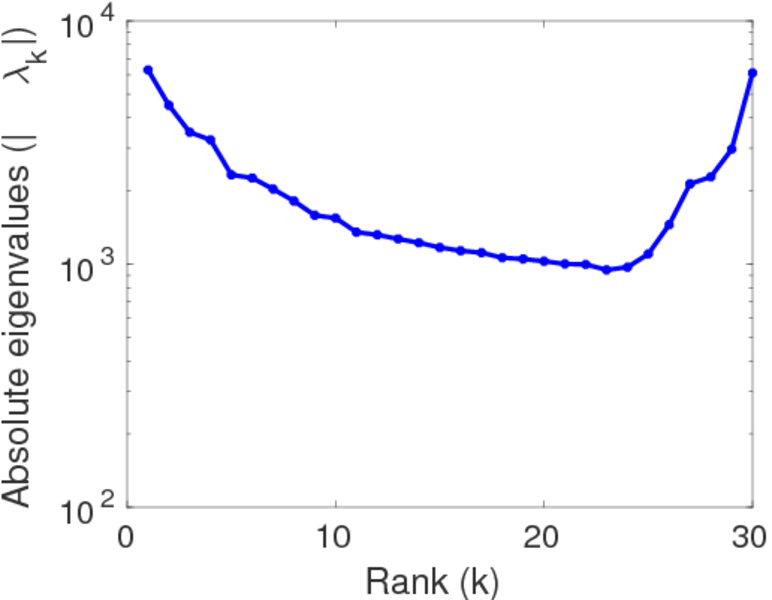
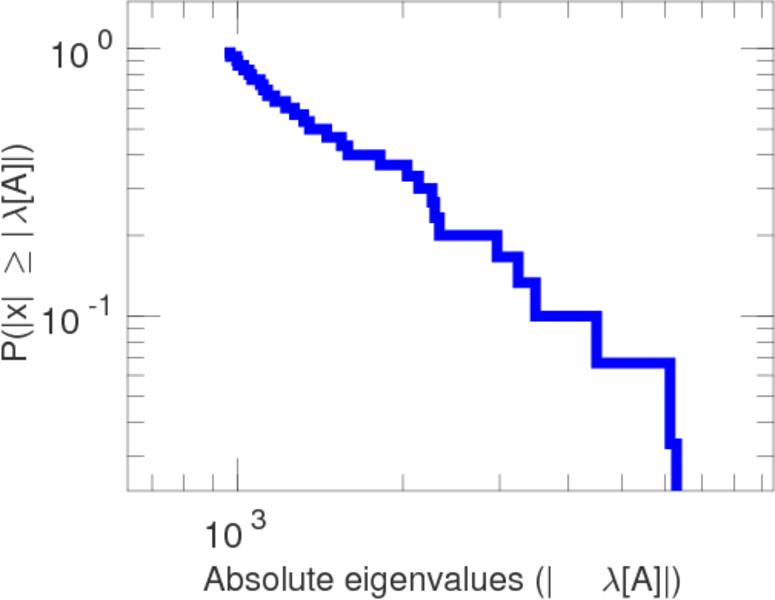
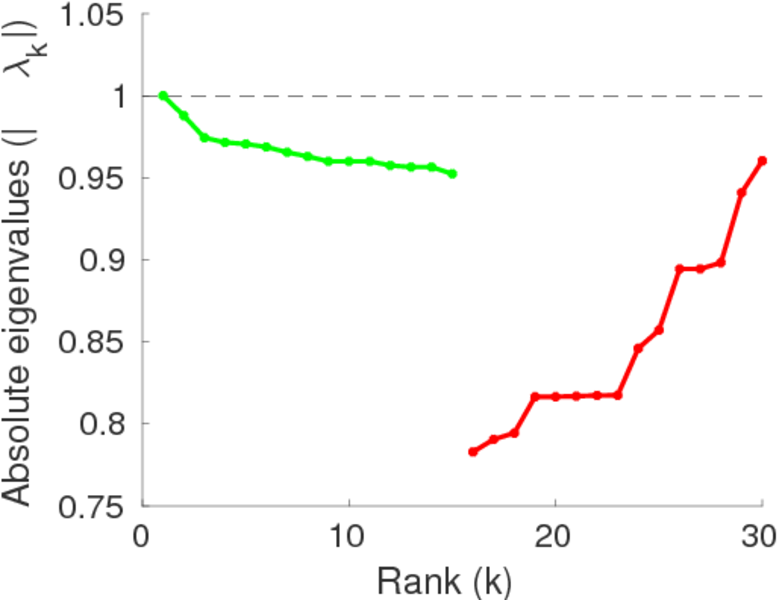
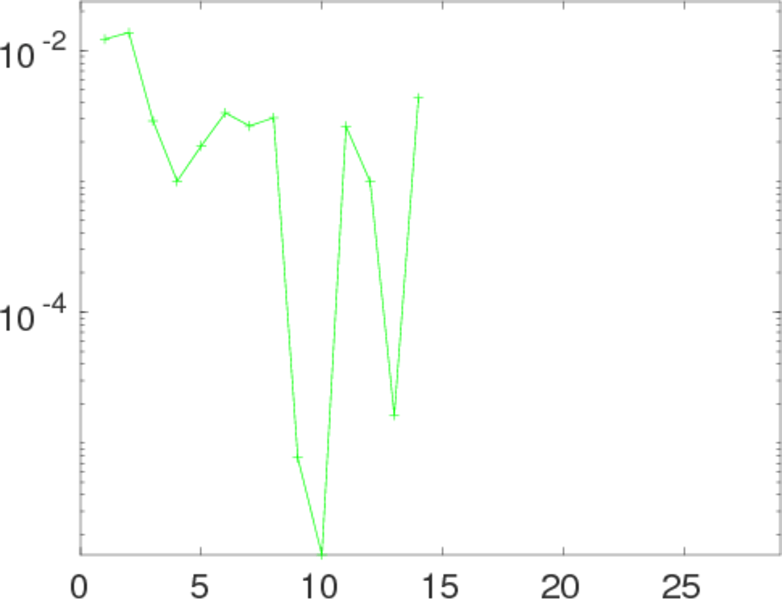
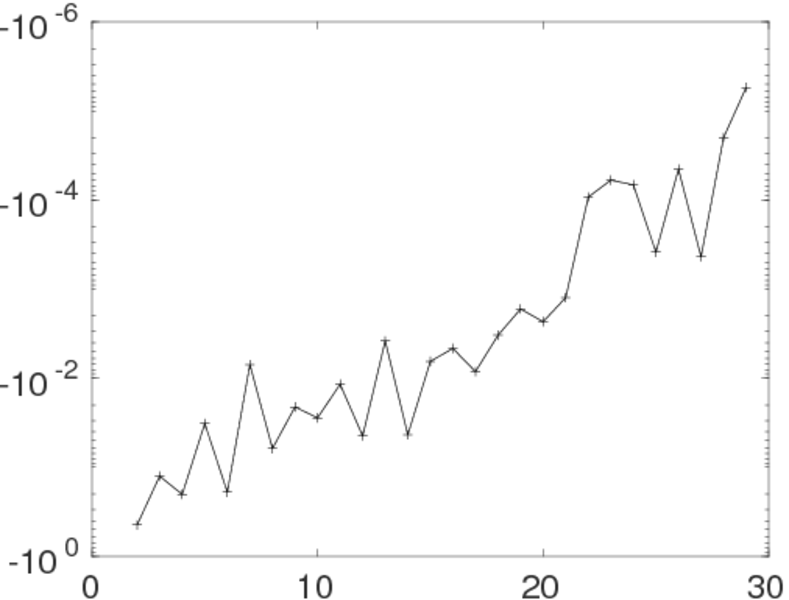
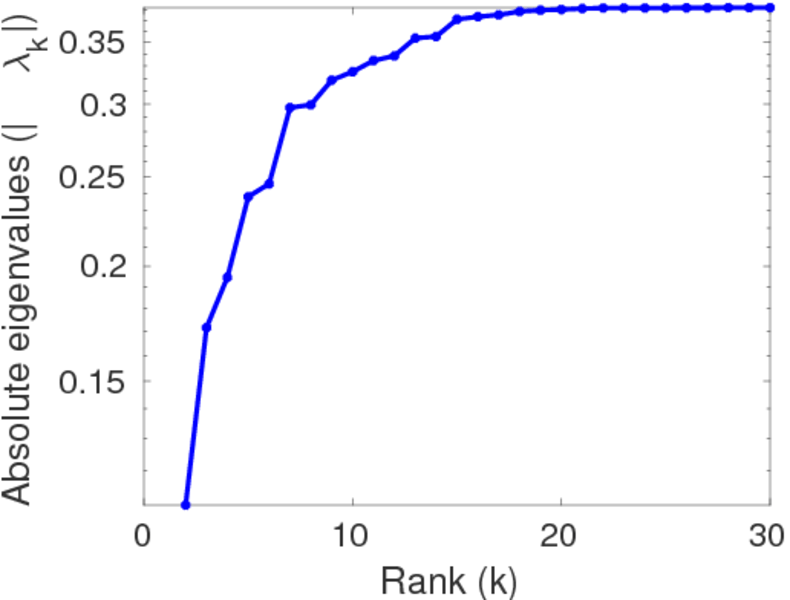
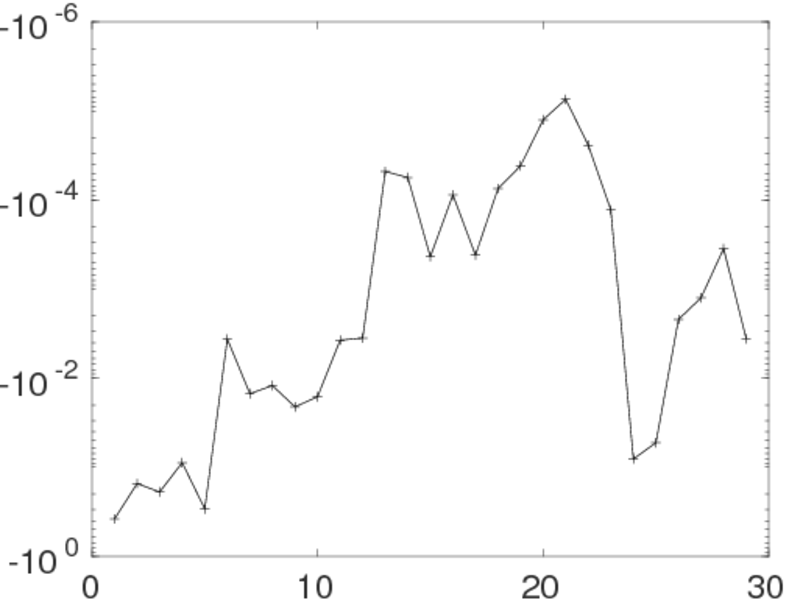
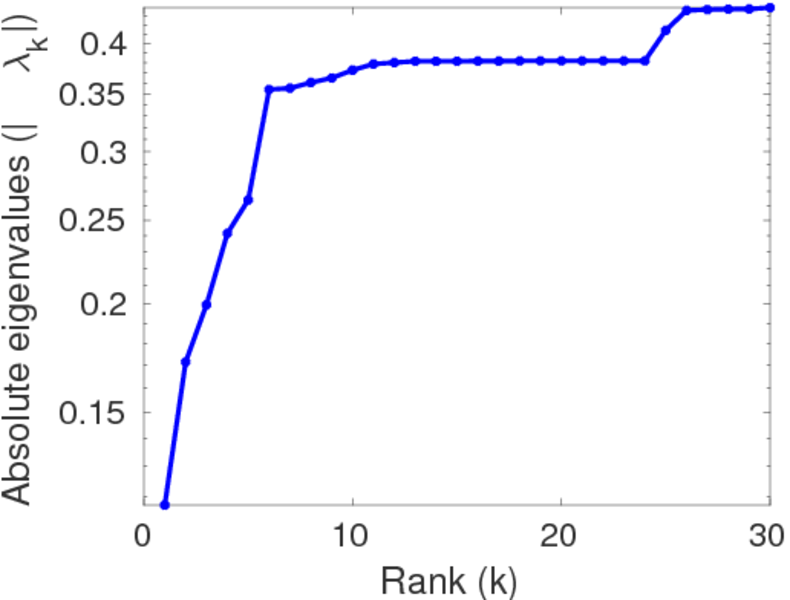
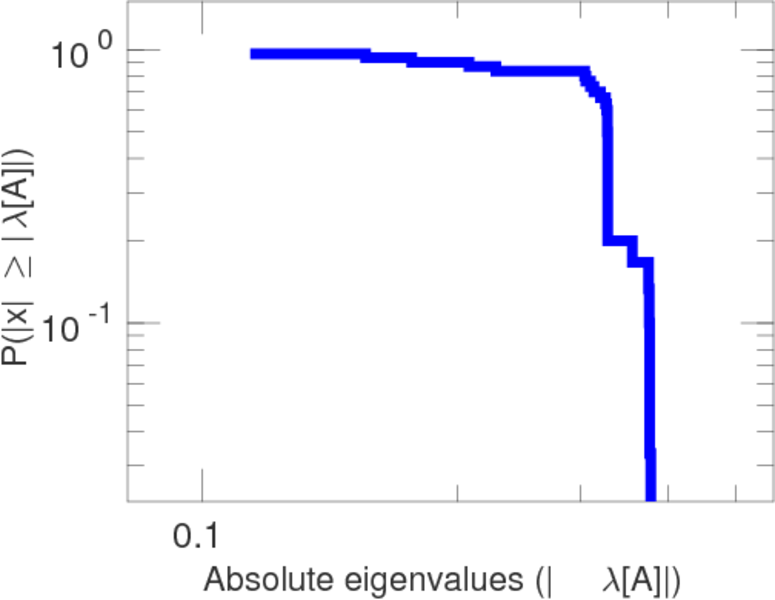
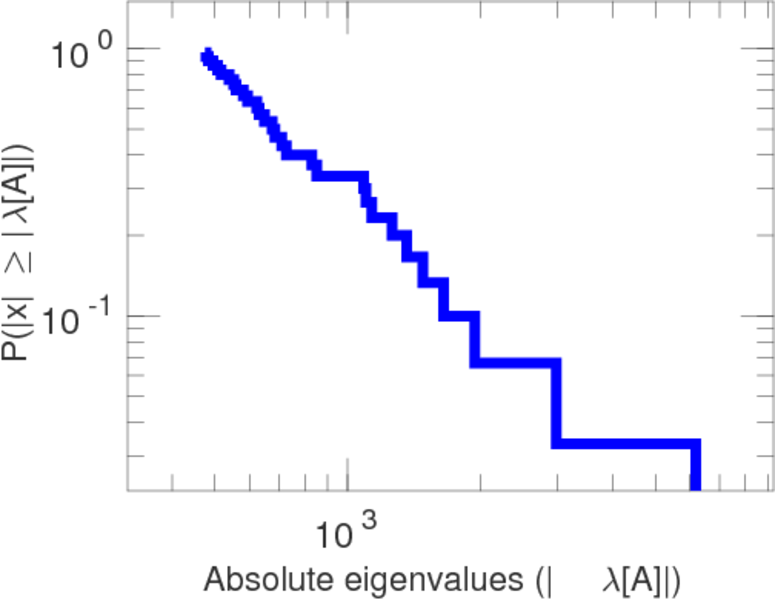
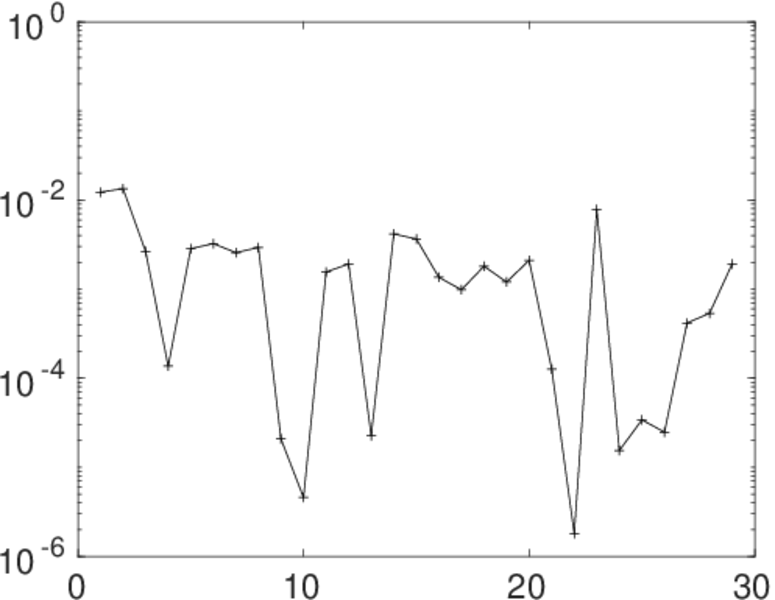
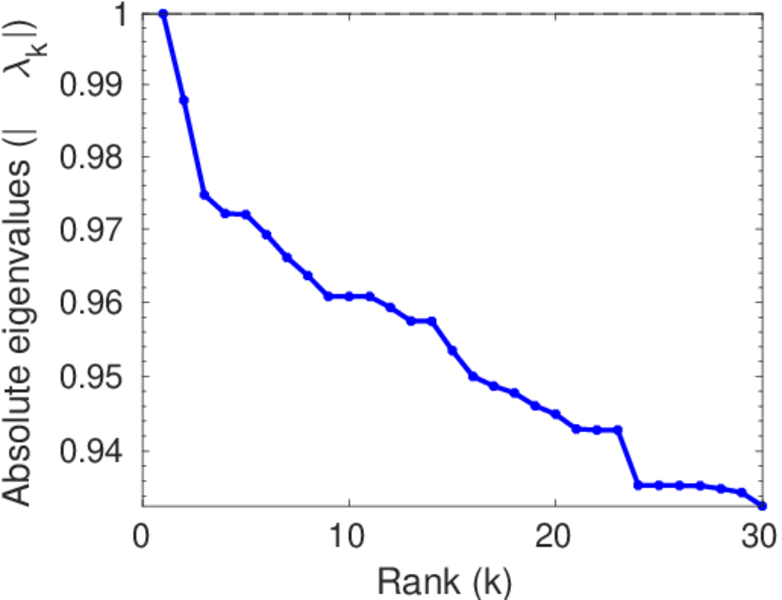
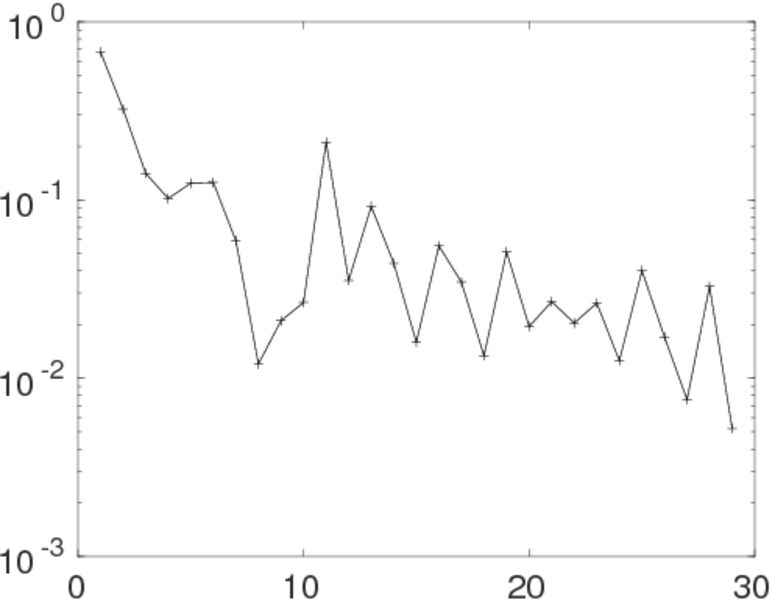
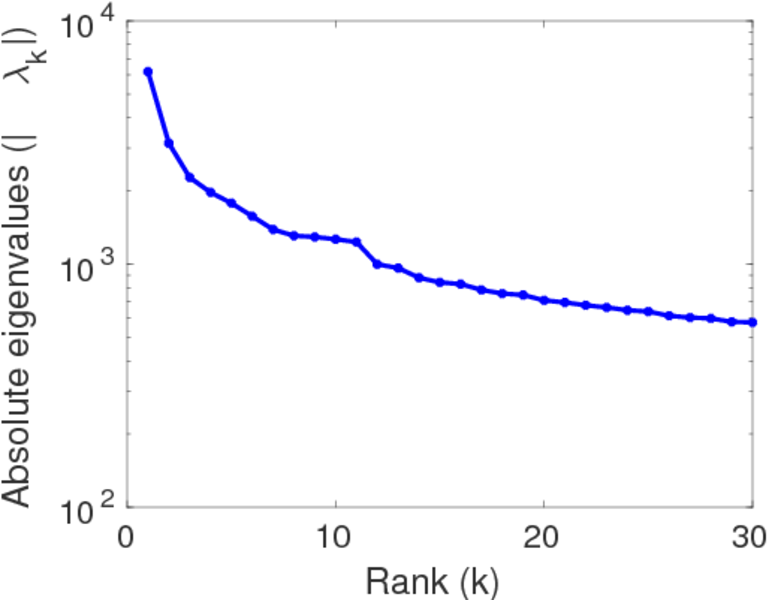
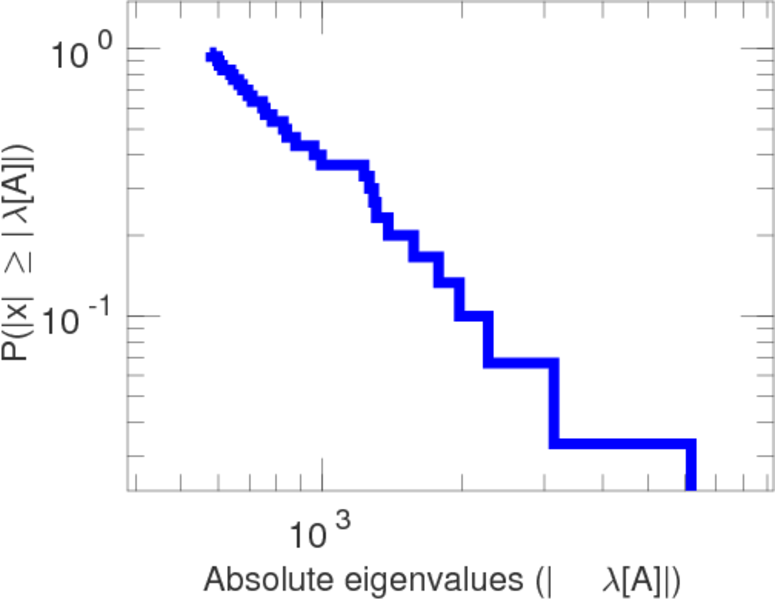
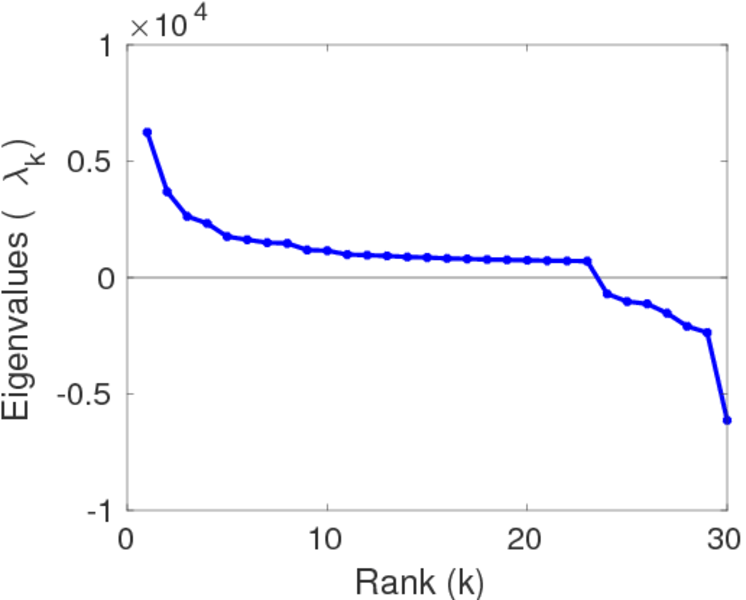
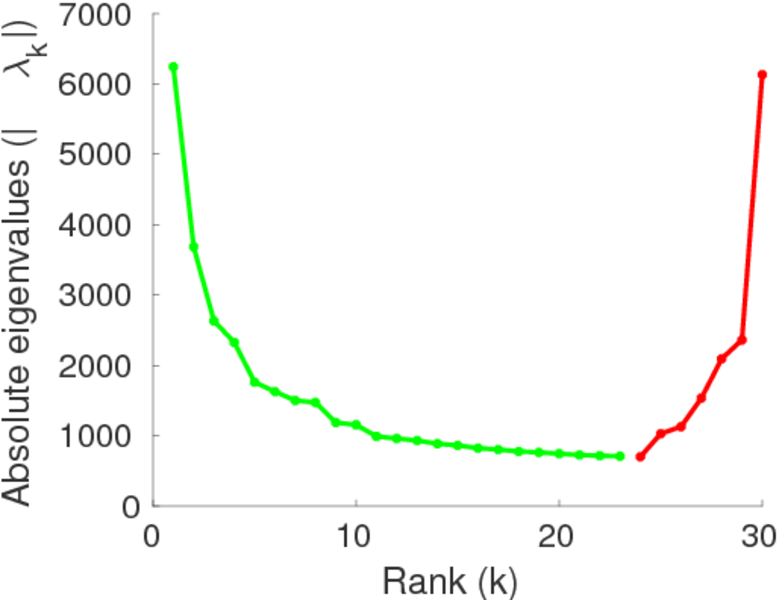
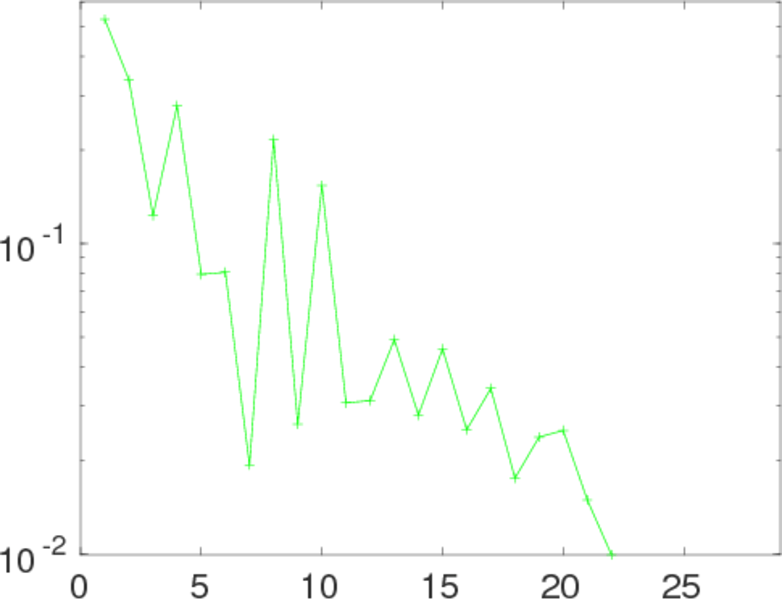
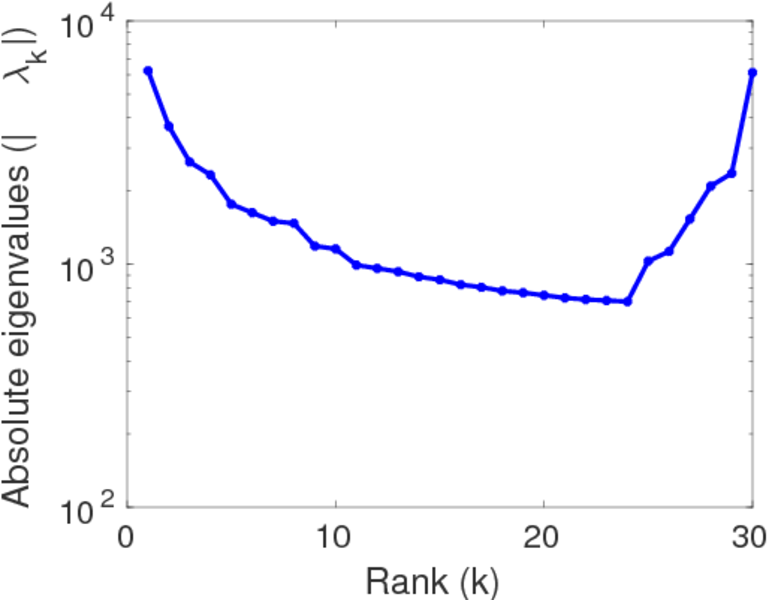
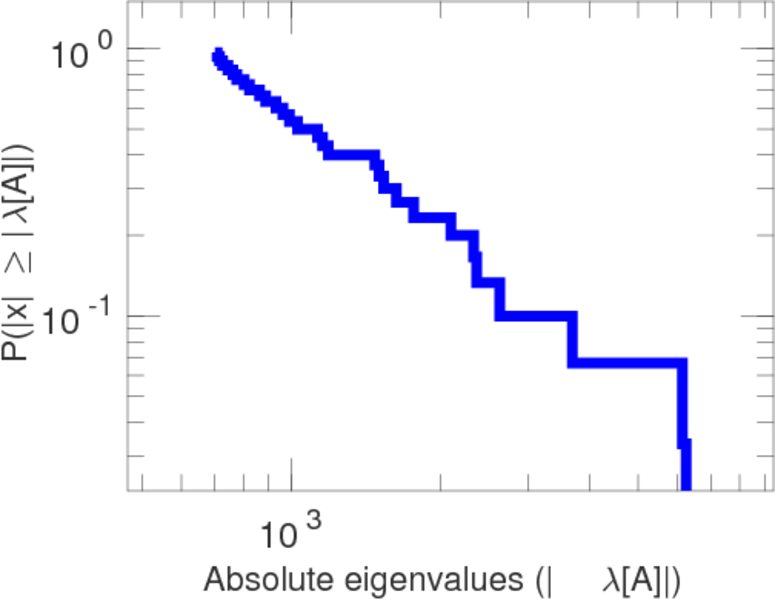
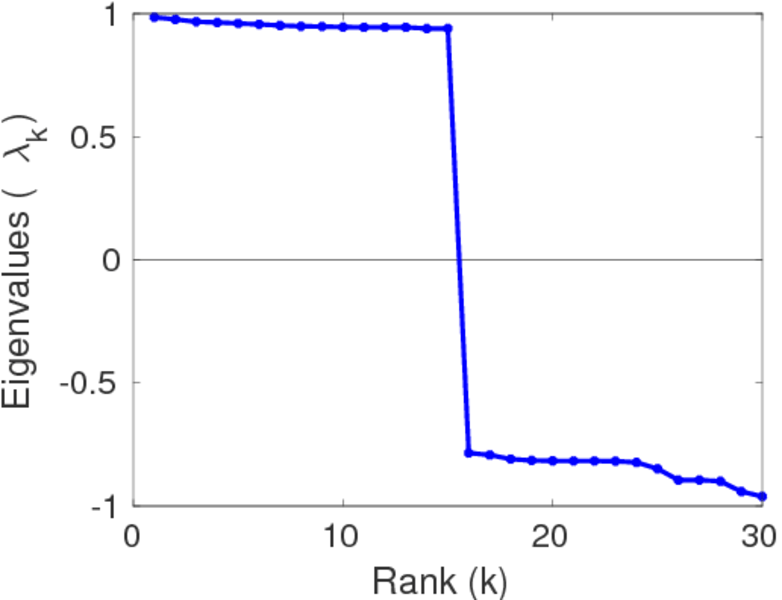
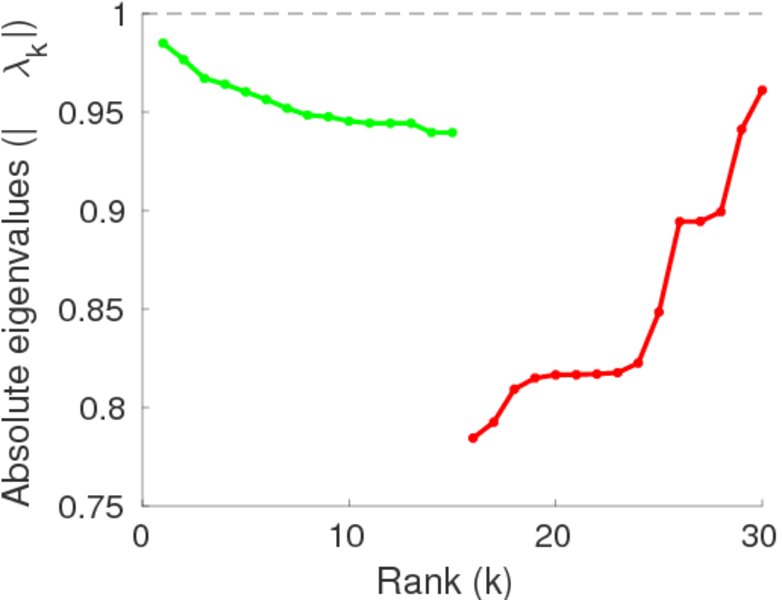
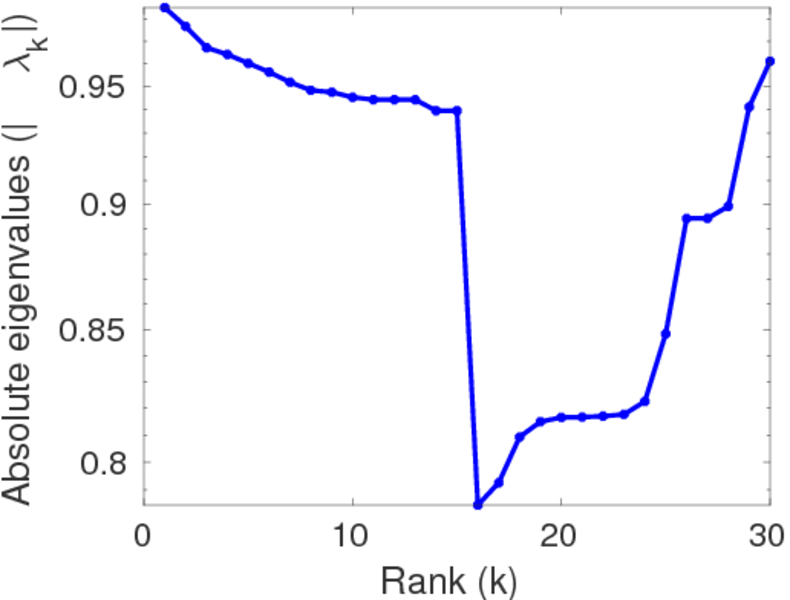
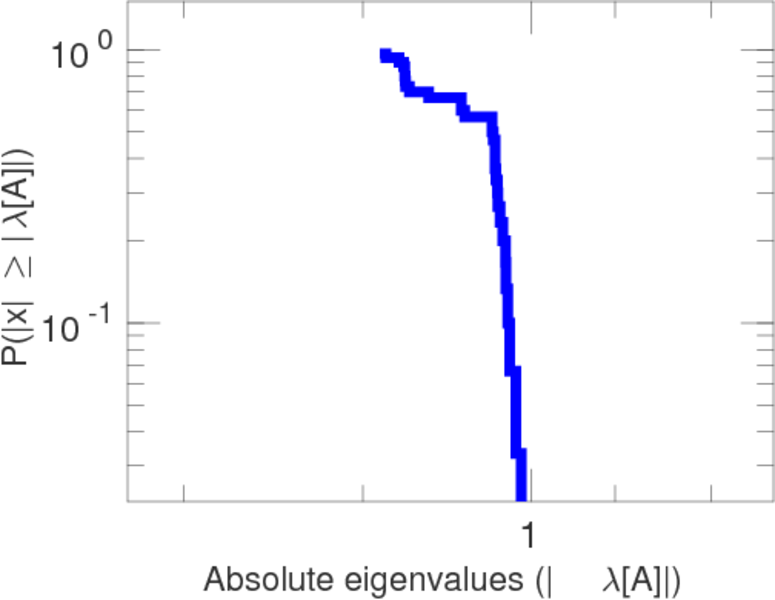
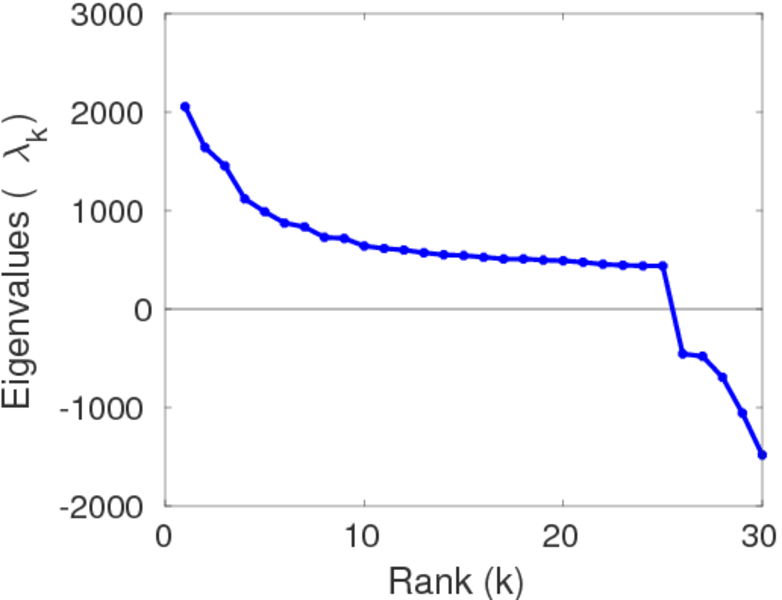
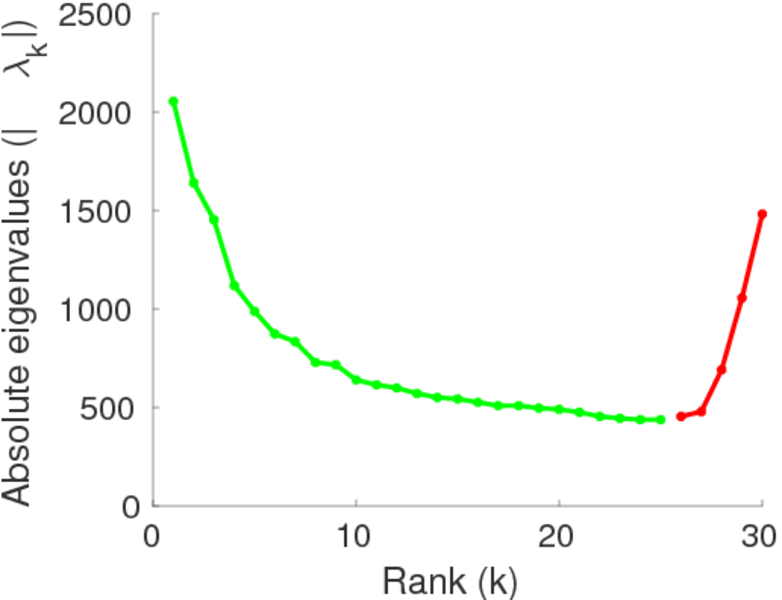
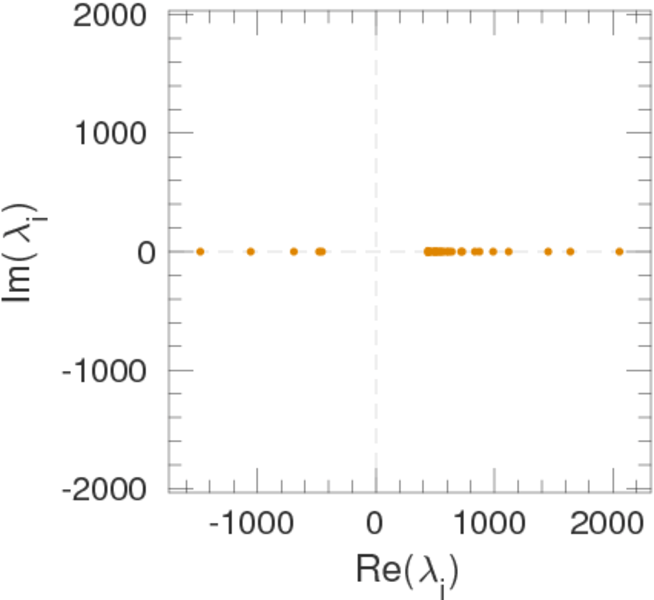
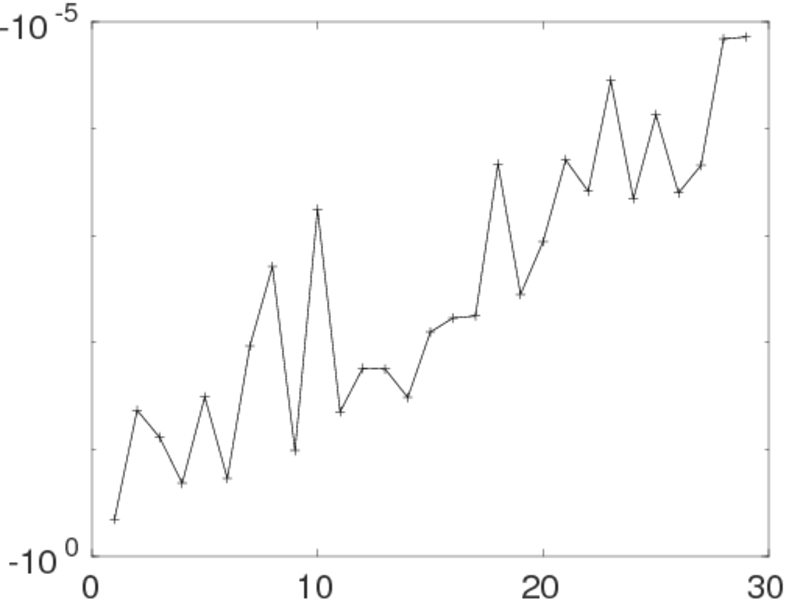
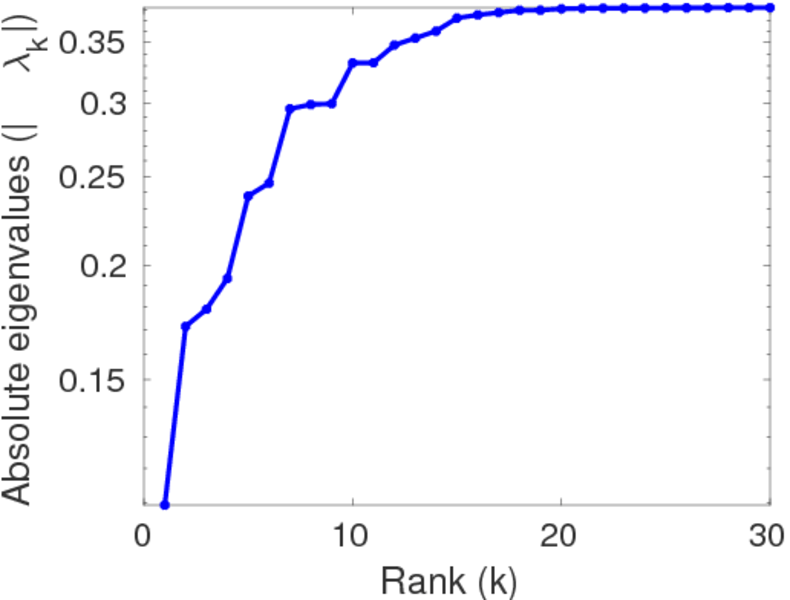
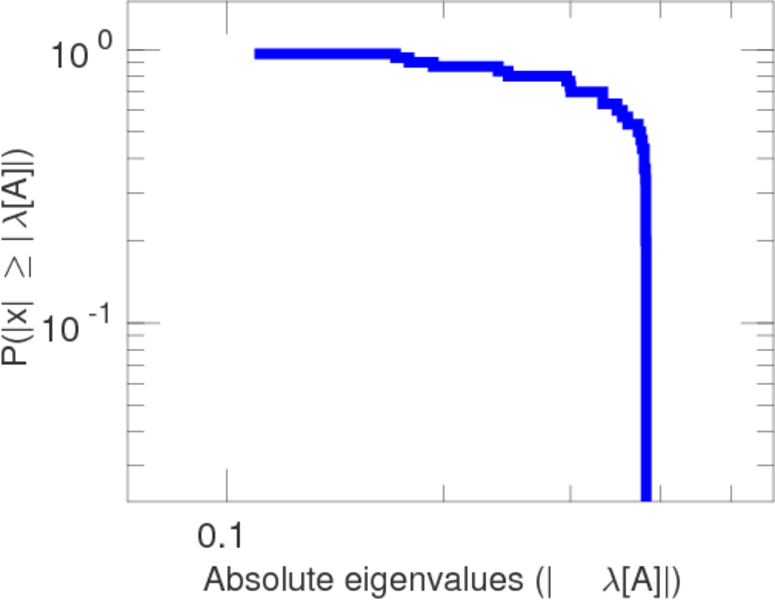
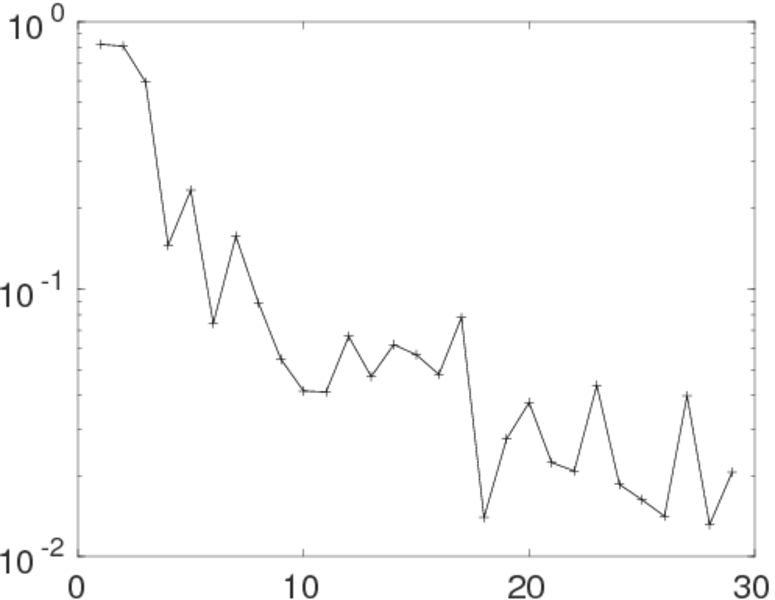
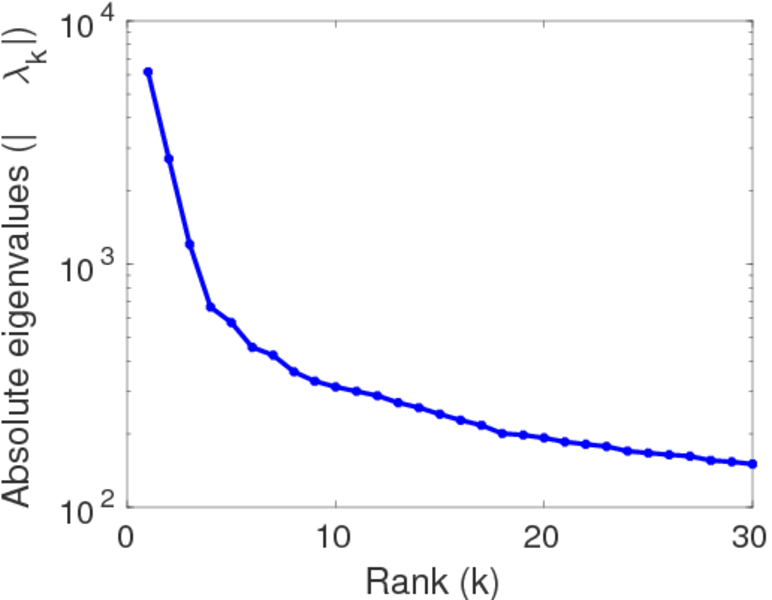
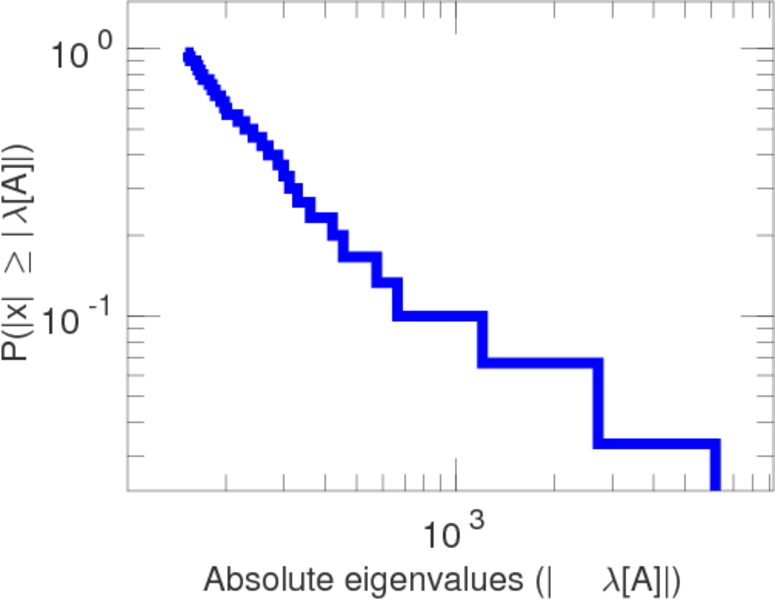
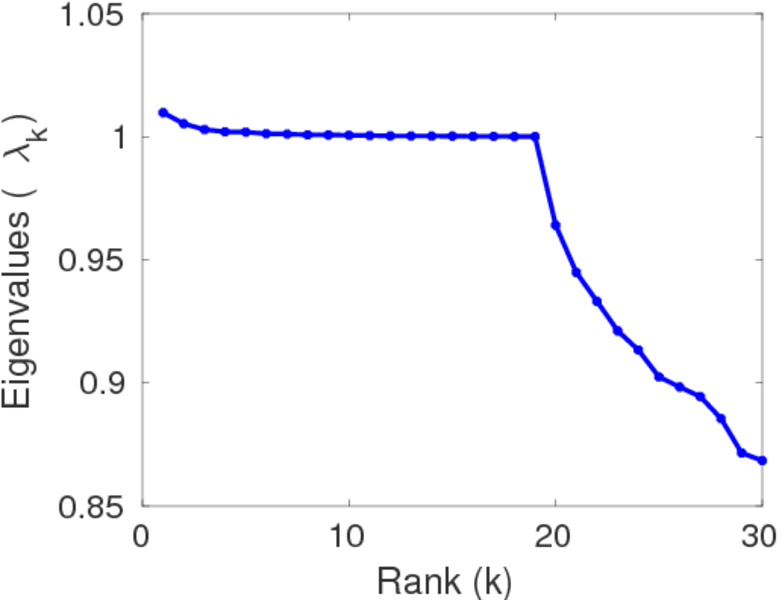
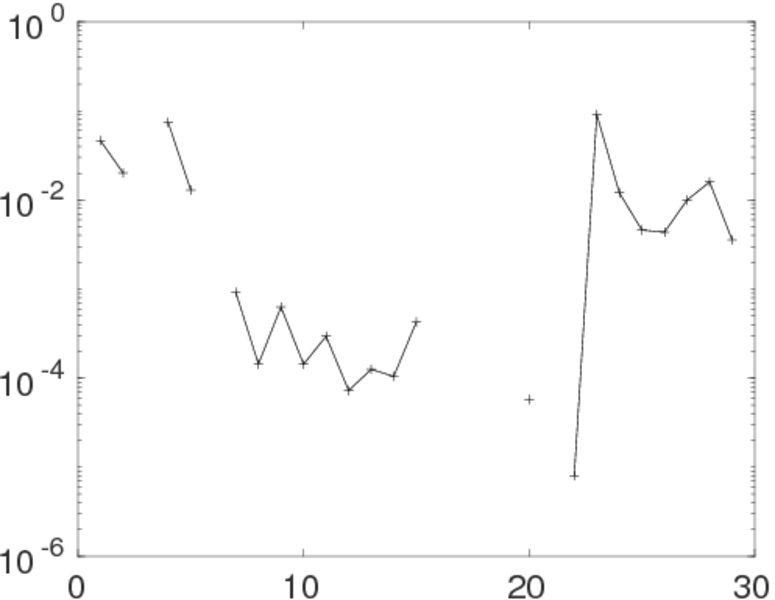
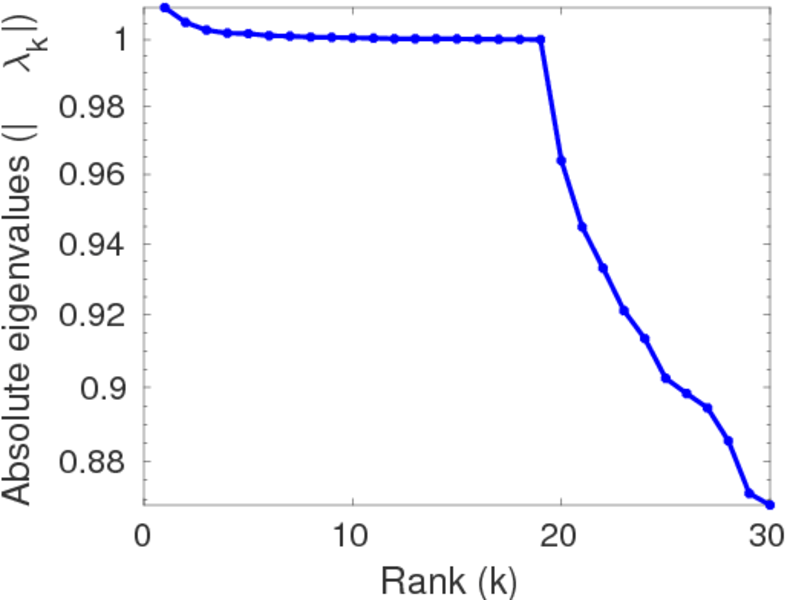
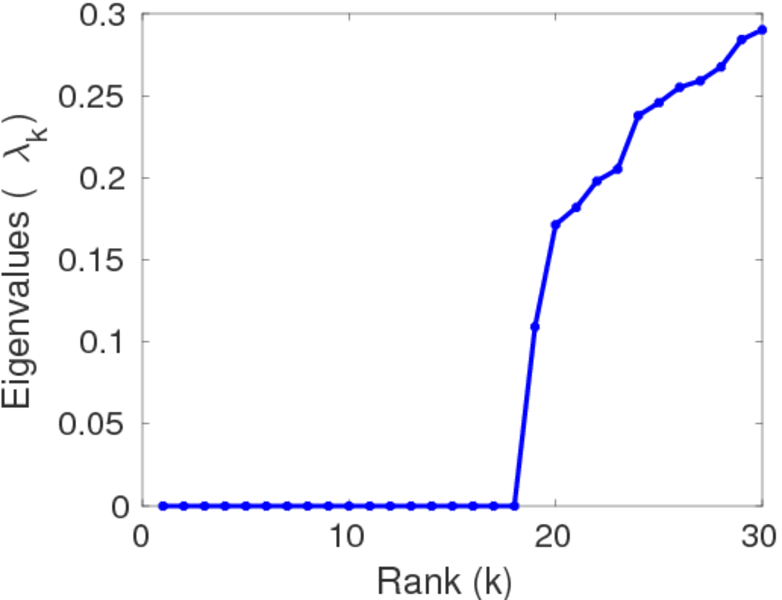
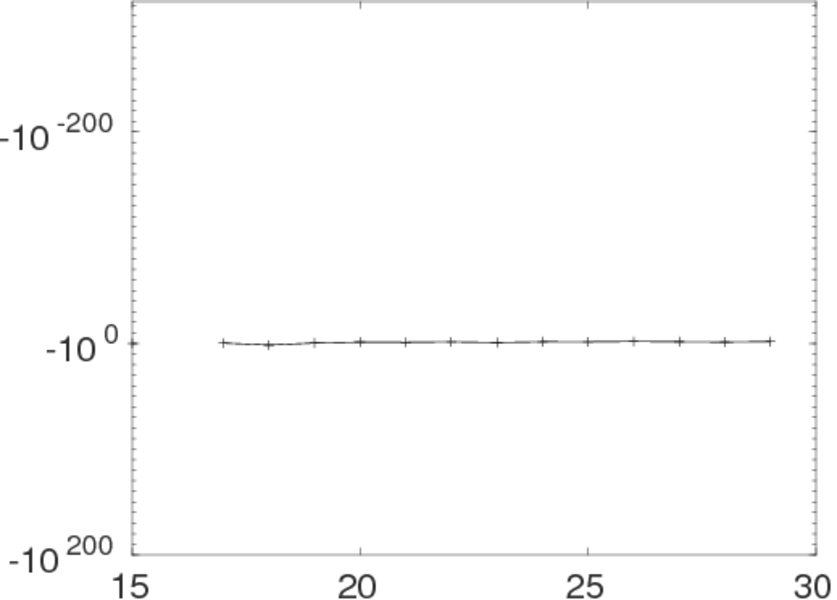
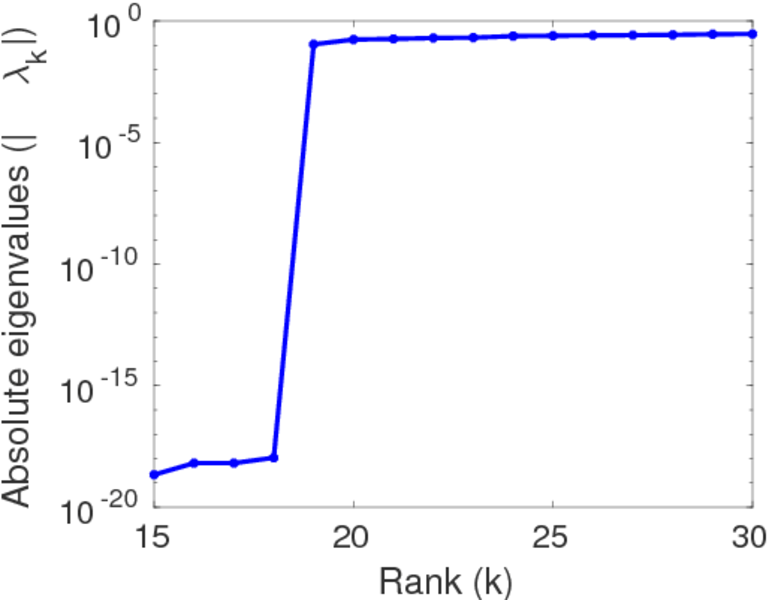
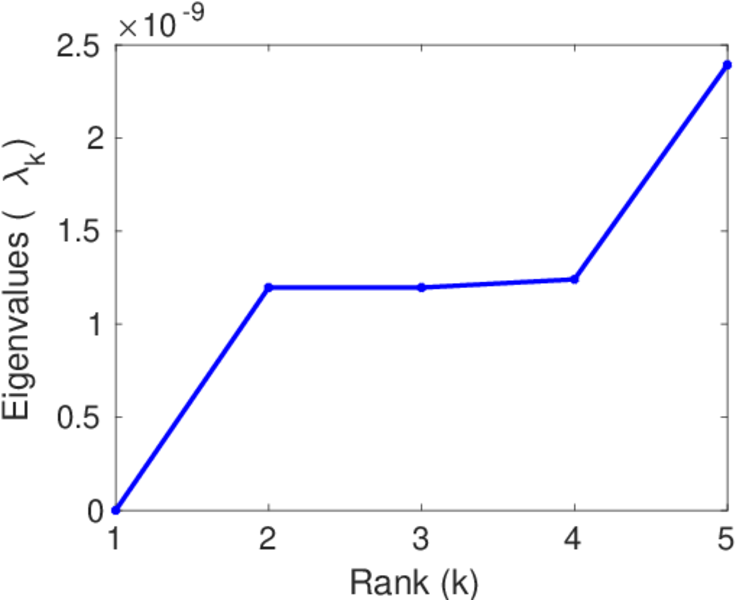
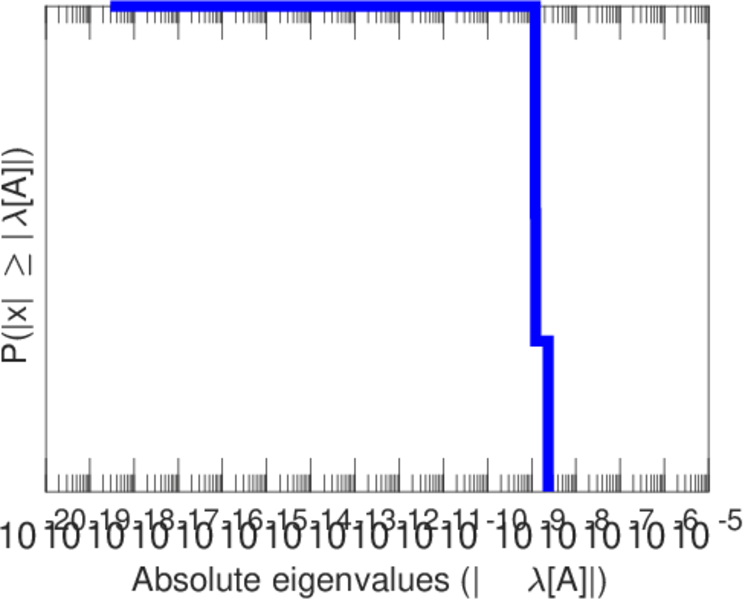
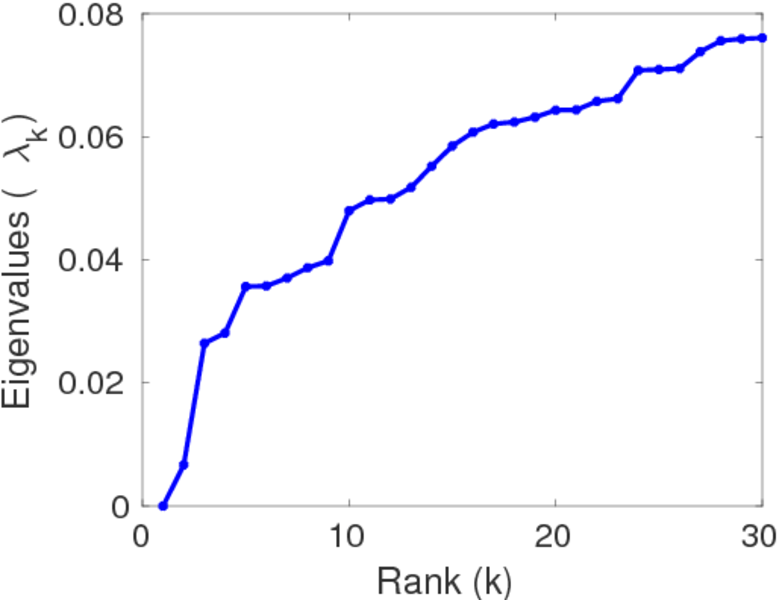
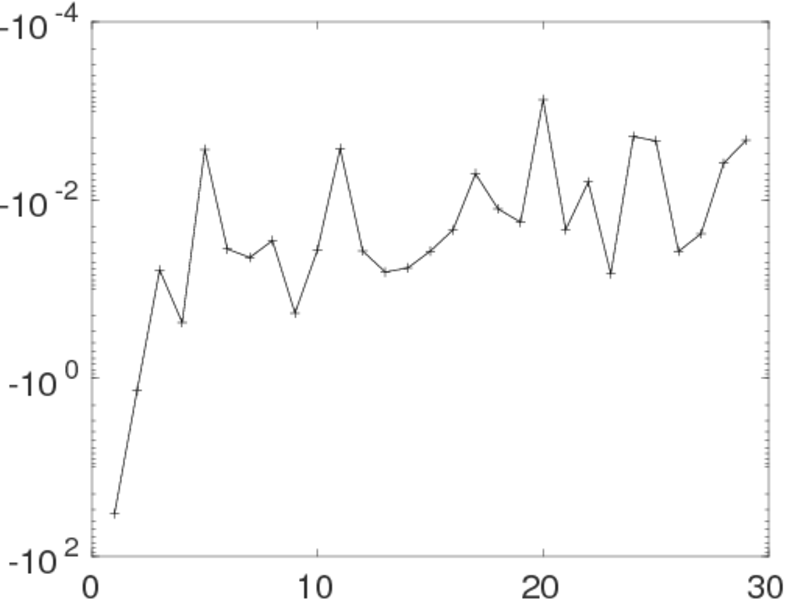
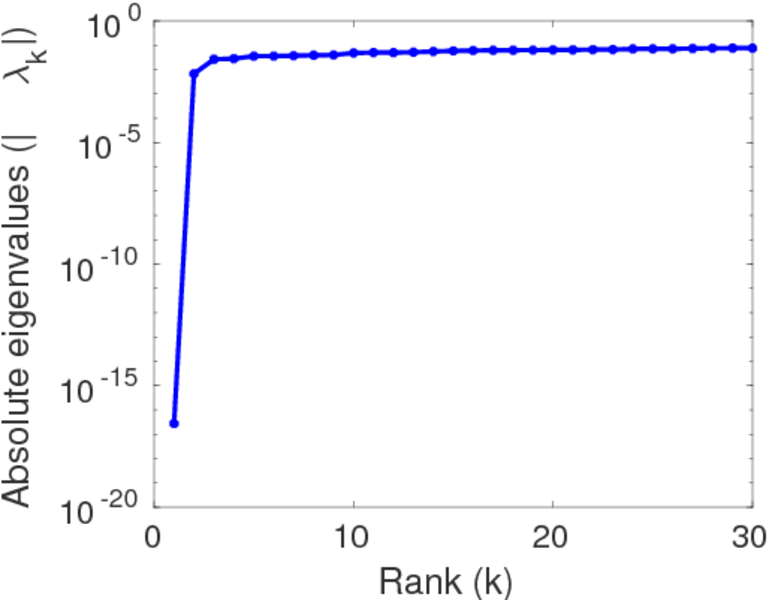
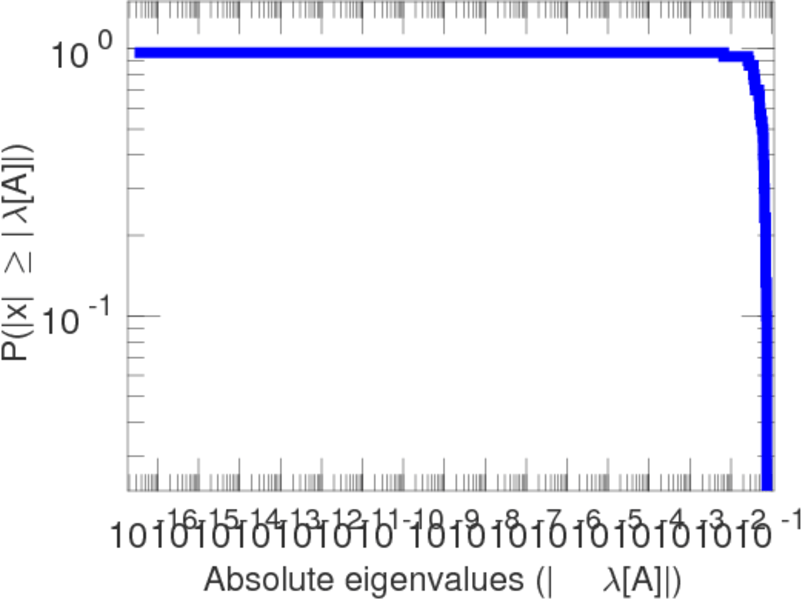
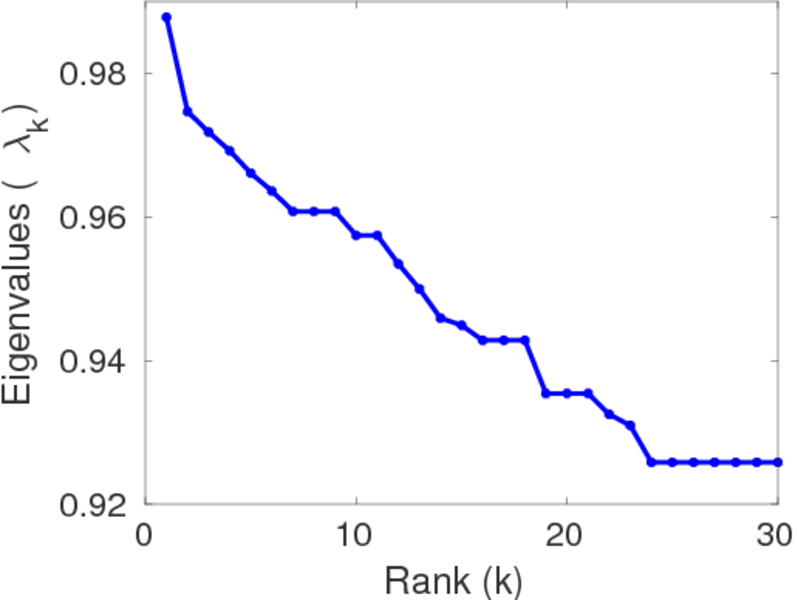
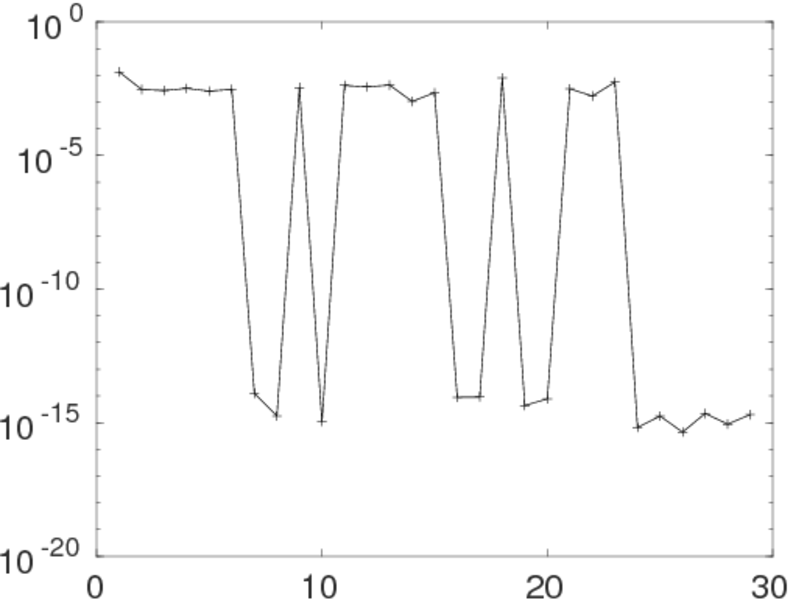
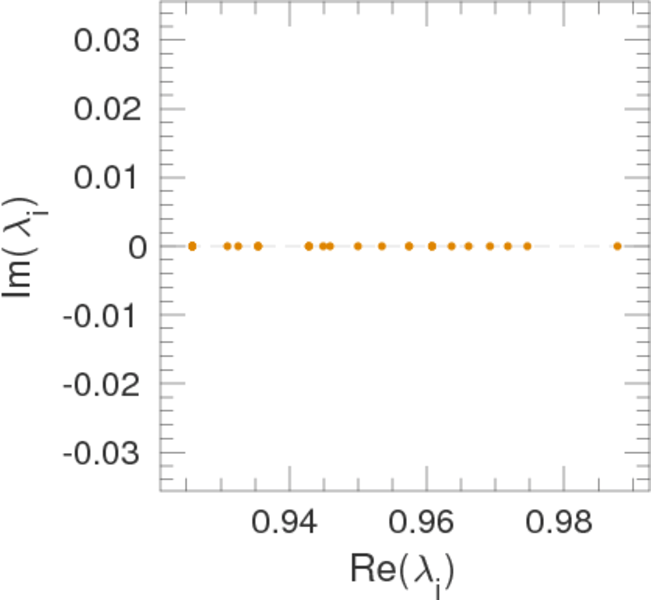
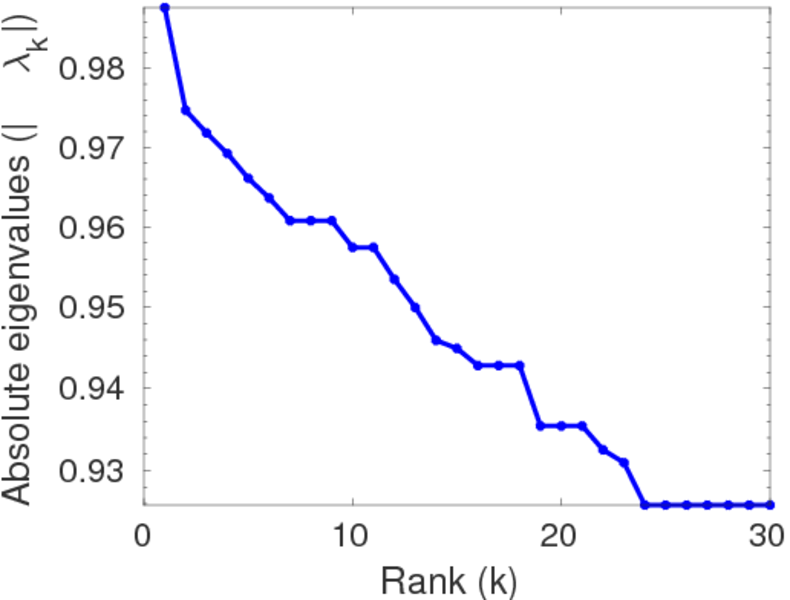
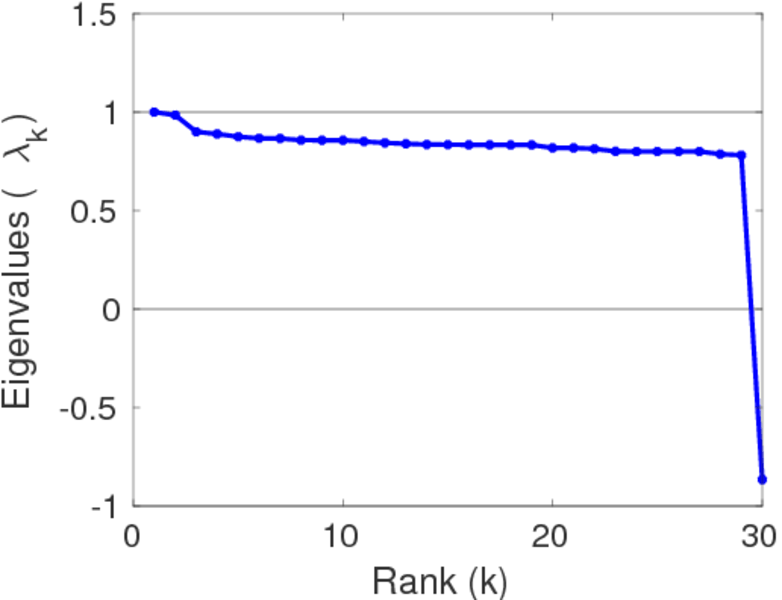
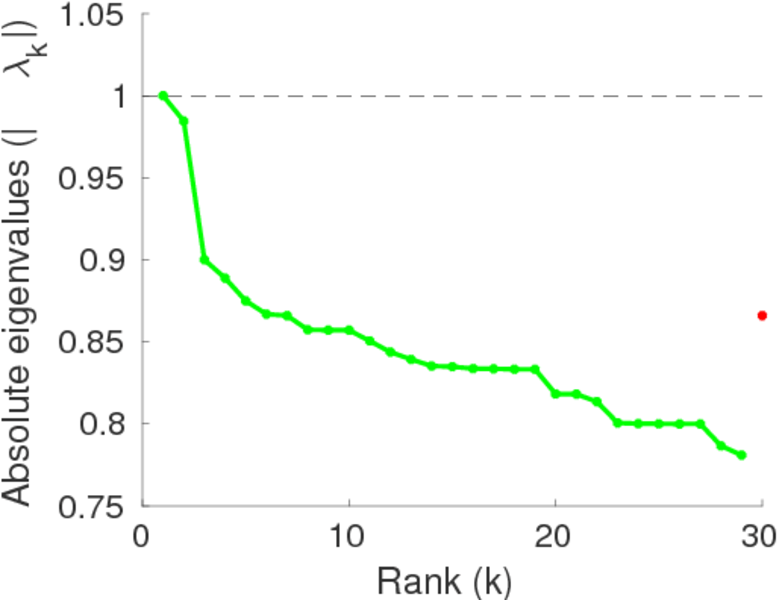
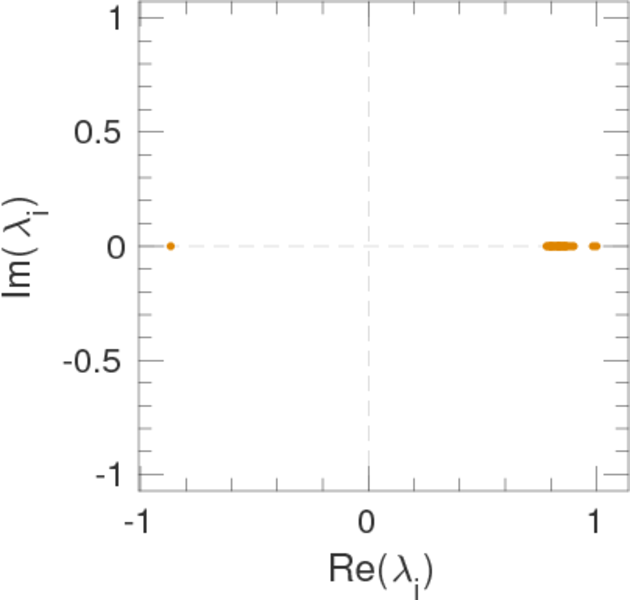
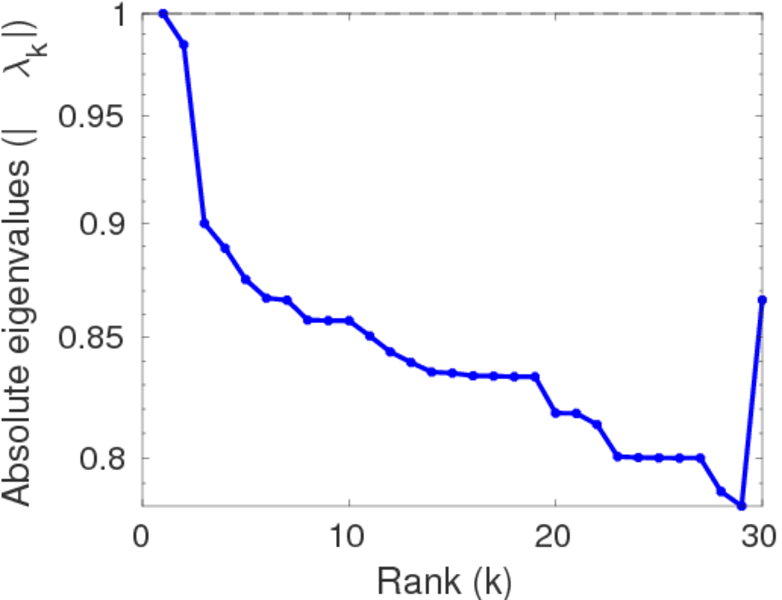
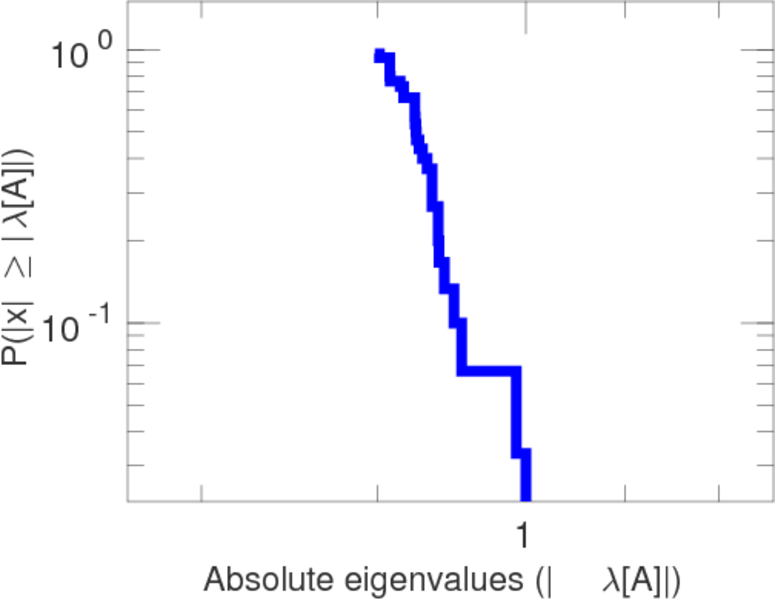
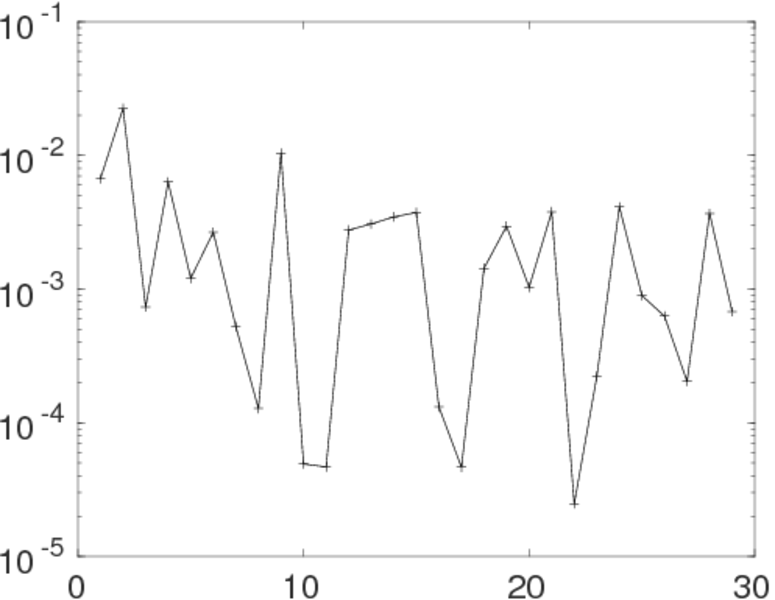
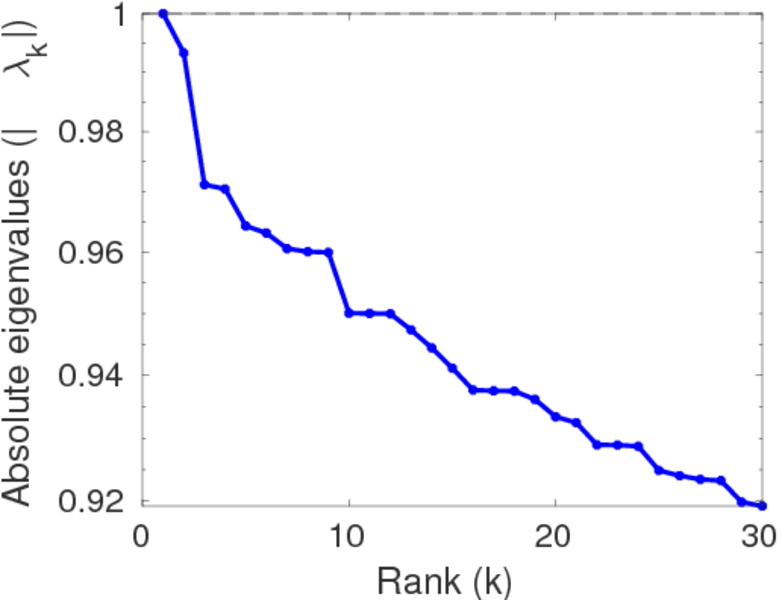
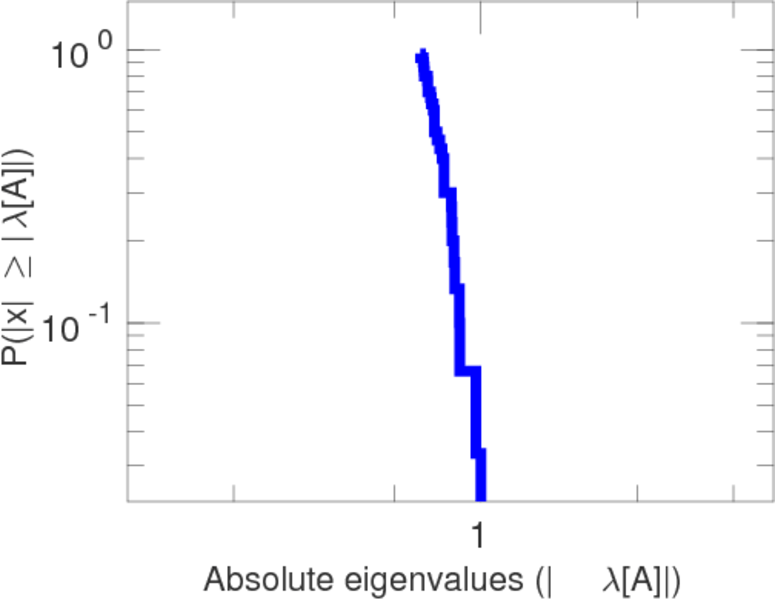
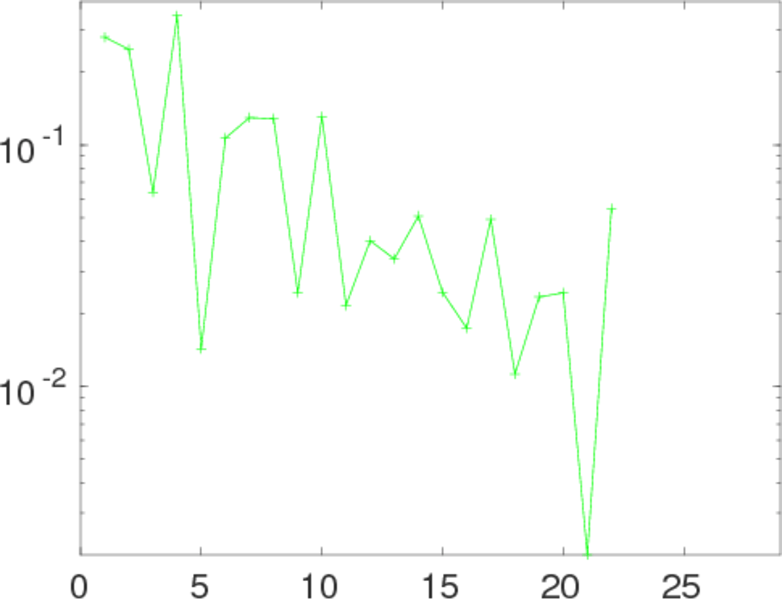
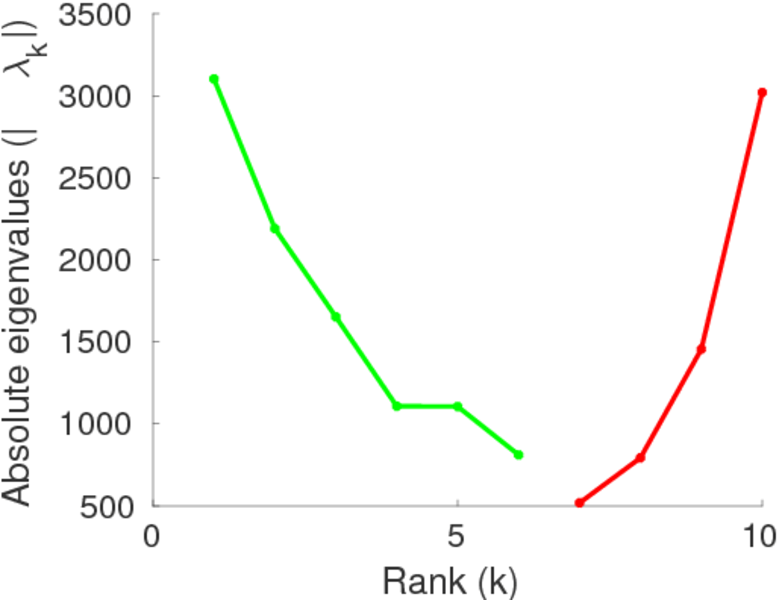
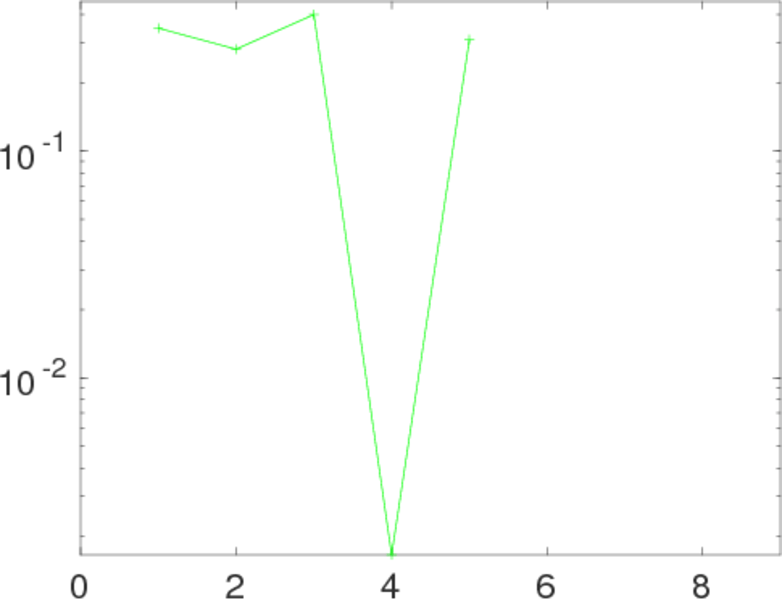
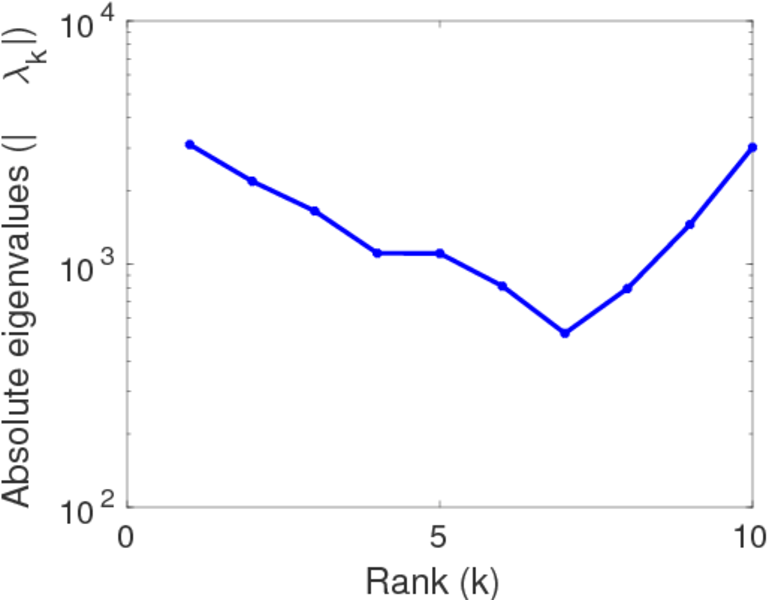
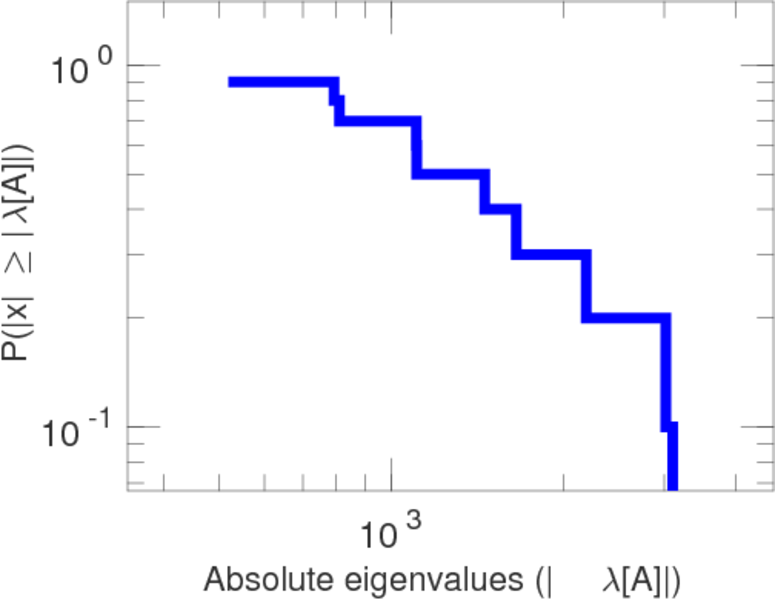
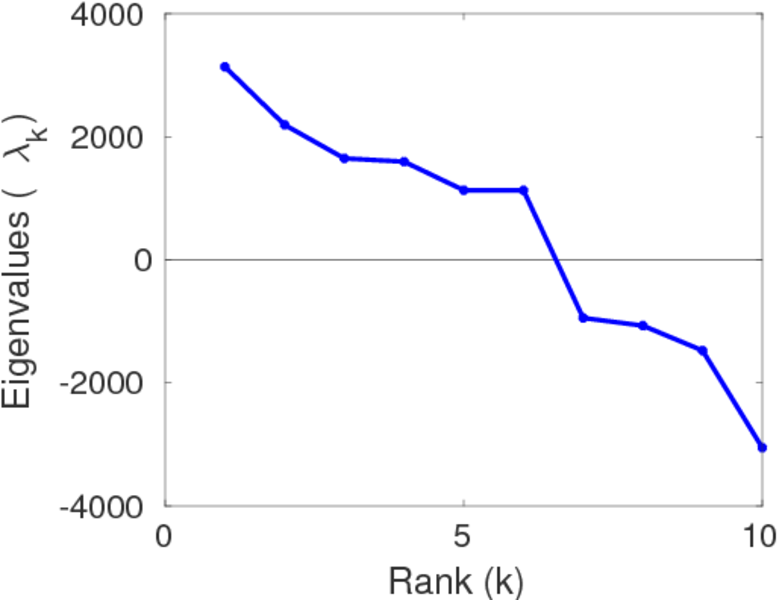
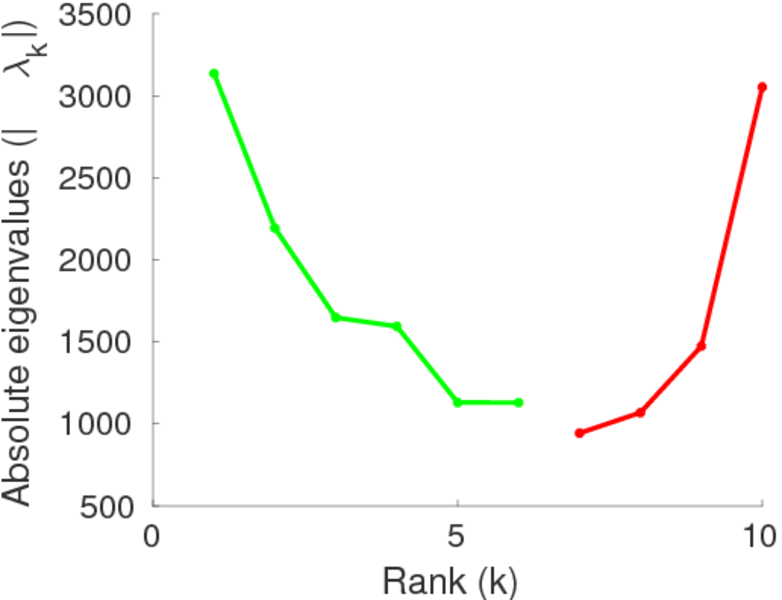
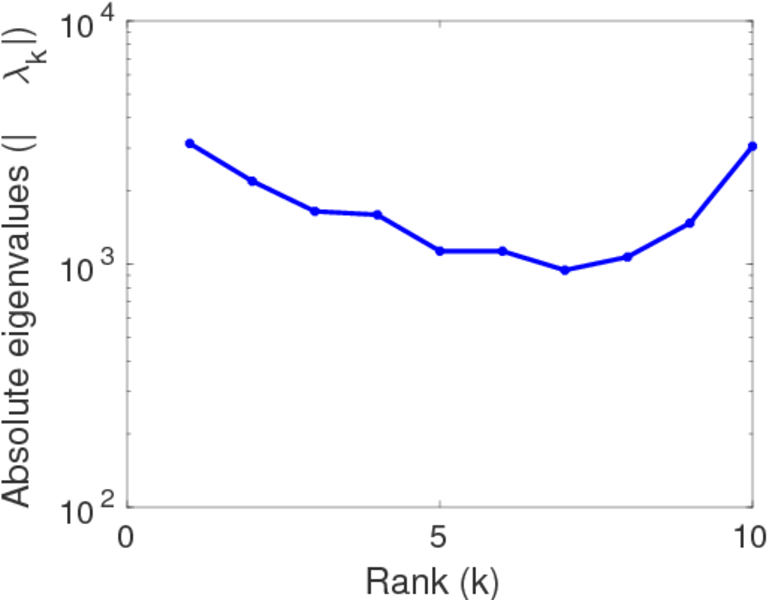
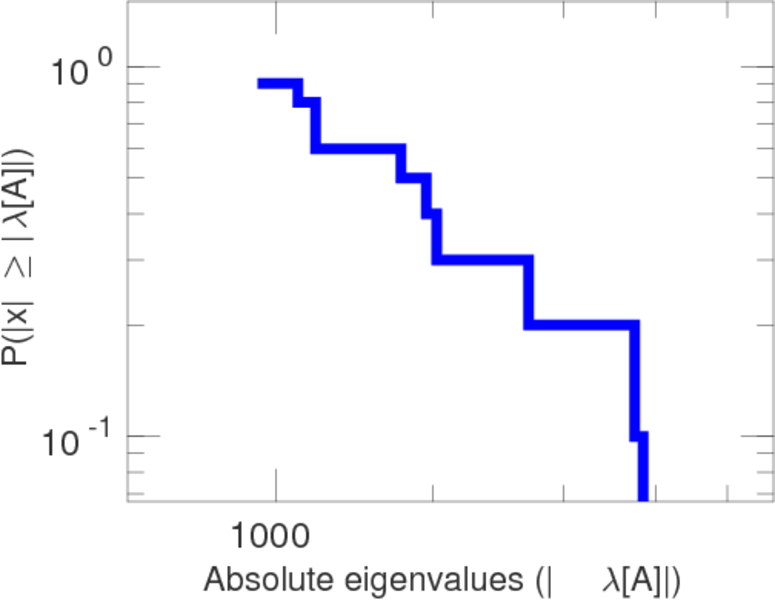
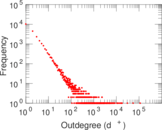
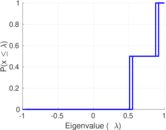
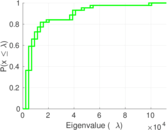
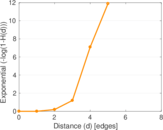
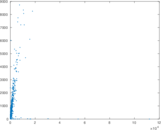
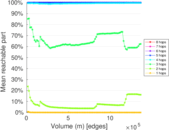
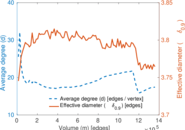
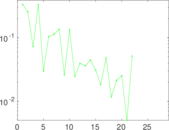
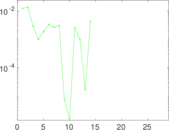
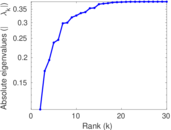
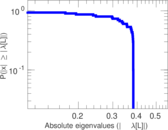
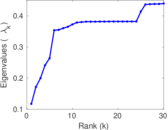
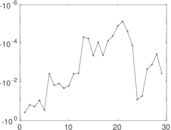
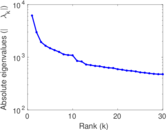
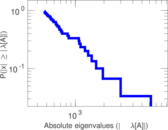
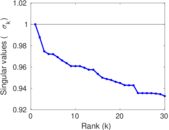
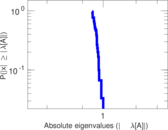
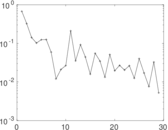
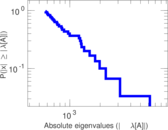
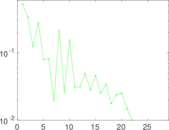
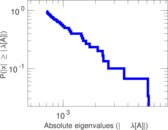
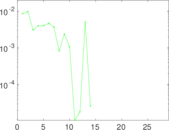
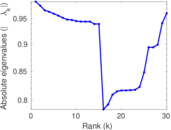
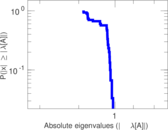
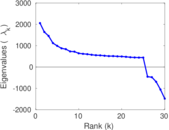
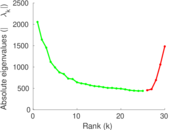
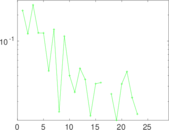
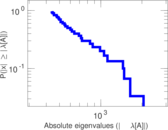
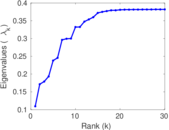
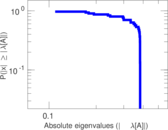
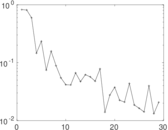
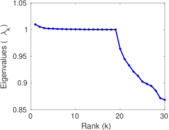
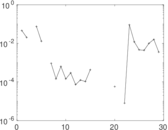
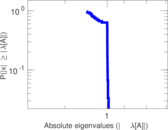
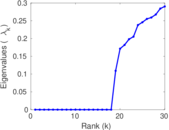
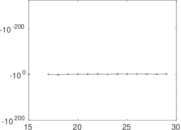
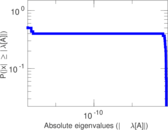
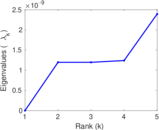
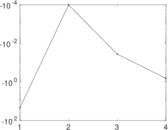
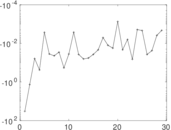
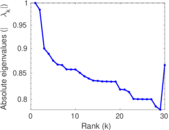
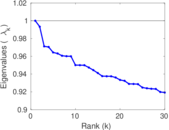
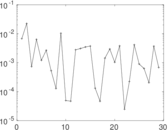
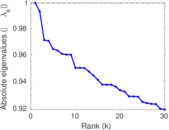
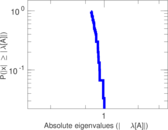
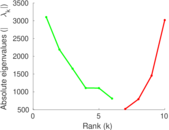
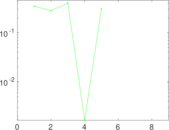
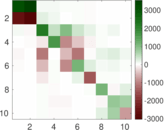
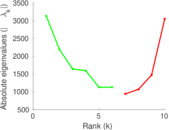
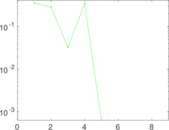
Plots


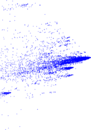
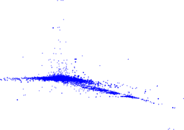


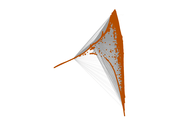
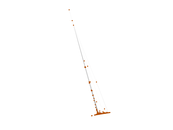


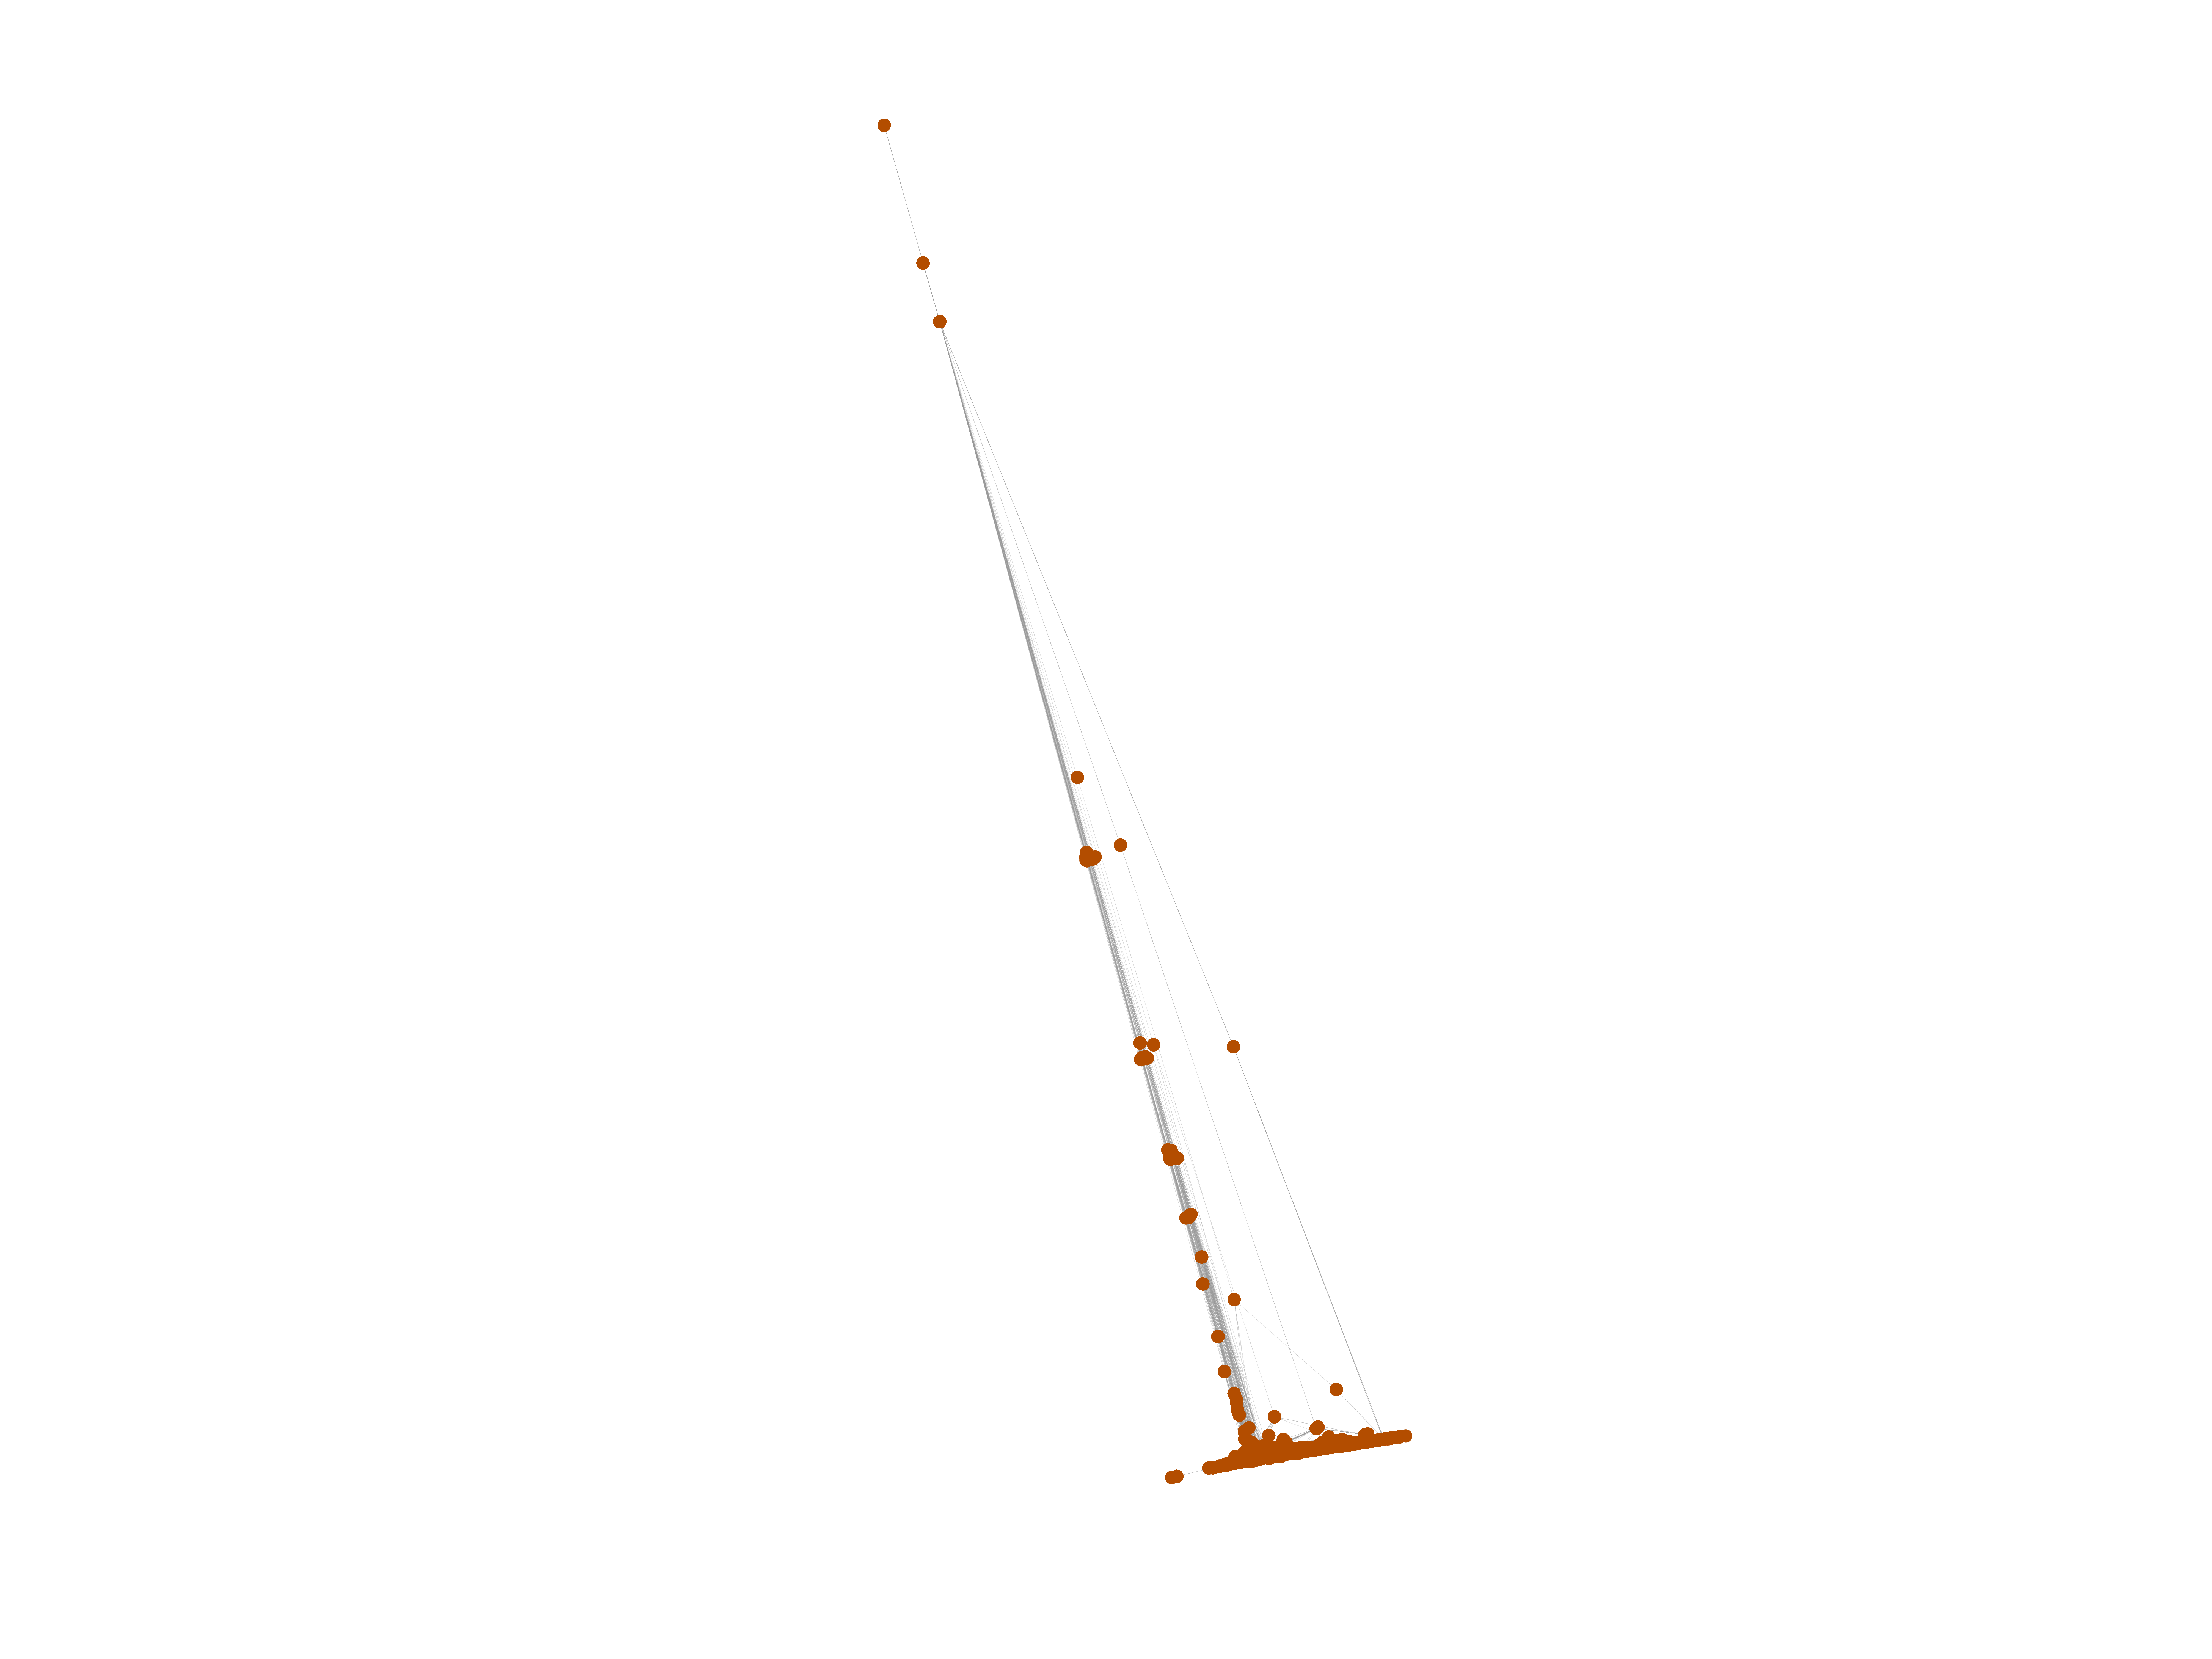
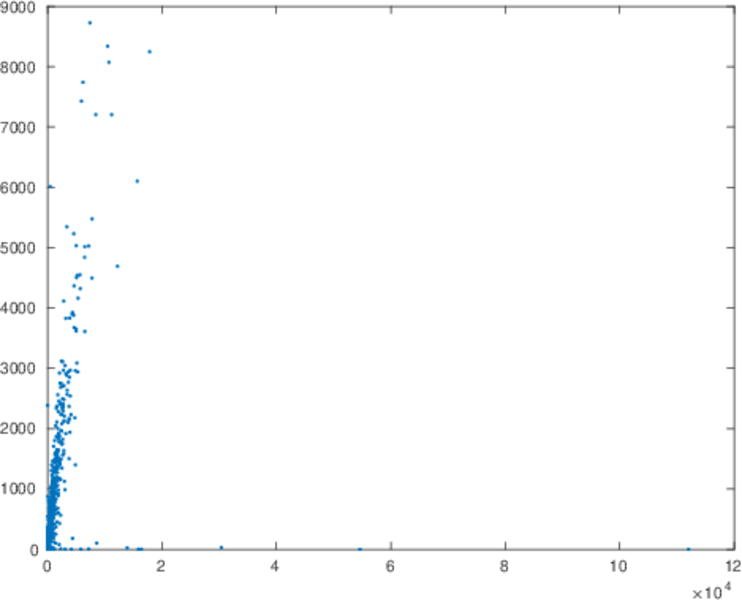
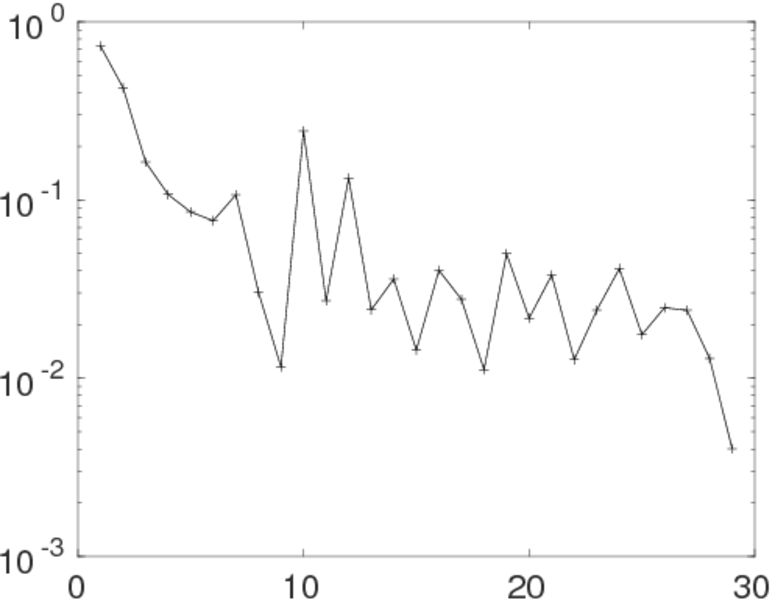
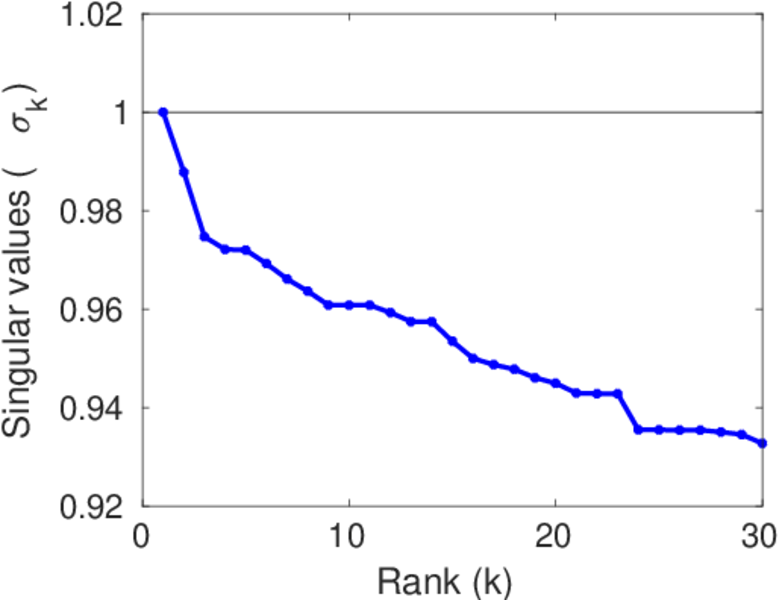
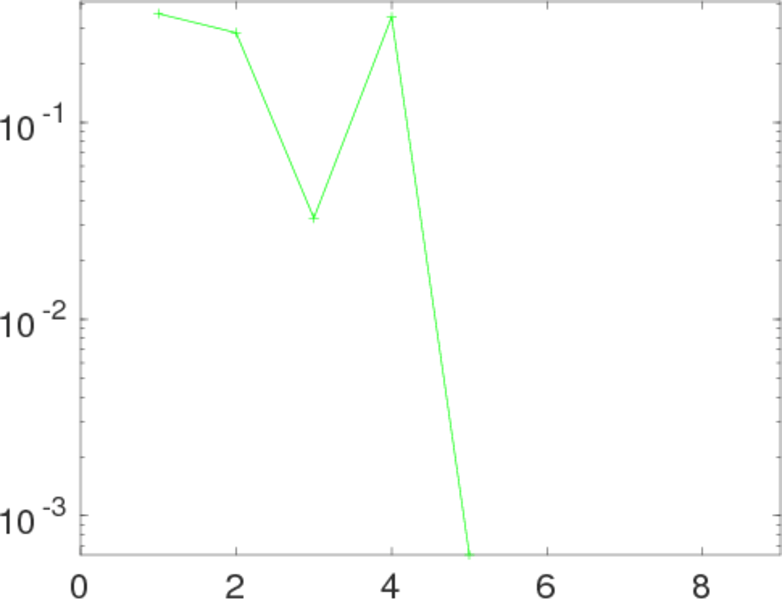
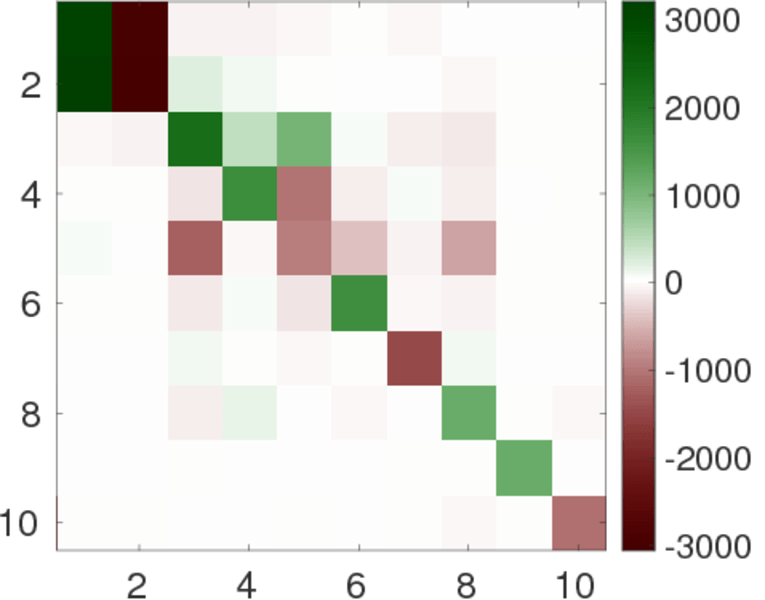
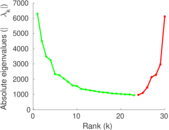
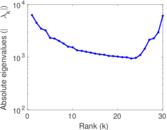
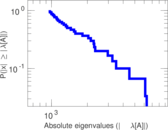
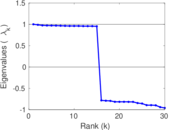
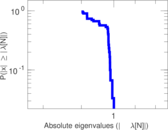
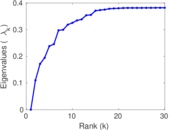
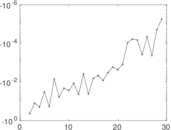
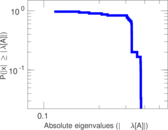
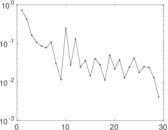
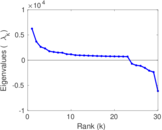
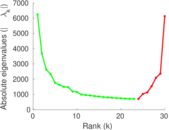
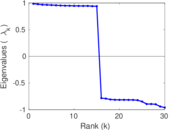
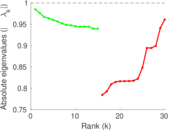
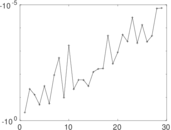
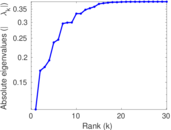
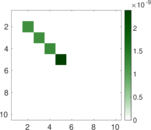
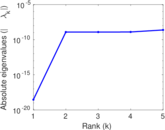
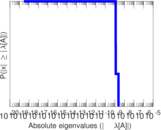
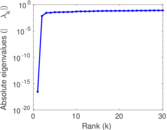
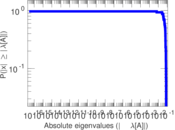
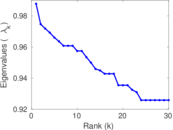
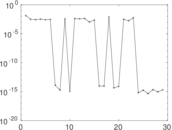
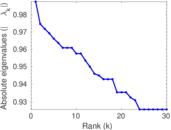
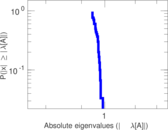
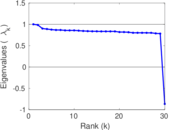
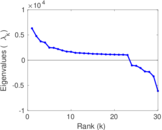
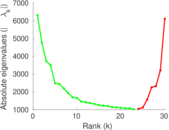
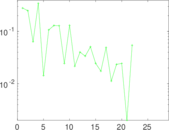
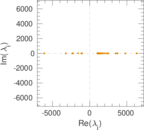
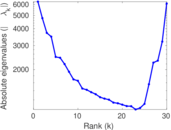
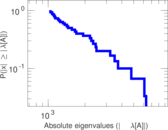
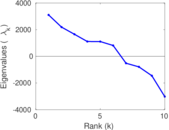
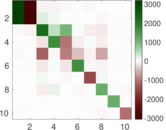
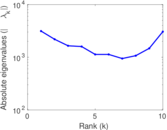
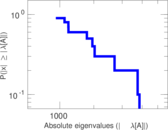
Matrix decompositions plots


Downloads
References
|
[1]
|
Jérôme Kunegis.
KONECT – The Koblenz Network Collection.
In Proc. Int. Conf. on World Wide Web Companion, pages
1343–1350, 2013.
[ http ]
|
|
[2]
|
Jun Sun, Jérôme Kunegis, and Steffen Staab.
Predicting user roles in social networks using transfer learning with
feature transformation.
In Proc. ICDM Workshop on Data Min. in Netw., 2016.
|
 KONECT ‣ Networks ‣
Buy Me a Coffee
KONECT ‣ Networks ‣
Buy Me a Coffee