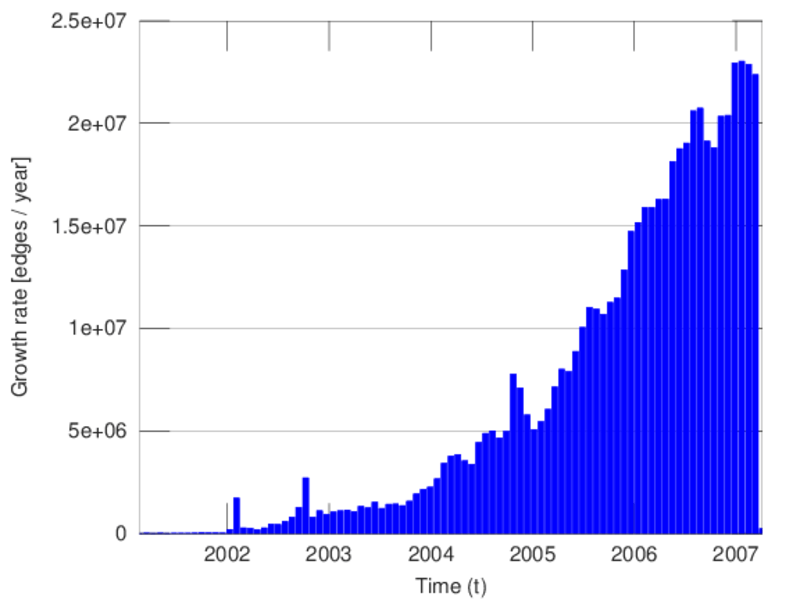
Wikipedia growth (en)
This is the hyperlink network of the English Wikipedia with edge arrival times.
Metadata
Statistics
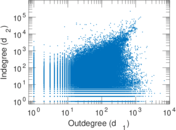
| Size | n = | 1,870,709
|
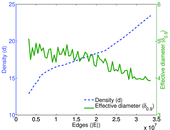
| Volume | m = | 39,953,145
|
| Loop count | l = | 0
|
| Wedge count | s = | 122,966,873,340
|
| Claw count | z = | 3,206,375,666,919,400
|
| Cross count | x = | 1.291 74 × 1020
|
| Triangle count | t = | 126,619,350
|
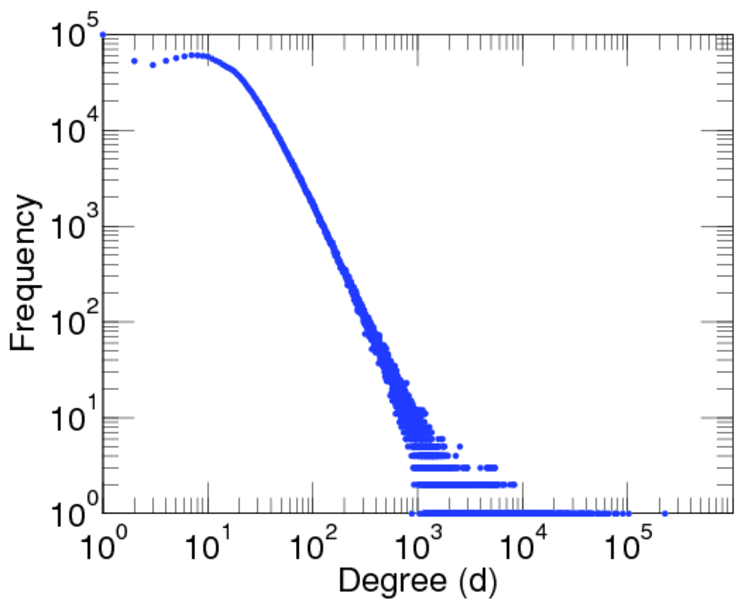
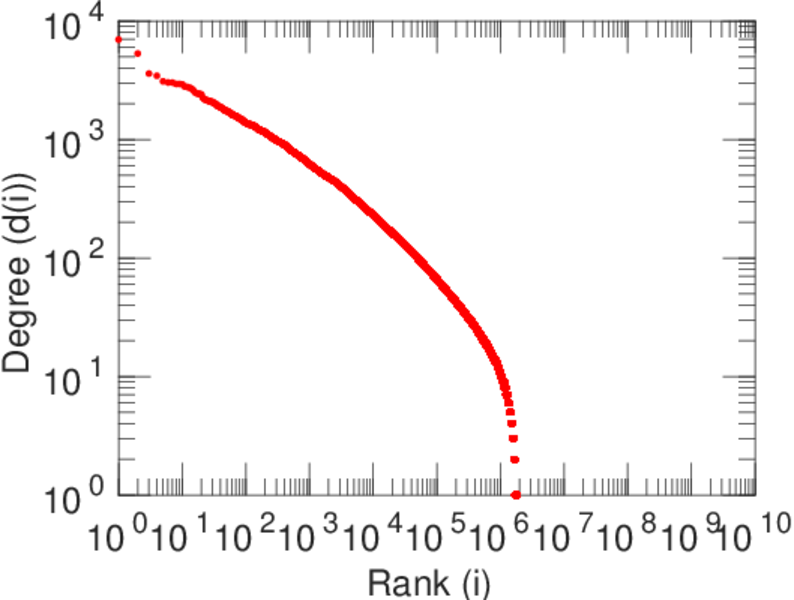
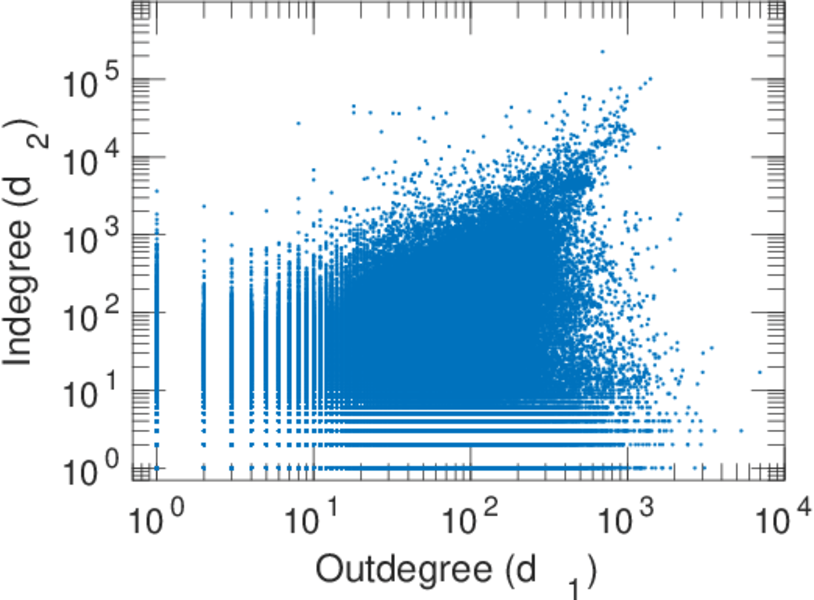
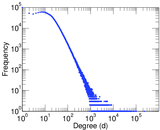
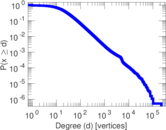
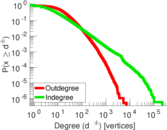
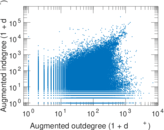
| Maximum degree | dmax = | 226,577
|
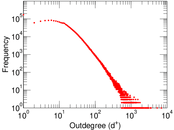
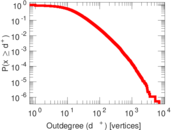
| Maximum outdegree | d+max = | 6,975
|
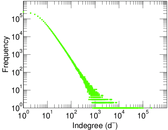
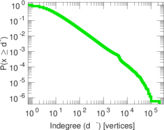
| Maximum indegree | d−max = | 225,883
|
| Average degree | d = | 42.714 4
|
| Fill | p = | 1.141 67 × 10−5
|
| Size of LCC | N = | 1,870,521
|
| Size of LSCC | Ns = | 1,629,321
|
| Relative size of LSCC | Nrs = | 0.870 964
|
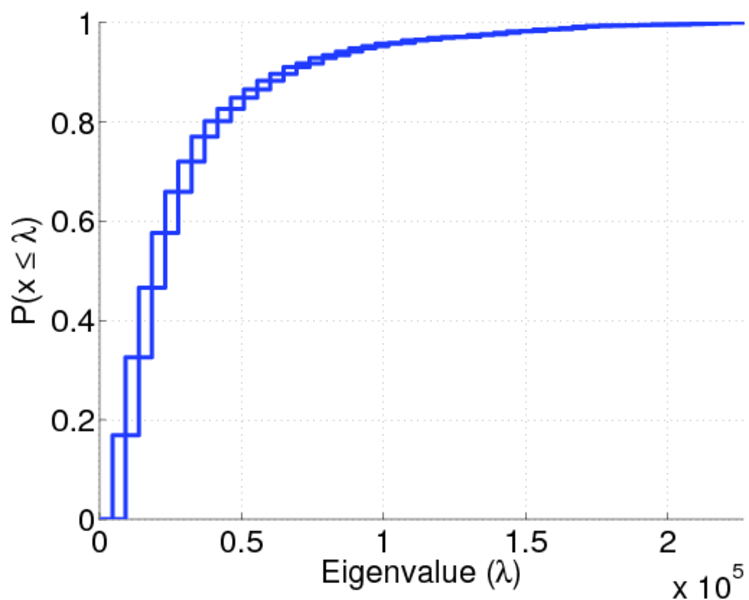
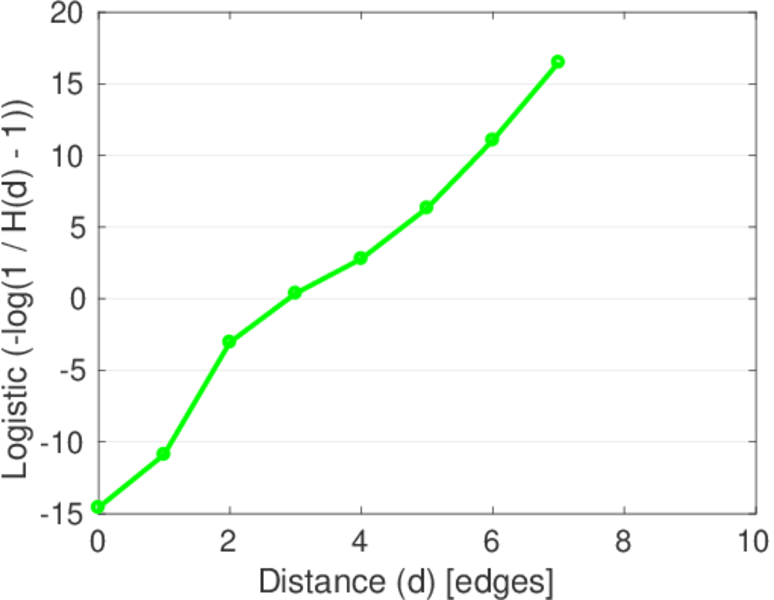
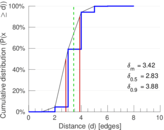
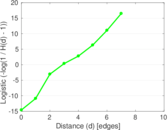
| Diameter | δ = | 10
|
| 50-Percentile effective diameter | δ0.5 = | 2.832 44
|
| 90-Percentile effective diameter | δ0.9 = | 3.880 25
|
| Median distance | δM = | 3
|
| Mean distance | δm = | 3.422 95
|
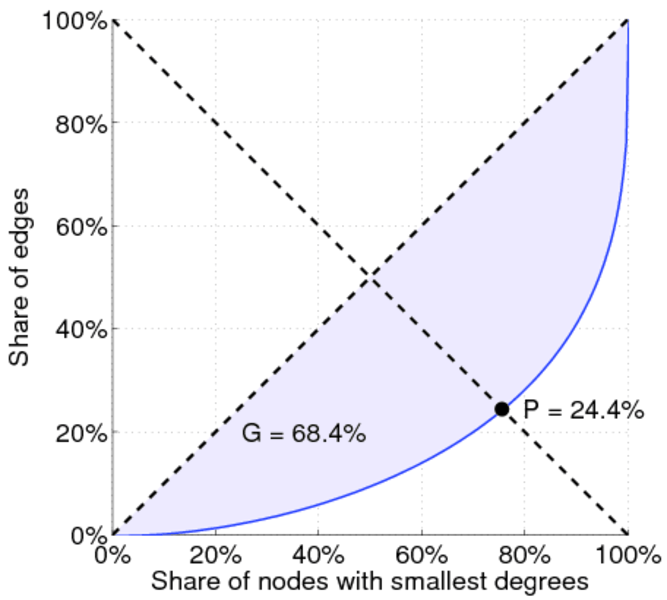
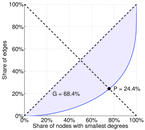
| Gini coefficient | G = | 0.683 700
|
| Balanced inequality ratio | P = | 0.244 004
|
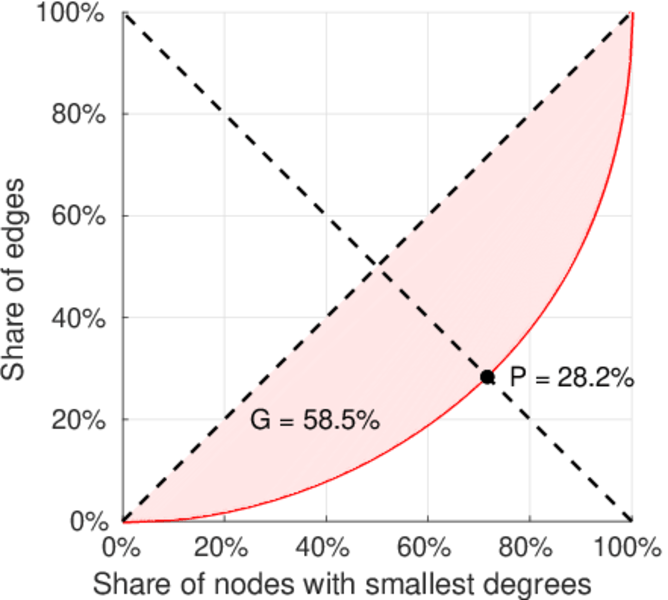
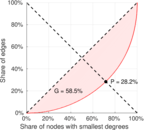
| Outdegree balanced inequality ratio | P+ = | 0.281 987
|
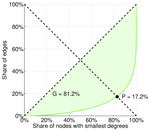
| Indegree balanced inequality ratio | P− = | 0.171 897
|
| Relative edge distribution entropy | Her = | 0.901 960
|
| Power law exponent | γ = | 1.370 51
|
| Tail power law exponent | γt = | 2.361 00
|
| Degree assortativity | ρ = | −0.041 837 0
|
| Degree assortativity p-value | pρ = | 0.000 00
|
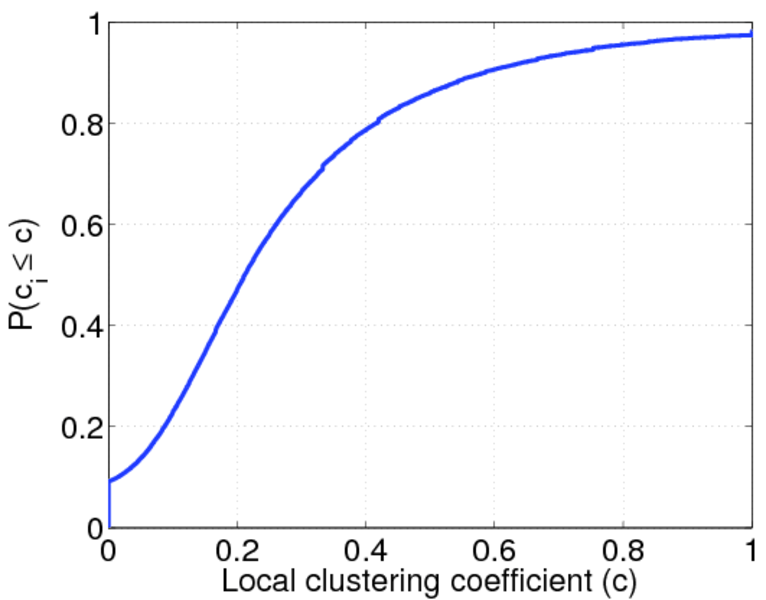
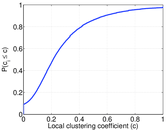
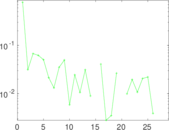
| Clustering coefficient | c = | 0.003 089 11
|
| Directed clustering coefficient | c± = | 0.026 540 2
|
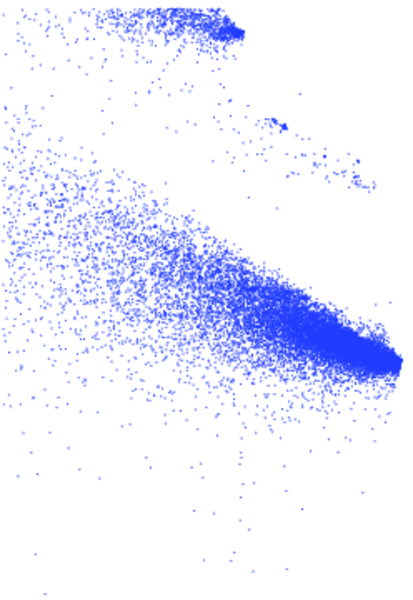
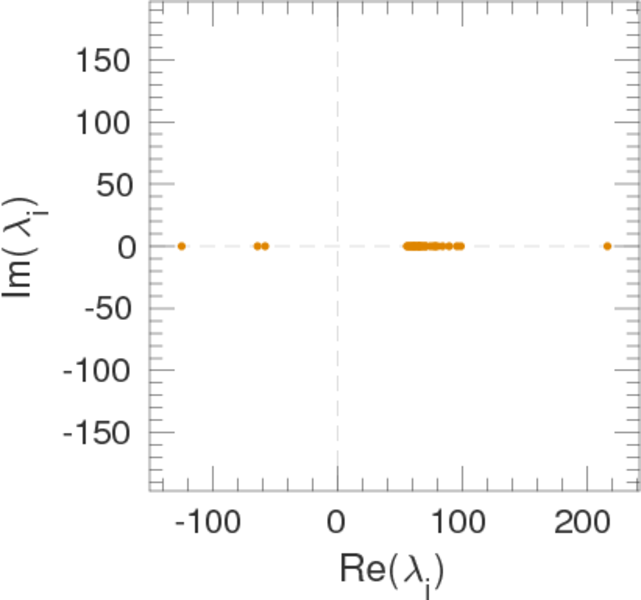
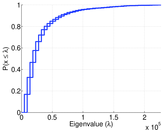
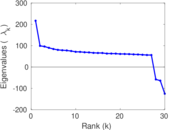
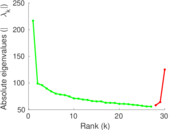
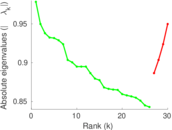
| Spectral norm | α = | 848.572
|
| Operator 2-norm | ν = | 690.274
|
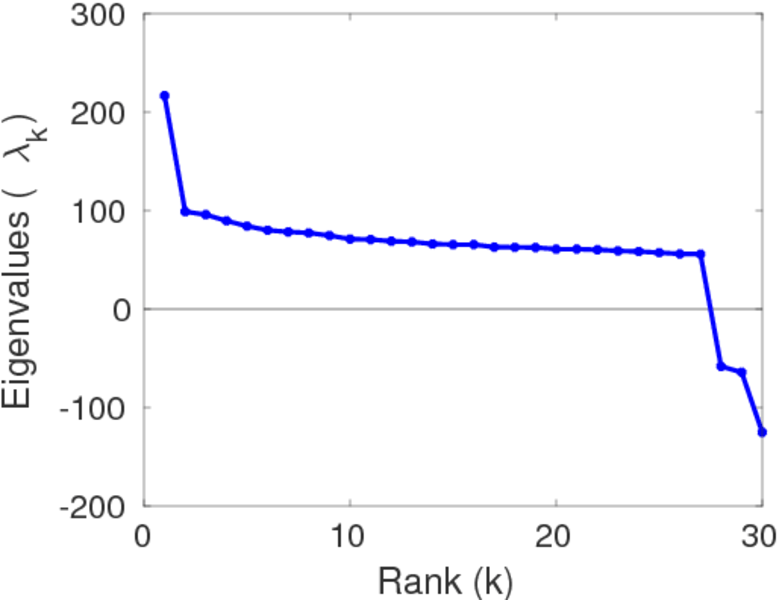
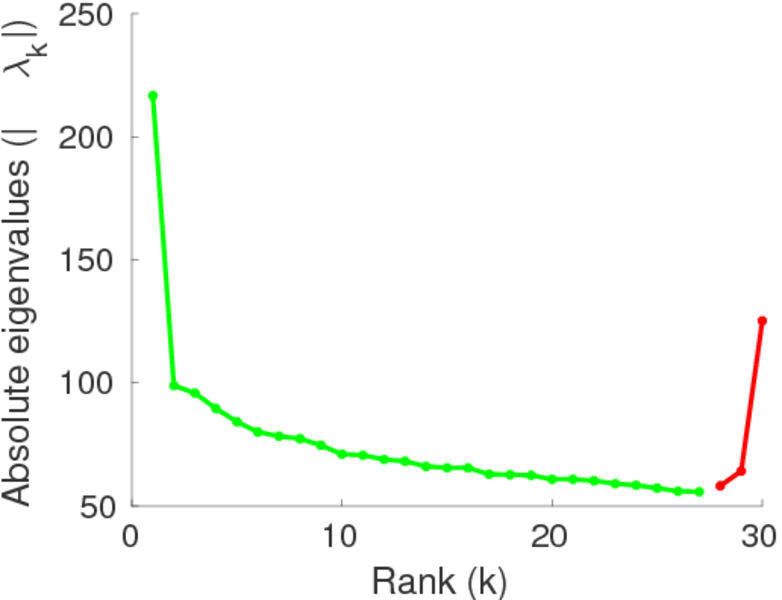
| Cyclic eigenvalue | π = | 216.703
|
| Reciprocity | y = | 0.171 231
|
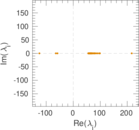
| Non-bipartivity | bA = | 0.240 561
|
| Normalized non-bipartivity | bN = | 0.021 029 4
|
| Algebraic non-bipartivity | χ = | 0.040 018 0
|
| Spectral bipartite frustration | bK = | 0.000 256 124
|
| Controllability | C = | 516,409
|
| Relative controllability | Cr = | 0.276 050
|
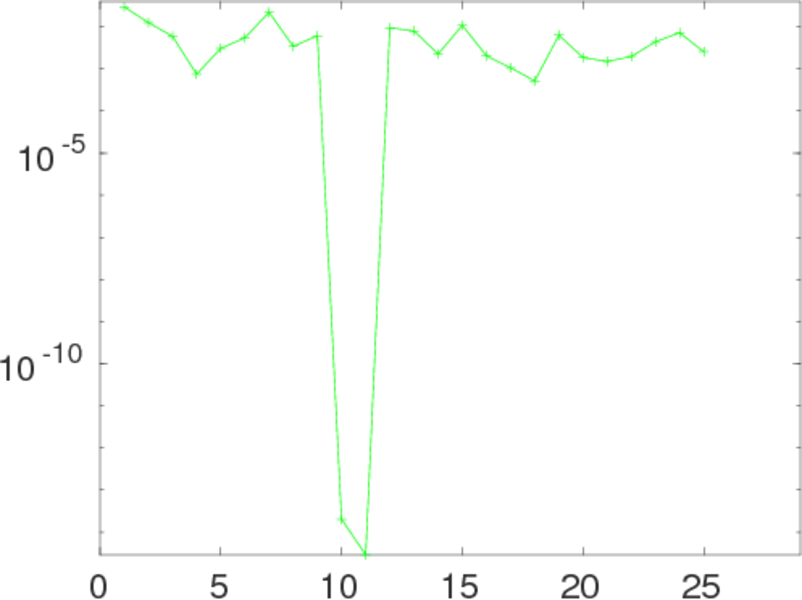
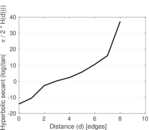
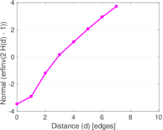
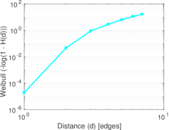
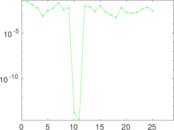
Plots


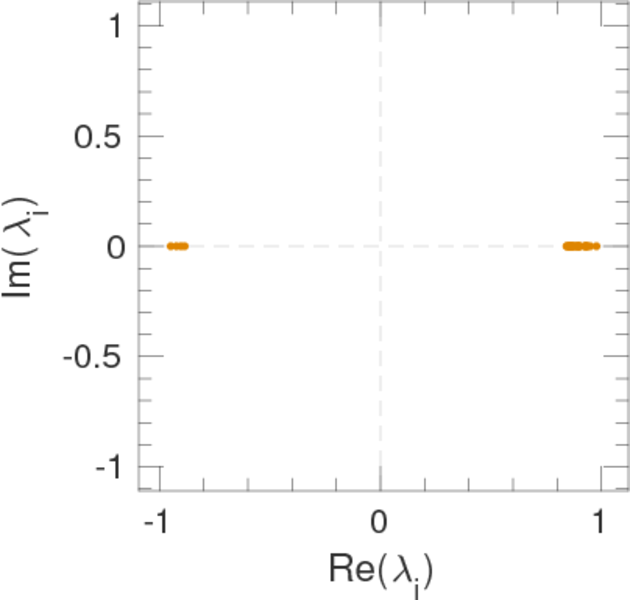
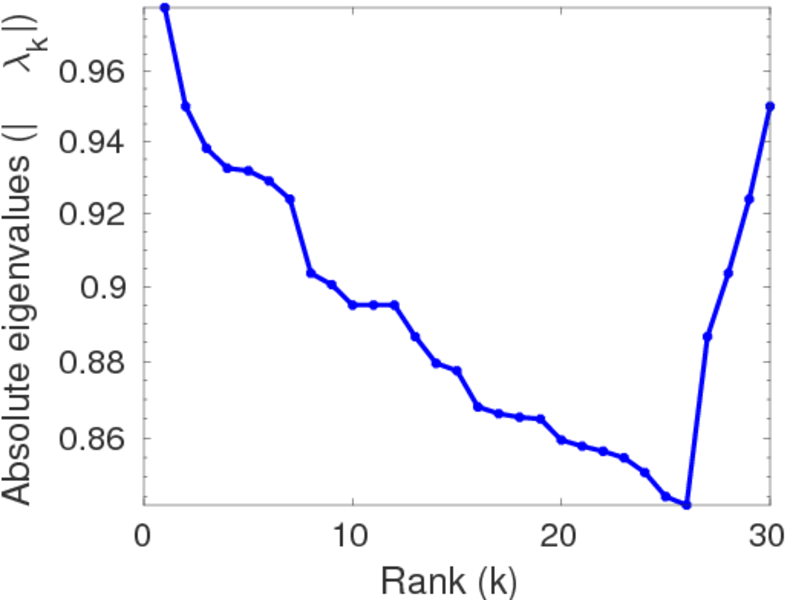
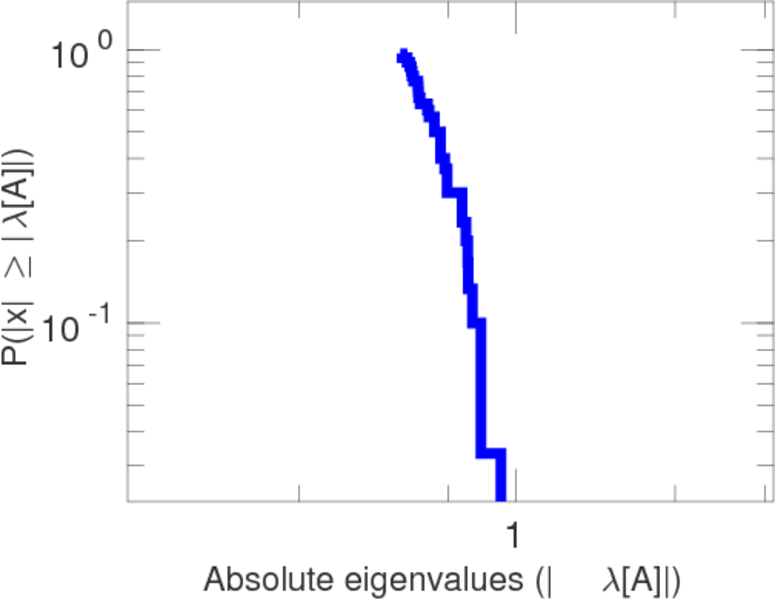
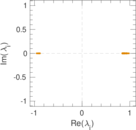
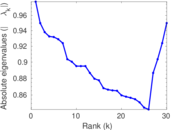
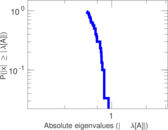
Matrix decompositions plots


Downloads
References
|
[1]
|
Jérôme Kunegis.
KONECT – The Koblenz Network Collection.
In Proc. Int. Conf. on World Wide Web Companion, pages
1343–1350, 2013.
[ http ]
|
|
[2]
|
Alan Mislove.
Online Social Networks: Measurement, Analysis, and Applications
to Distributed Information Systems.
PhD thesis, Rice Univ., 2009.
|
 KONECT ‣ Networks ‣
Buy Me a Coffee
KONECT ‣ Networks ‣
Buy Me a Coffee