BibSonomy tag–item
This is the bipartite tag–publication network from BibSonomy. The network
allows multiple edge, i.e., publications can be tagged multiple times with the
same tag. The network is complete as it is taken from the official BibSonomy
dump.
Metadata
Statistics
| Size | n = | 972,120
|
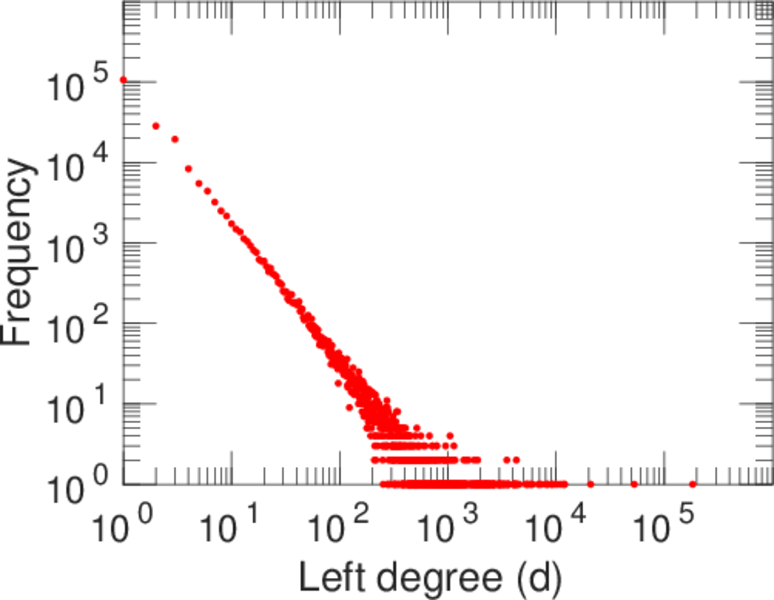
| Left size | n1 = | 204,673
|
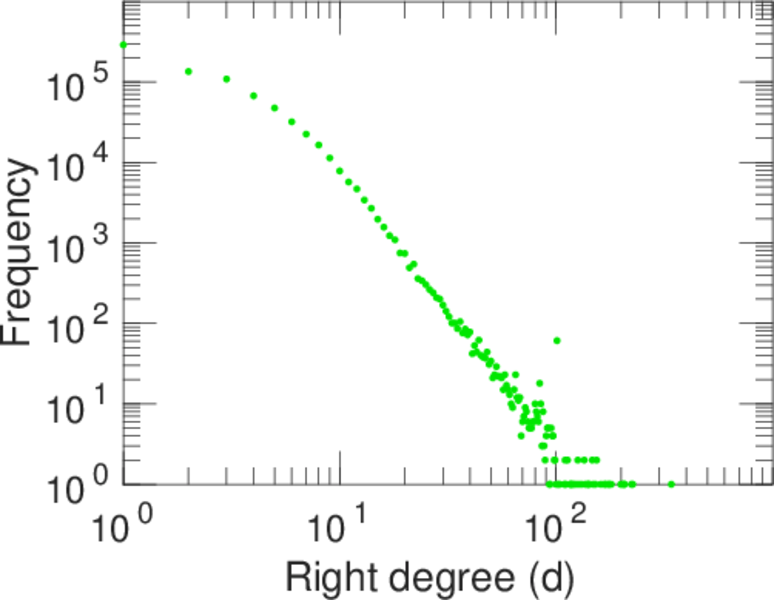
| Right size | n2 = | 767,447
|
| Volume | m = | 2,555,080
|
| Unique edge count | m̿ = | 2,499,057
|
| Wedge count | s = | 19,526,902,897
|
| Claw count | z = | 1,043,988,925,479,286
|
| Cross count | x = | 4.672 67 × 1019
|
| Square count | q = | 636,346,469
|
| 4-Tour count | T4 = | 83,203,483,378
|
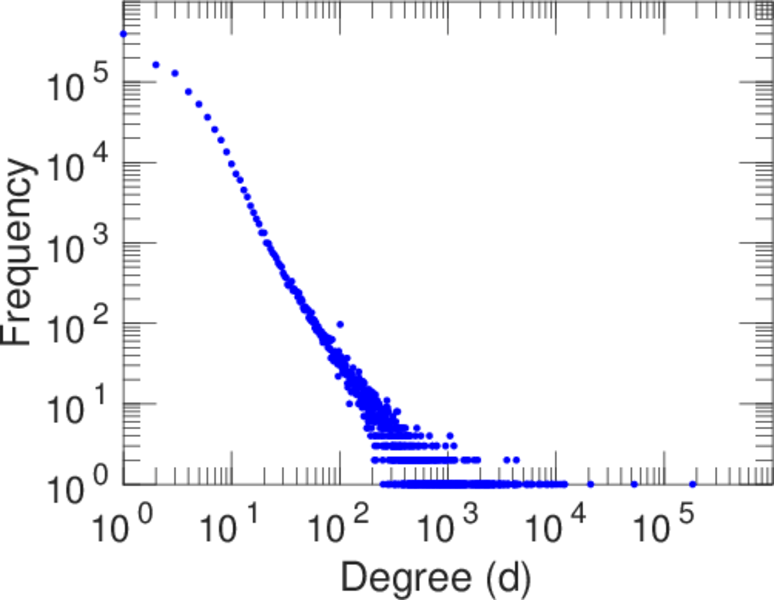
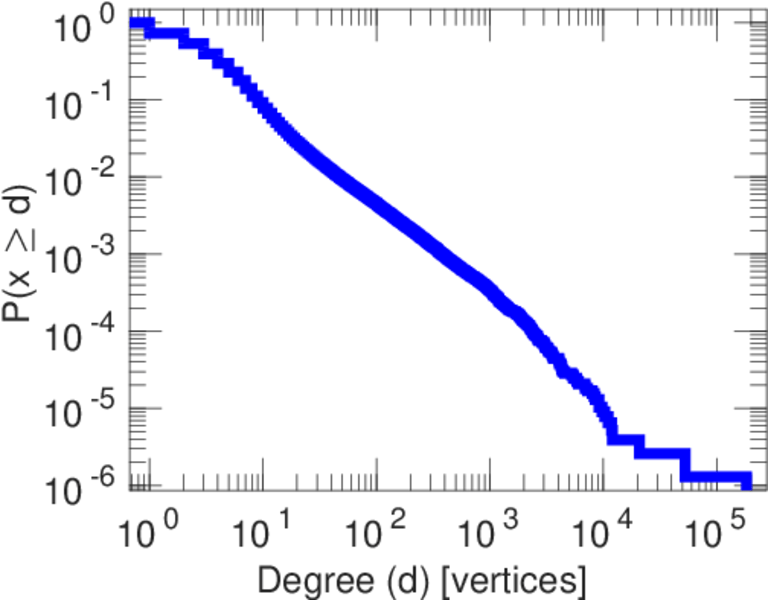
| Maximum degree | dmax = | 182,908
|
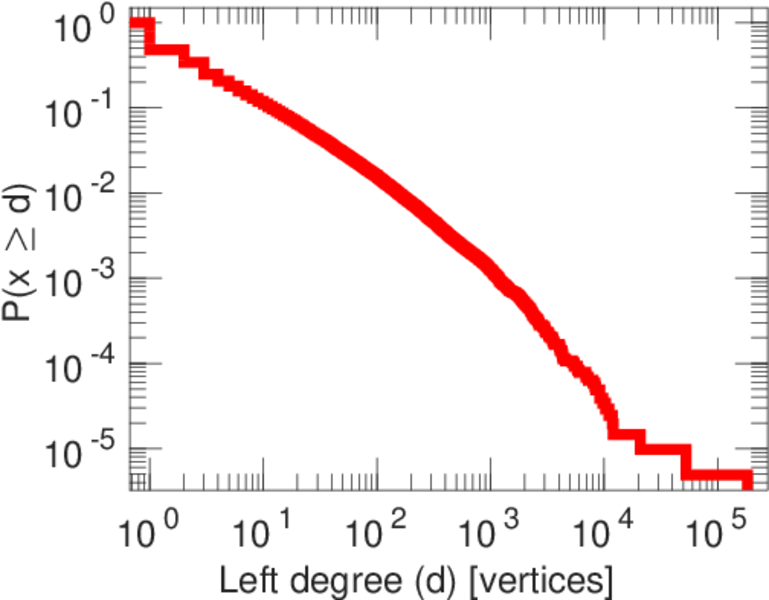
| Maximum left degree | d1max = | 182,908
|
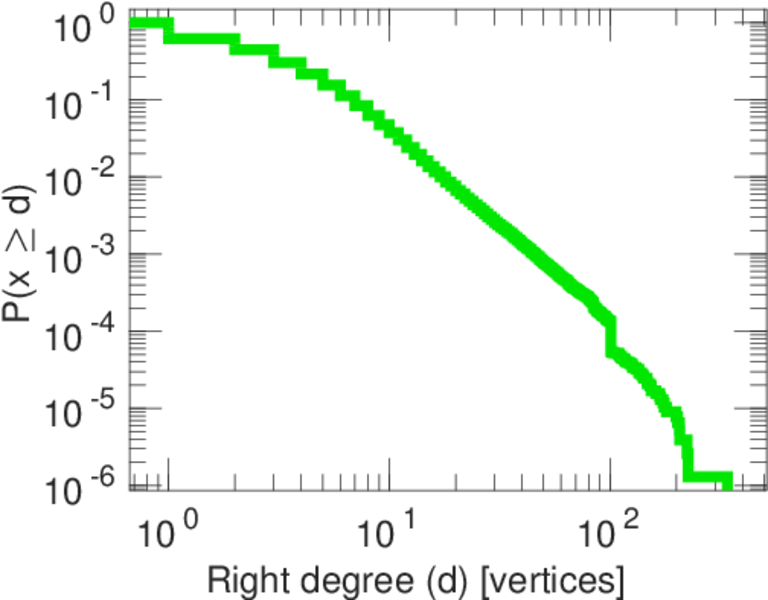
| Maximum right degree | d2max = | 341
|
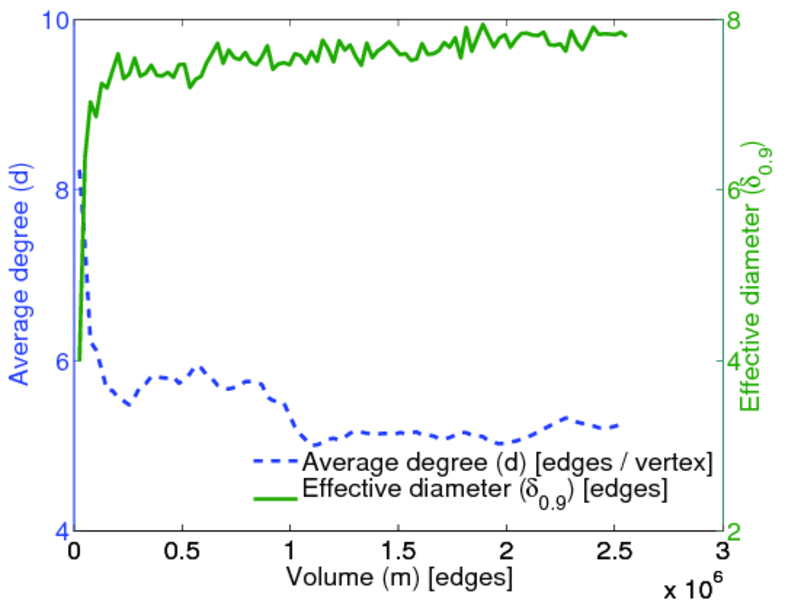
| Average degree | d = | 5.256 72
|
| Average left degree | d1 = | 12.483 7
|
| Average right degree | d2 = | 3.329 32
|
| Fill | p = | 1.590 99 × 10−5
|
| Average edge multiplicity | m̃ = | 1.022 42
|
| Size of LCC | N = | 937,063
|
| Diameter | δ = | 22
|
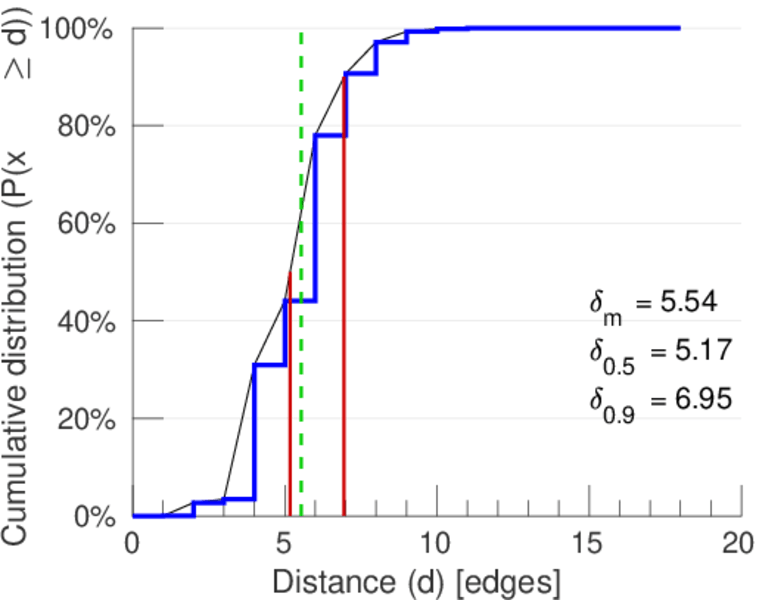
| 50-Percentile effective diameter | δ0.5 = | 5.174 78
|
| 90-Percentile effective diameter | δ0.9 = | 6.948 13
|
| Median distance | δM = | 6
|
| Mean distance | δm = | 5.540 73
|
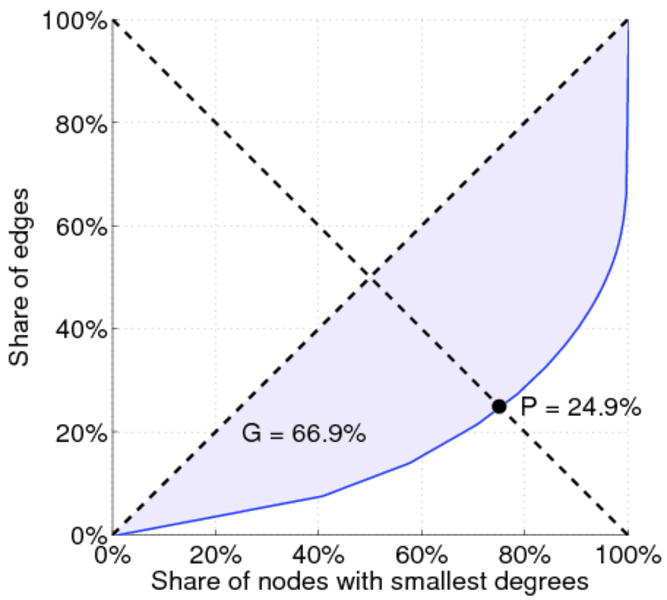
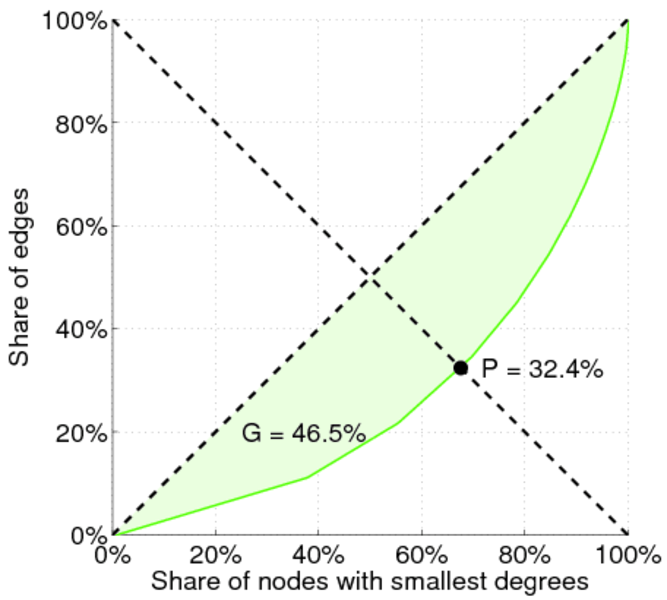
| Gini coefficient | G = | 0.666 800
|
| Balanced inequality ratio | P = | 0.251 730
|
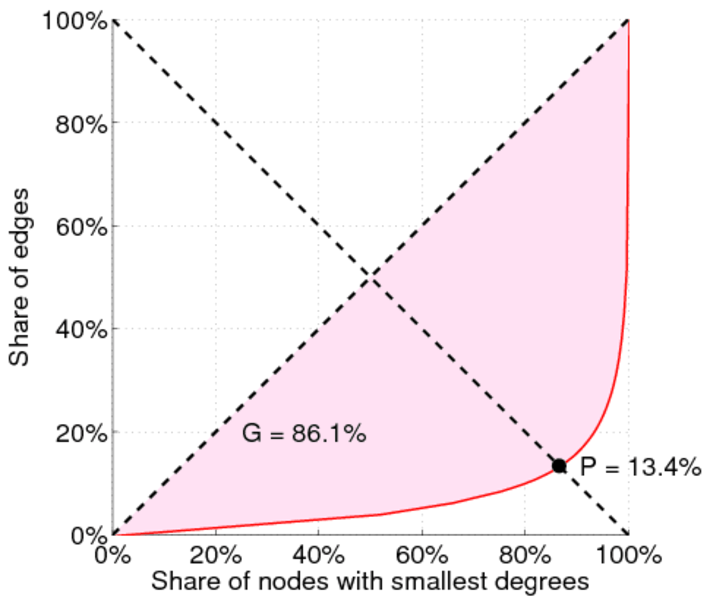
| Left balanced inequality ratio | P1 = | 0.134 076
|
| Right balanced inequality ratio | P2 = | 0.324 171
|
| Relative edge distribution entropy | Her = | 0.857 427
|
| Power law exponent | γ = | 2.209 99
|
| Tail power law exponent | γt = | 2.051 00
|
| Tail power law exponent with p | γ3 = | 2.051 00
|
| p-value | p = | 0.000 00
|
| Left tail power law exponent with p | γ3,1 = | 1.791 00
|
| Left p-value | p1 = | 0.000 00
|
| Right tail power law exponent with p | γ3,2 = | 3.921 00
|
| Right p-value | p2 = | 0.000 00
|
| Degree assortativity | ρ = | −0.185 572
|
| Degree assortativity p-value | pρ = | 0.000 00
|
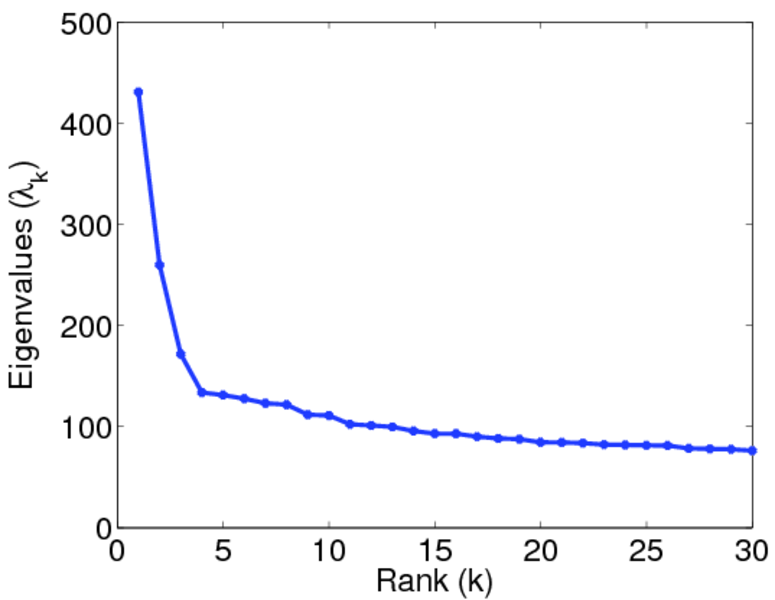
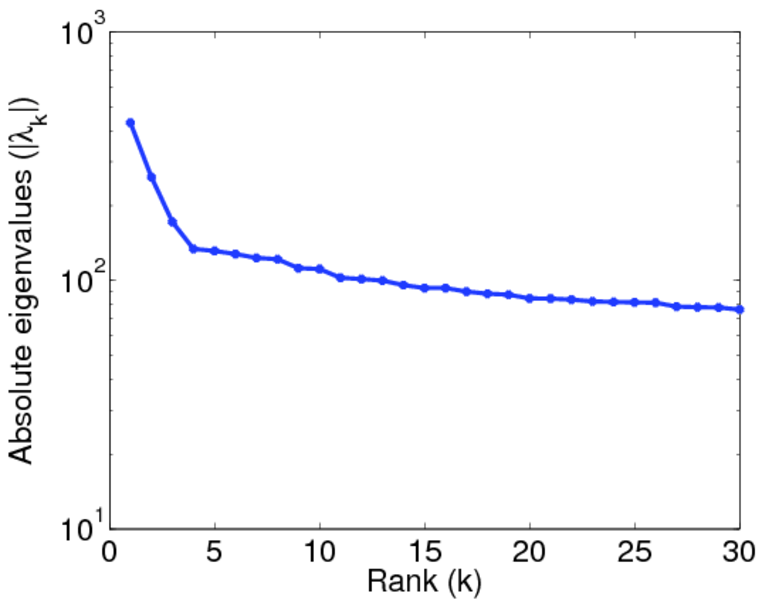
| Spectral norm | α = | 430.870
|
| Algebraic connectivity | a = | 0.000 207 657
|
| Spectral separation | |λ1[A] / λ2[A]| = | 1.656 96
|
| Controllability | C = | 667,469
|
| Relative controllability | Cr = | 0.686 612
|
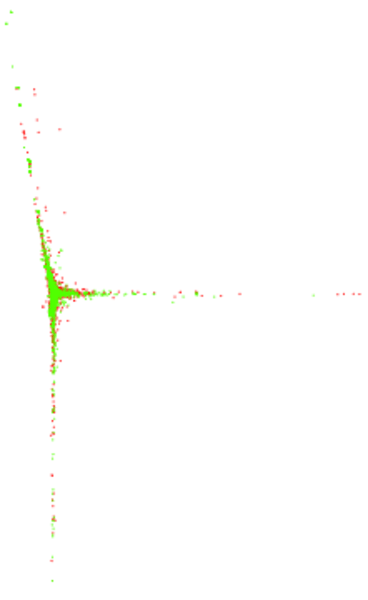
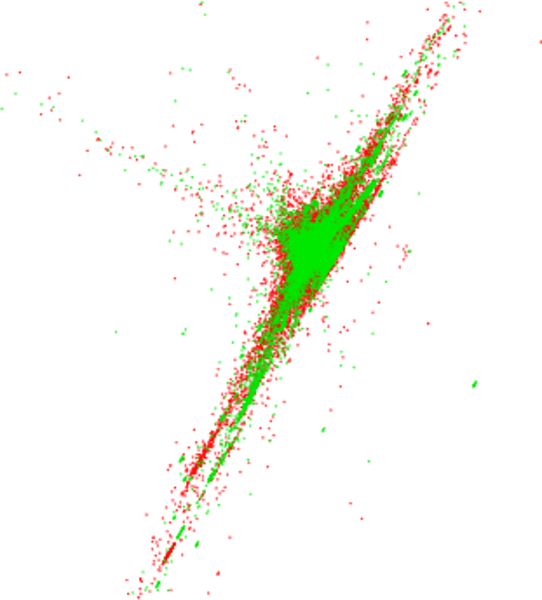
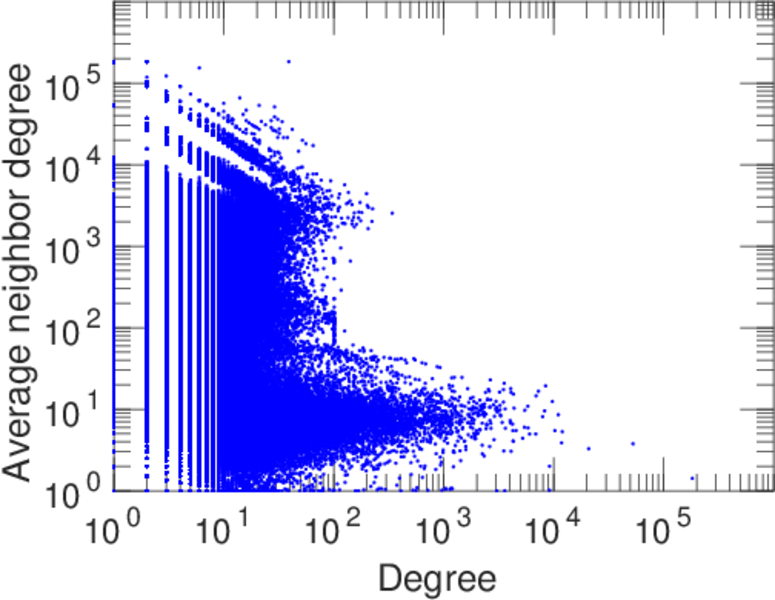
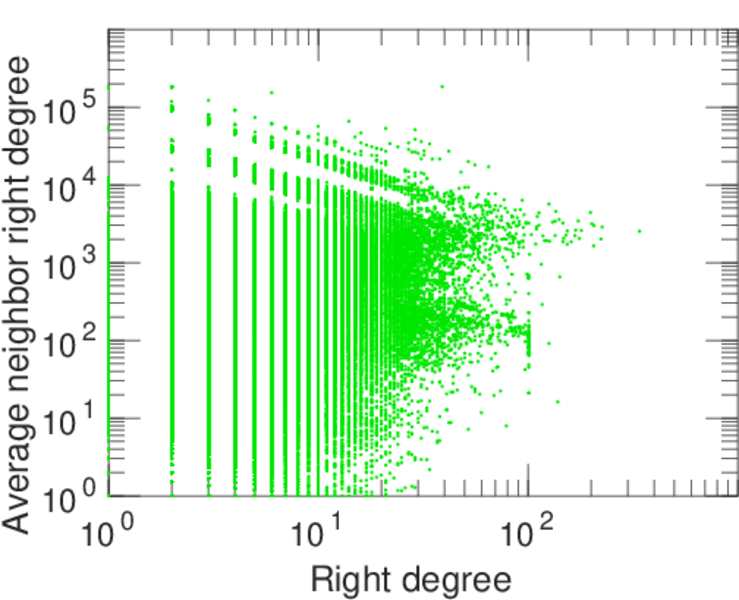
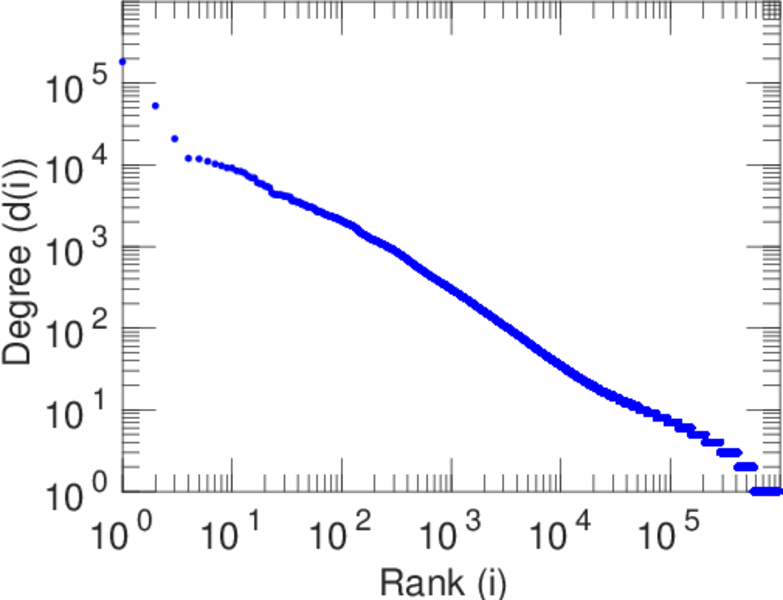
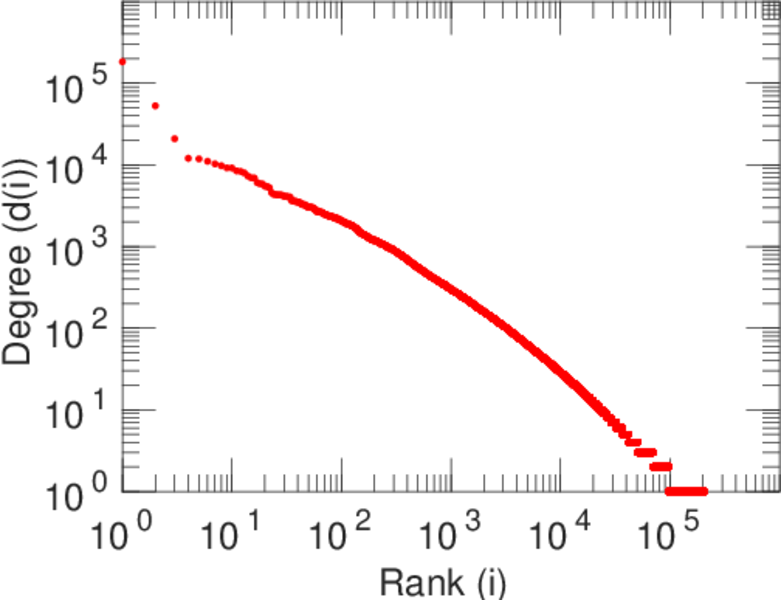
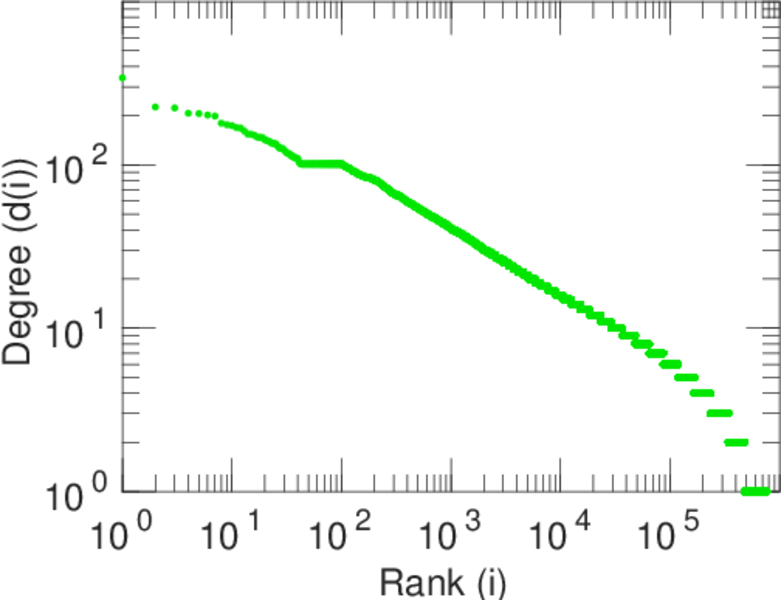
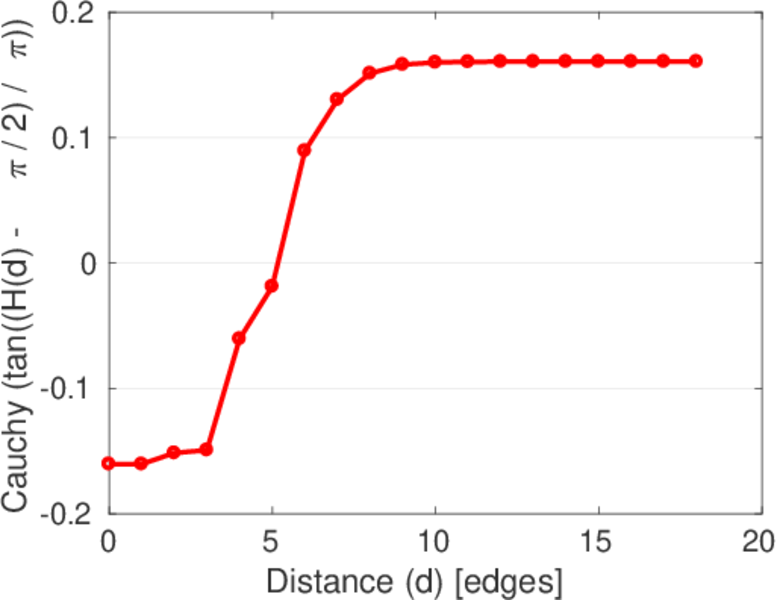
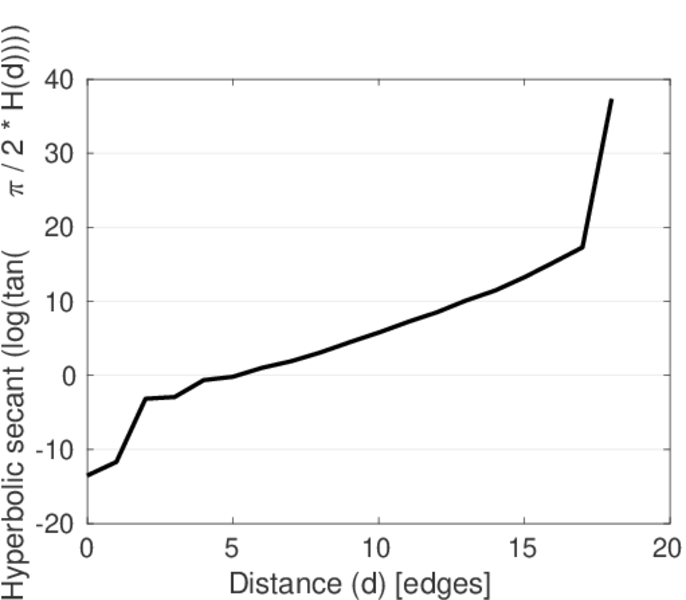
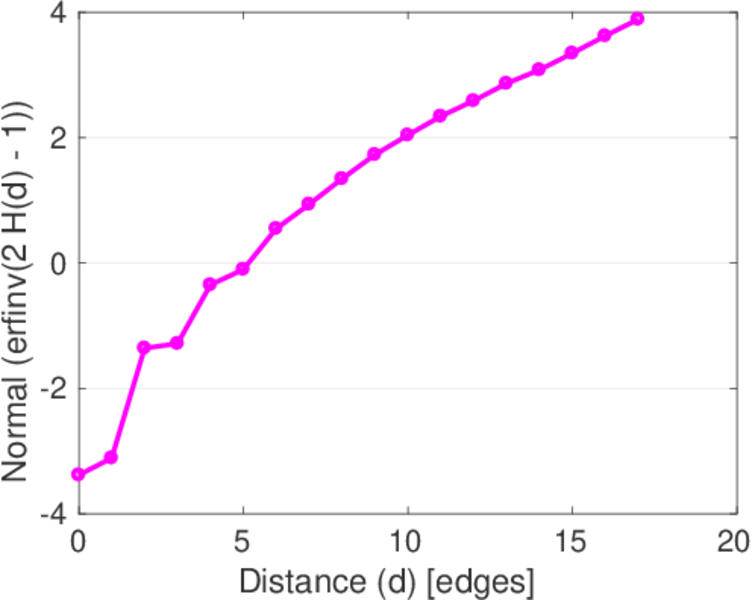
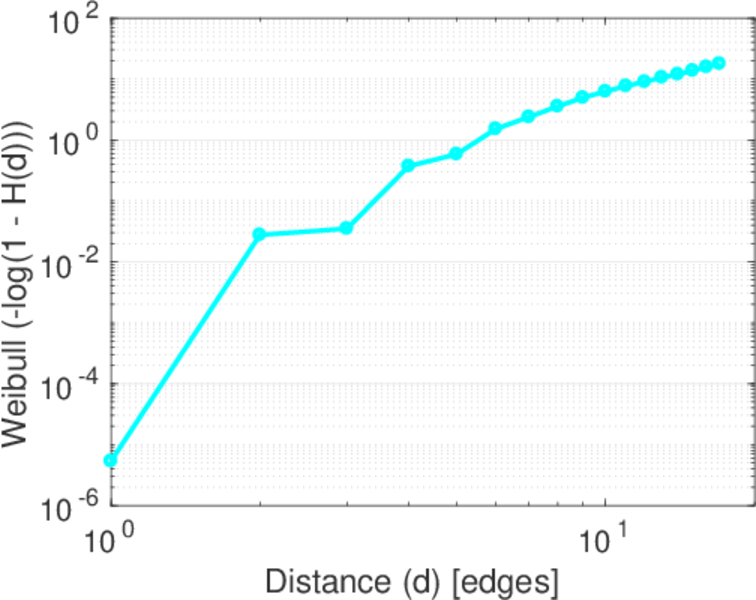
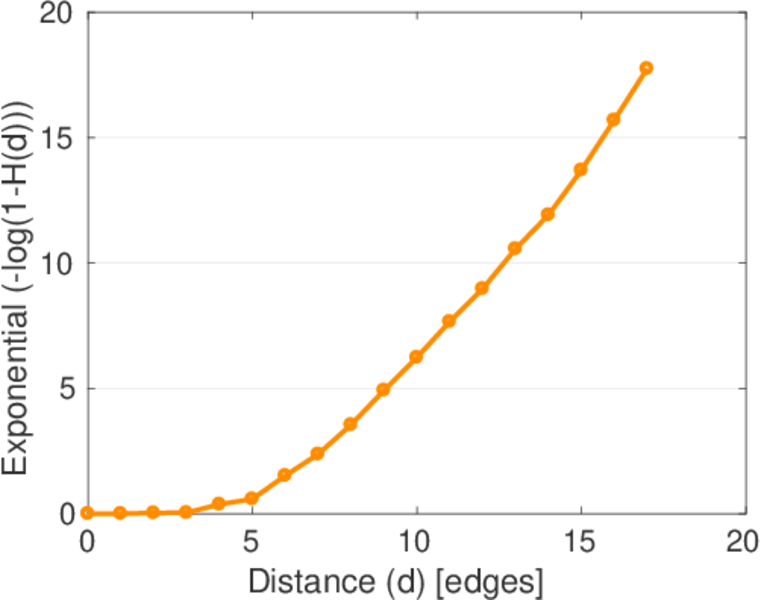
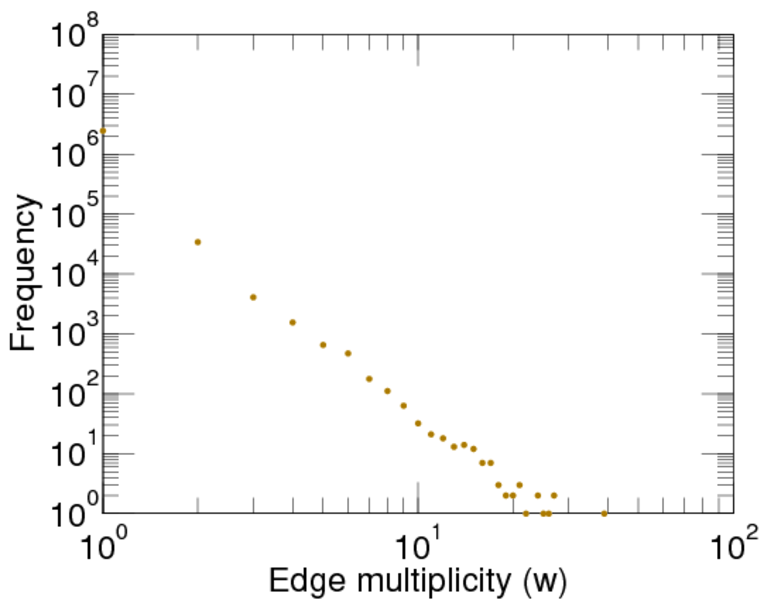
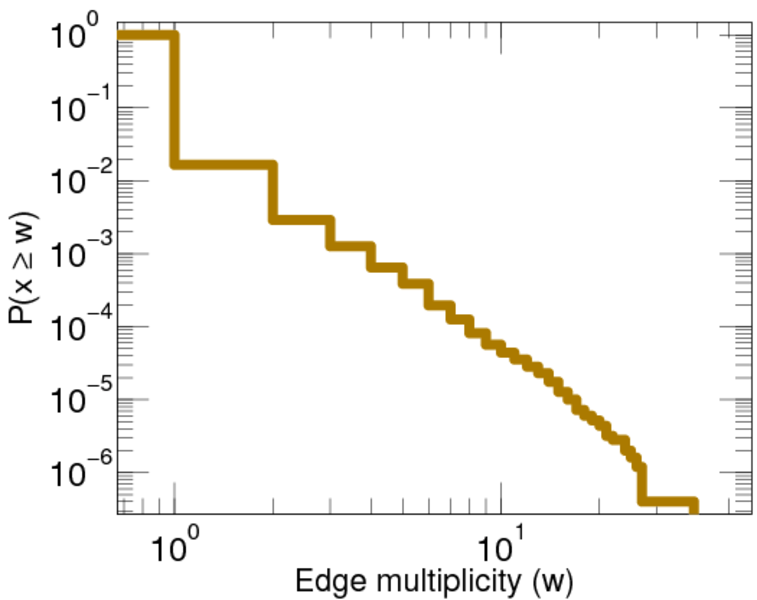
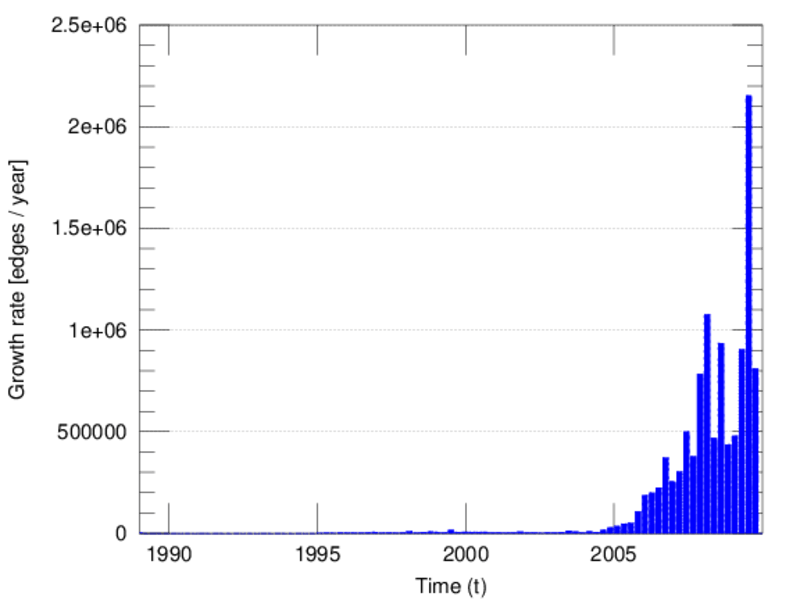
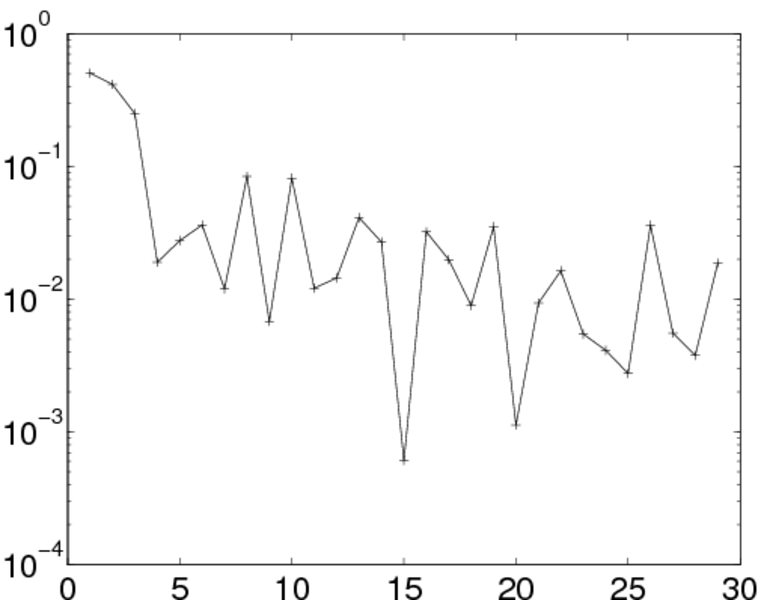
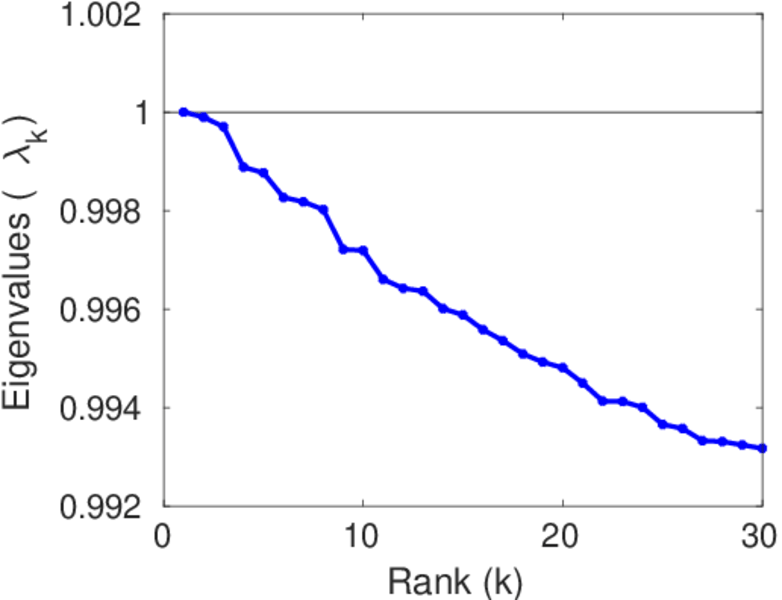
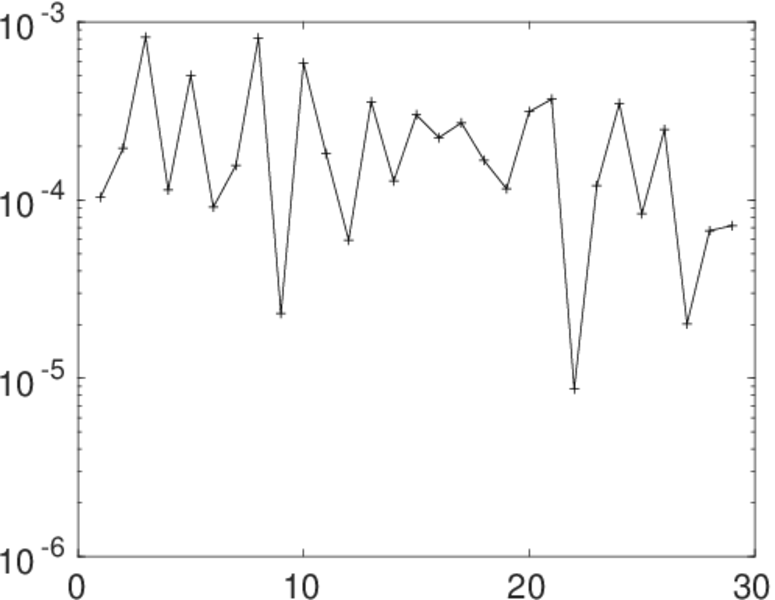
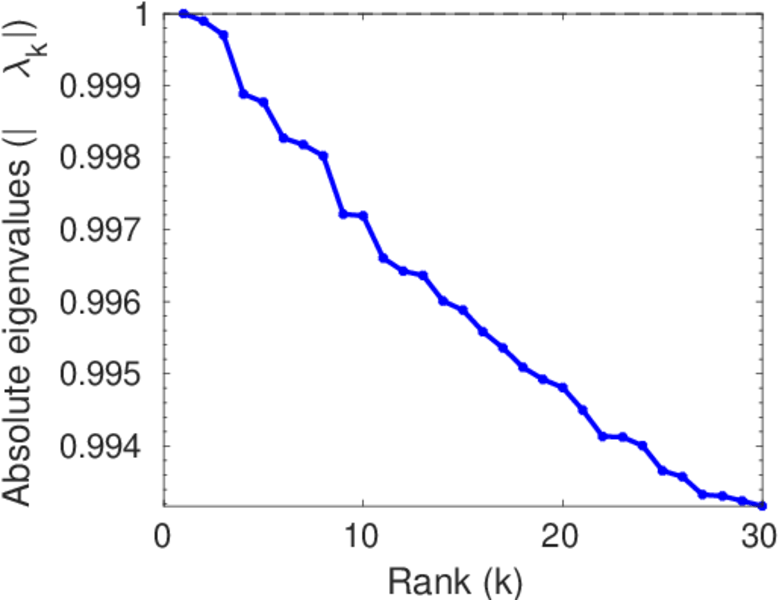
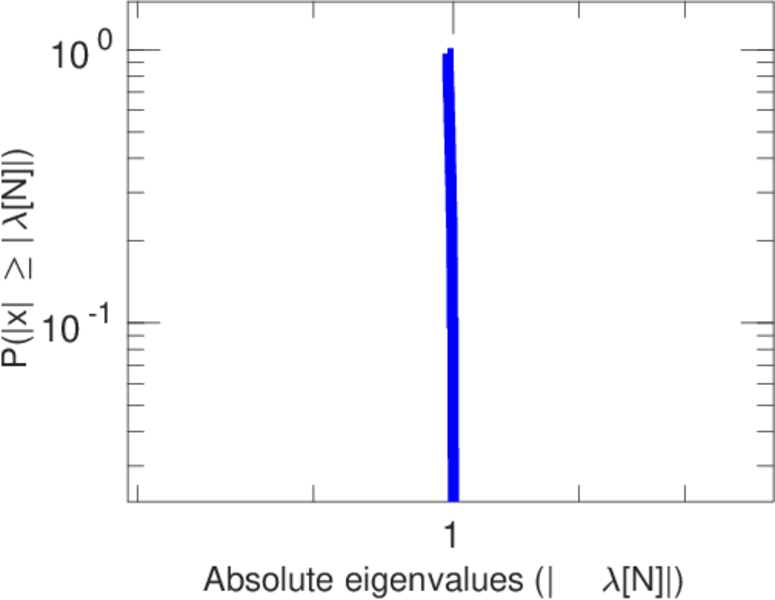
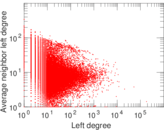
Plots


Matrix decompositions plots


Downloads
References
|
[1]
|
Jérôme Kunegis.
KONECT – The Koblenz Network Collection.
In Proc. Int. Conf. on World Wide Web Companion, pages
1343–1350, 2013.
[ http ]
|
|
[2]
|
Dominik Benz, Andreas Hotho, Robert Jäschke, Beate Krause, Folke Mitzlaff,
Christoph Schmitz, and Gerd Stumme.
The social bookmark and publication management system BibSonomy.
The VLDB J., 19(6):849–875, dec 2010.
|
 KONECT ‣ Networks ‣
Buy Me a Coffee
KONECT ‣ Networks ‣
Buy Me a Coffee