BibSonomy user–item
This is the bipartite user–publication network from BibSonomy. Each edge
represents a tag assignment. The network allows multiple edge, i.e., a user
may give multiple tags to a single publication. The network is complete as it
is taken from the official BibSonomy dump.
Metadata
Statistics
| Size | n = | 773,241
|
| Left size | n1 = | 5,794
|
| Right size | n2 = | 767,447
|
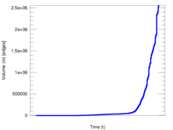
| Volume | m = | 2,555,080
|
| Unique edge count | m̿ = | 801,784
|
| Wedge count | s = | 12,835,279,754
|
| Claw count | z = | 394,424,715,096,067
|
| Cross count | x = | 1.037 59 × 1019
|
| Square count | q = | 2,794,766
|
| 4-Tour count | T4 = | 51,365,102,888
|
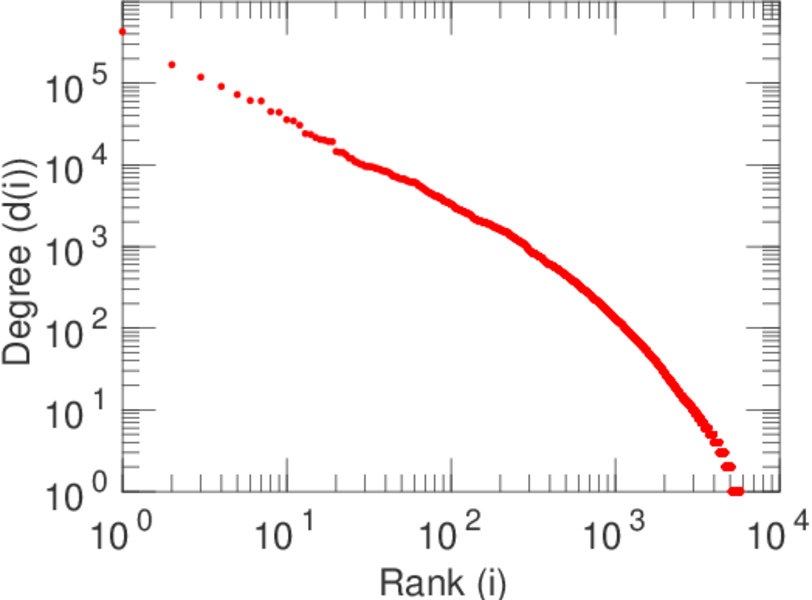
| Maximum degree | dmax = | 428,436
|
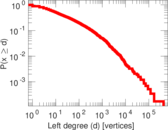
| Maximum left degree | d1max = | 428,436
|
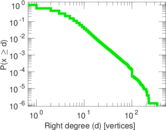
| Maximum right degree | d2max = | 341
|
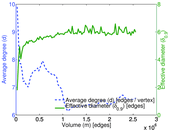
| Average degree | d = | 6.608 75
|
| Average left degree | d1 = | 440.987
|
| Average right degree | d2 = | 3.329 32
|
| Fill | p = | 0.000 180 314
|
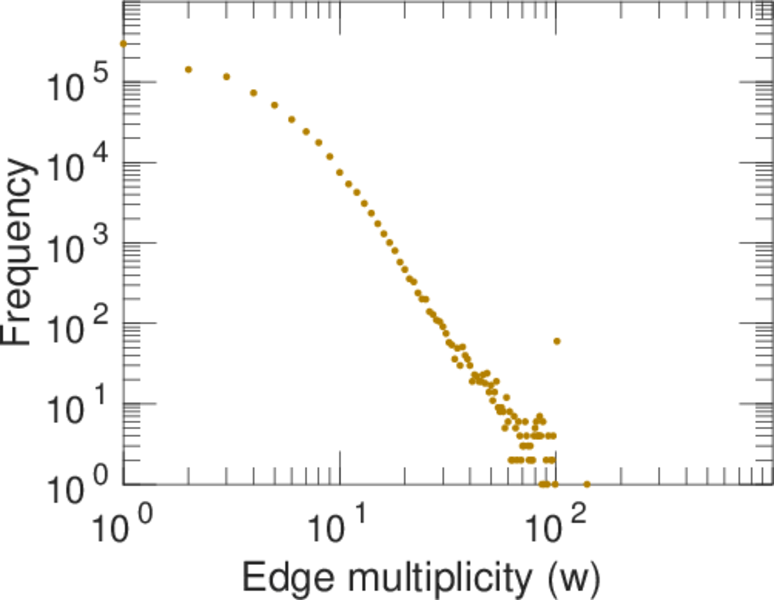
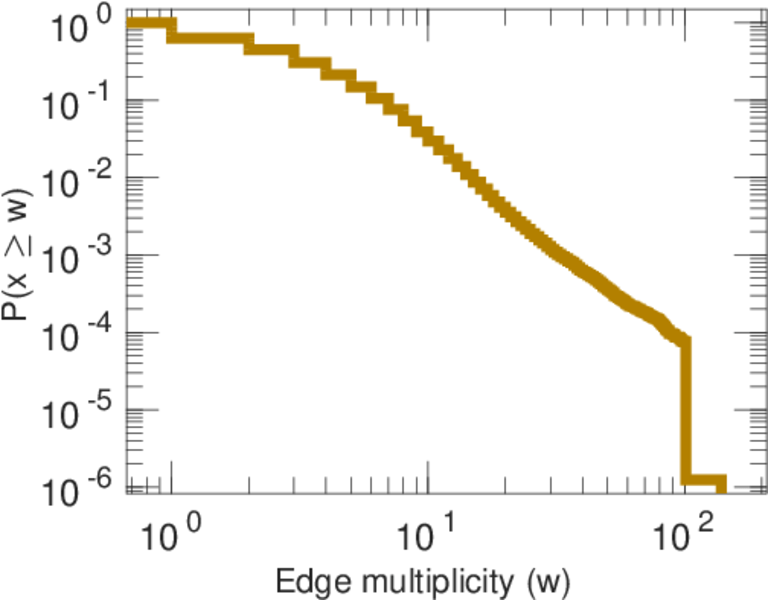
| Average edge multiplicity | m̃ = | 3.186 74
|
| Size of LCC | N = | 349,470
|
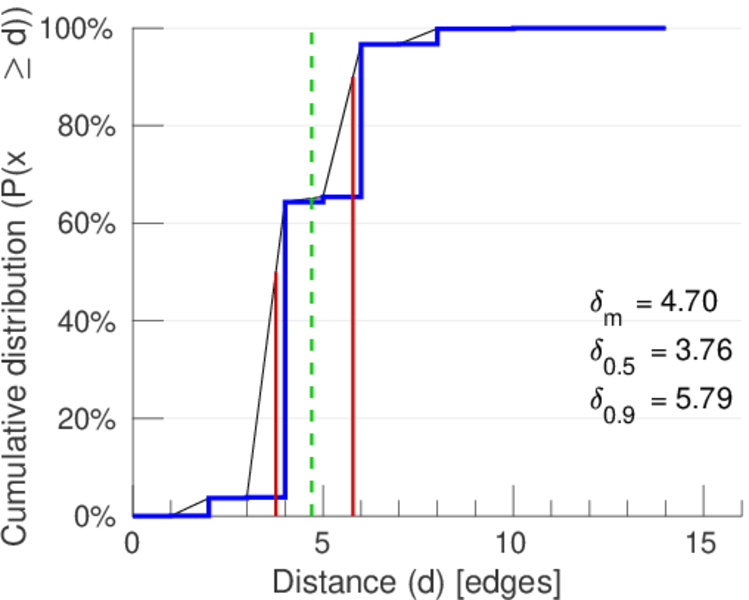
| Diameter | δ = | 16
|
| 50-Percentile effective diameter | δ0.5 = | 3.763 18
|
| 90-Percentile effective diameter | δ0.9 = | 5.788 28
|
| Median distance | δM = | 4
|
| Mean distance | δm = | 4.698 34
|
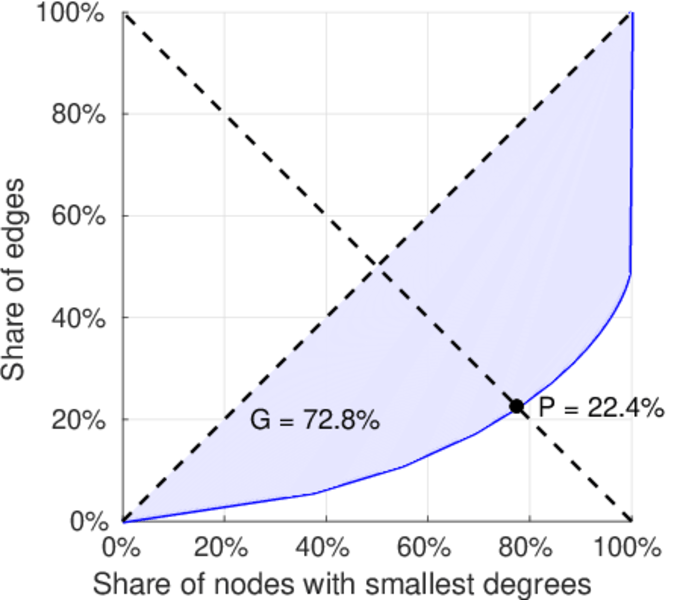
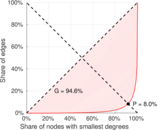
| Gini coefficient | G = | 0.730 014
|
| Balanced inequality ratio | P = | 0.222 665
|
| Left balanced inequality ratio | P1 = | 0.080 483 2
|
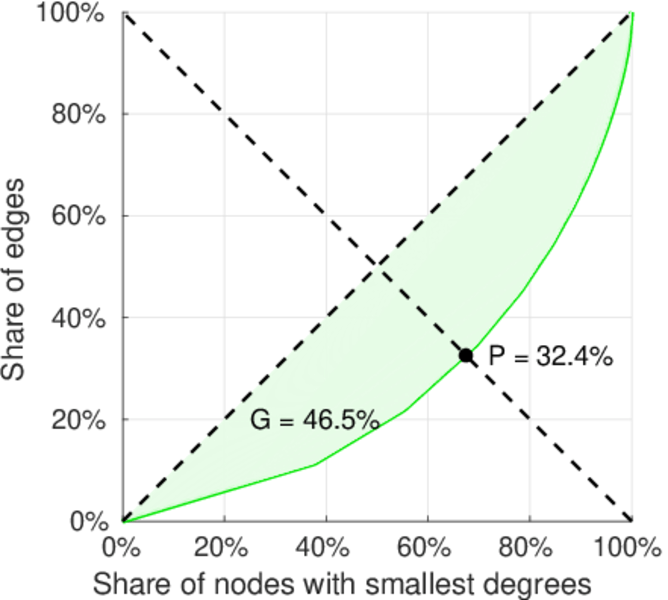
| Right balanced inequality ratio | P2 = | 0.324 171
|
| Relative edge distribution entropy | Her = | 0.738 449
|
| Power law exponent | γ = | 29.250 6
|
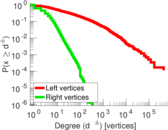
| Tail power law exponent | γt = | 4.691 00
|
| Tail power law exponent with p | γ3 = | 4.691 00
|
| p-value | p = | 0.000 00
|
| Left tail power law exponent with p | γ3,1 = | 1.431 00
|
| Left p-value | p1 = | 0.000 00
|
| Right tail power law exponent with p | γ3,2 = | 5.281 00
|
| Right p-value | p2 = | 0.000 00
|
| Degree assortativity | ρ = | −0.087 479 1
|
| Degree assortativity p-value | pρ = | 0.000 00
|
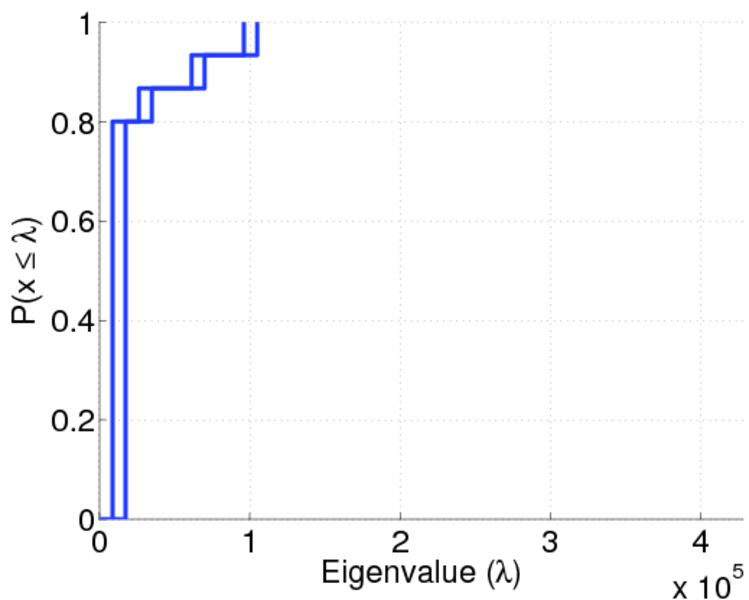
| Spectral norm | α = | 1,767.75
|
| Algebraic connectivity | a = | 0.001 069 24
|
| Spectral separation | |λ1[A] / λ2[A]| = | 1.621 81
|
| Controllability | C = | 761,785
|
| Relative controllability | Cr = | 0.985 184
|
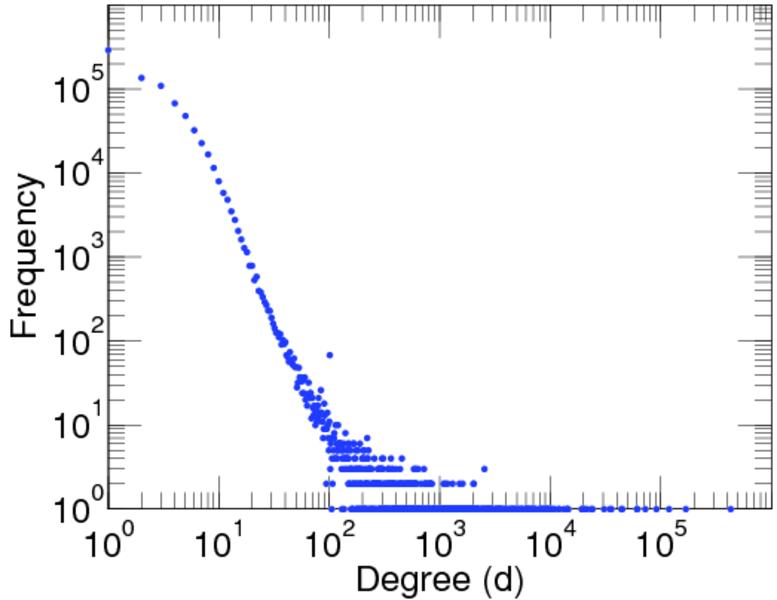
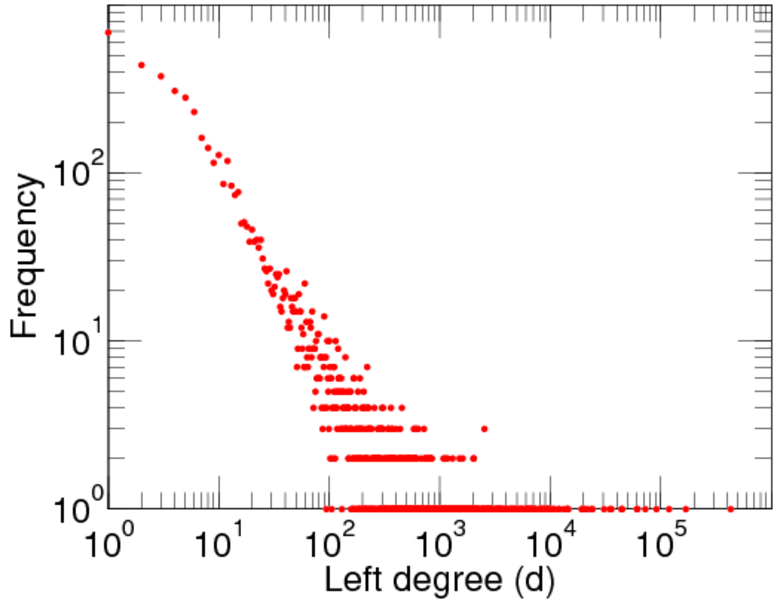
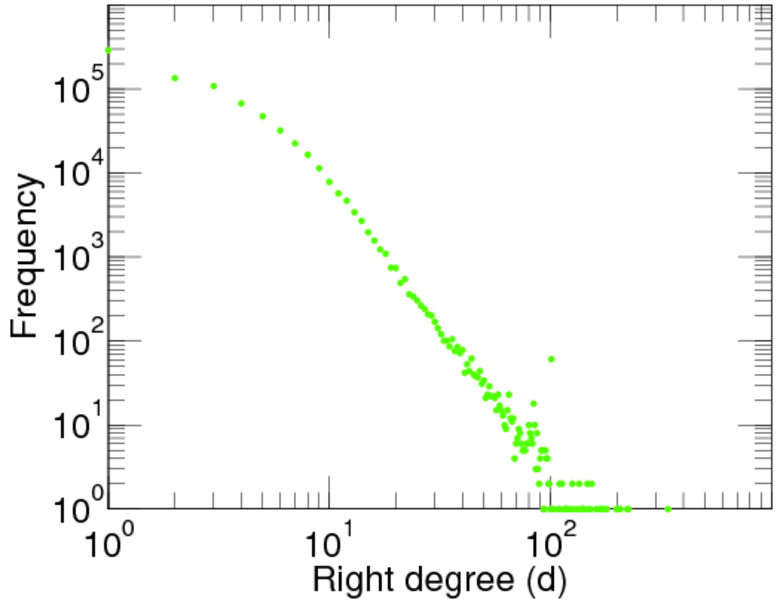
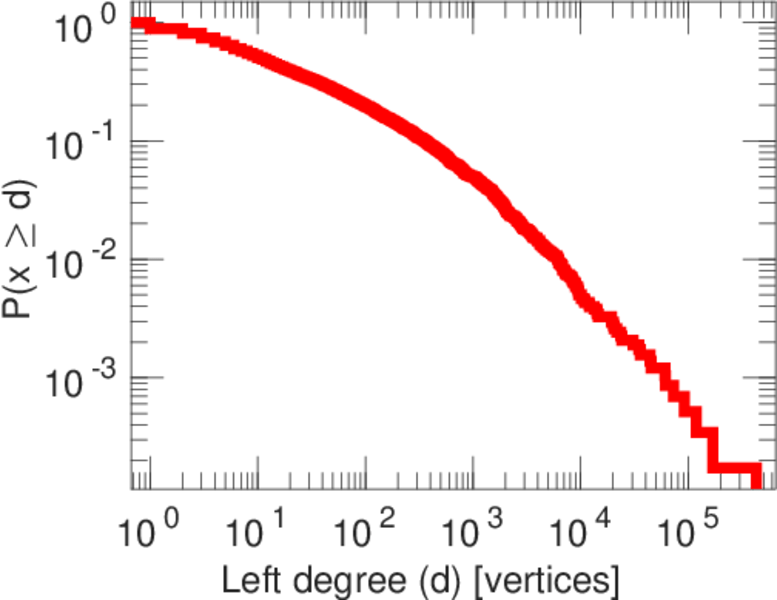
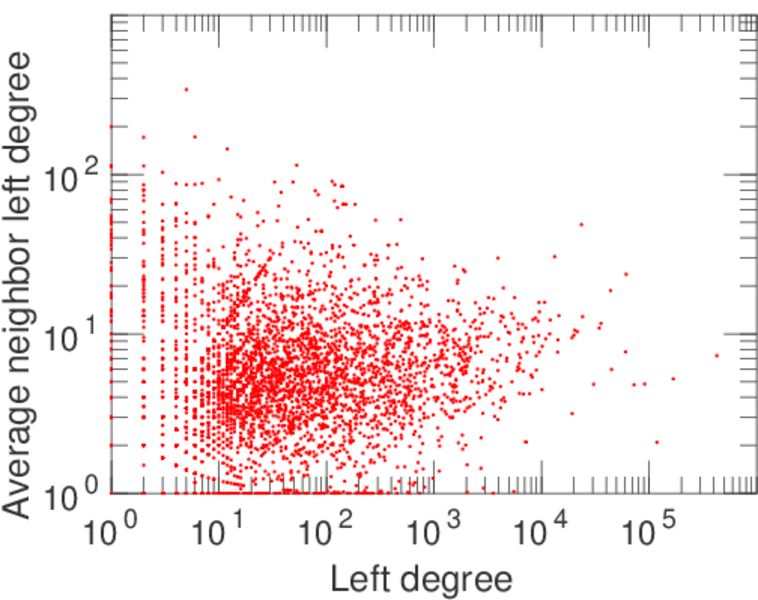
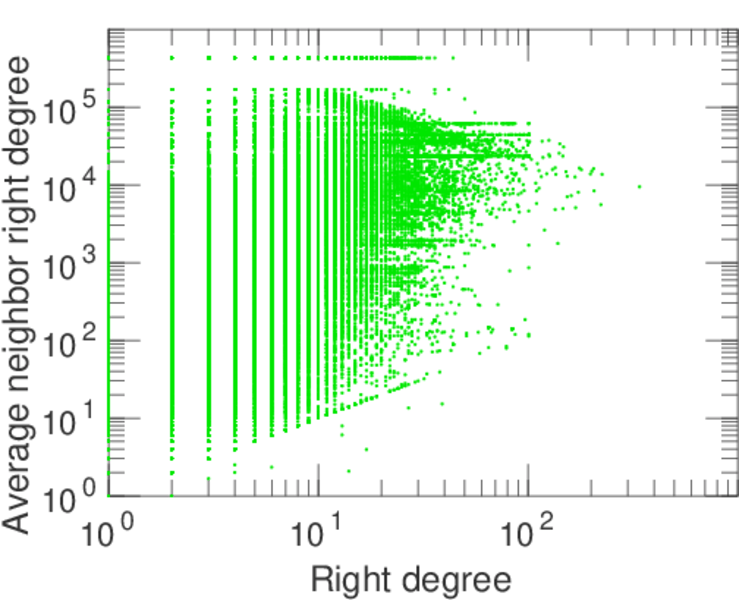
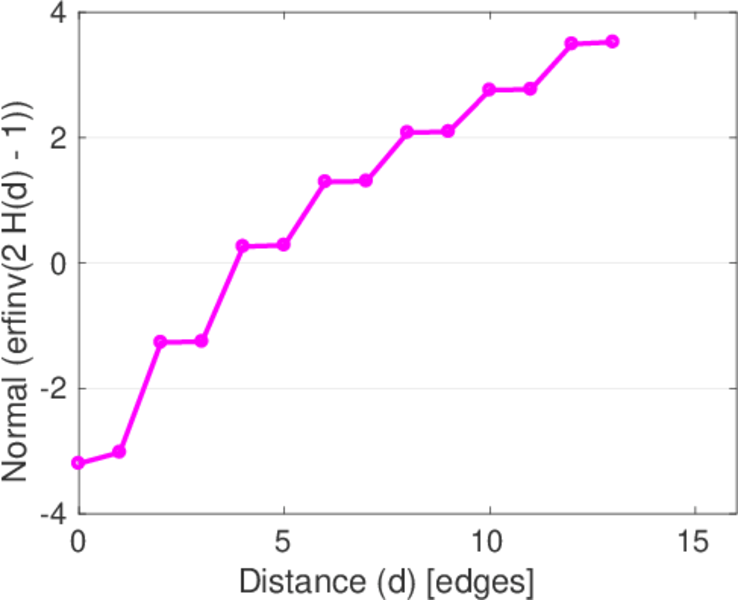
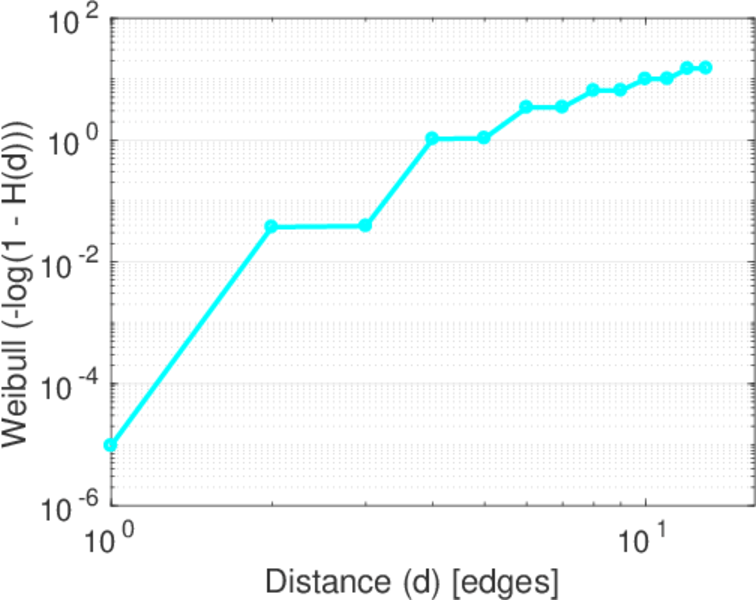
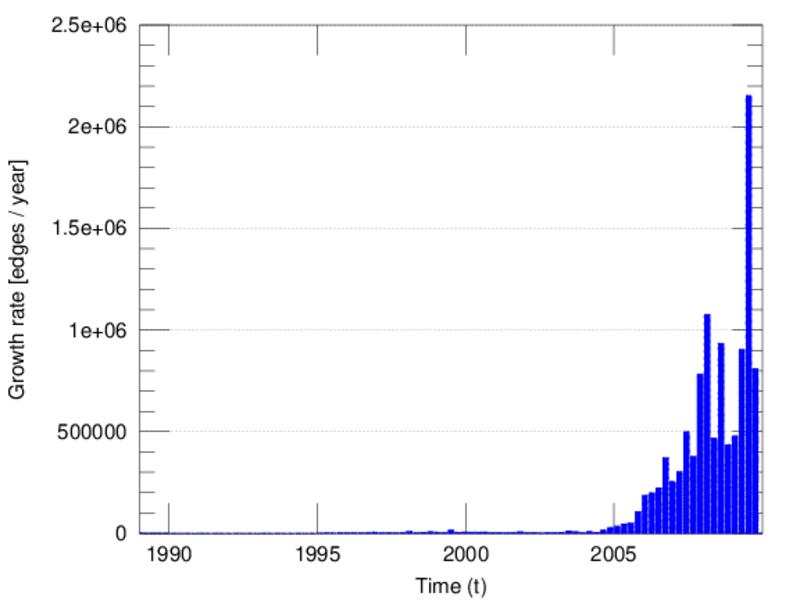
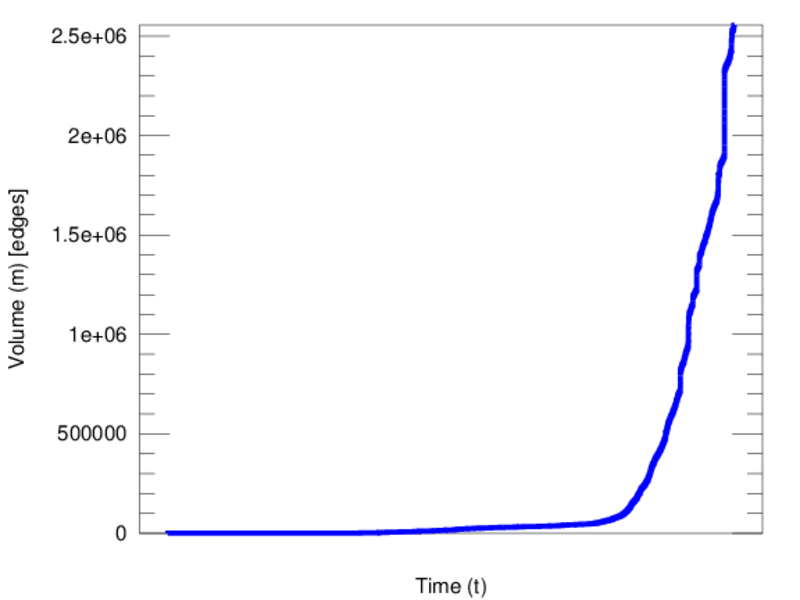
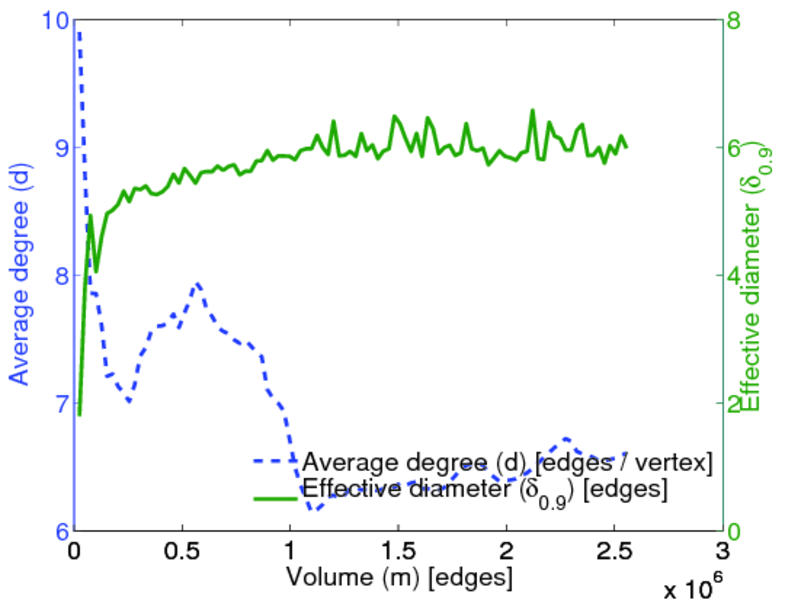
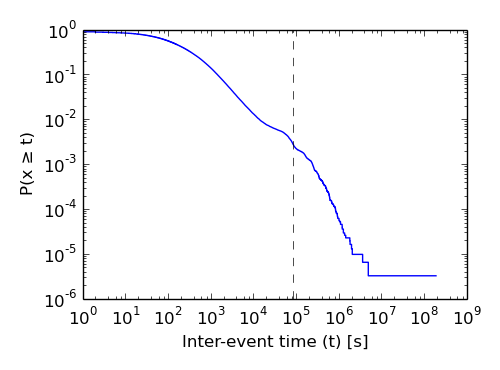
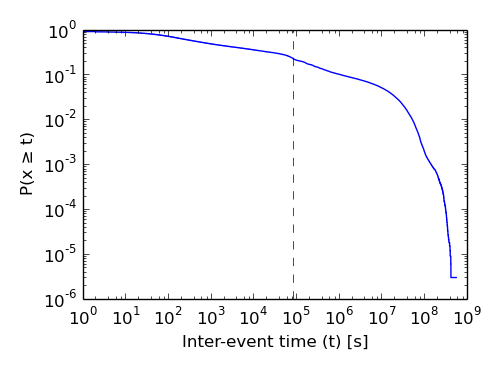
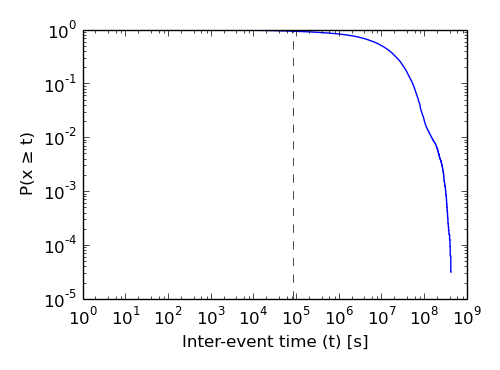
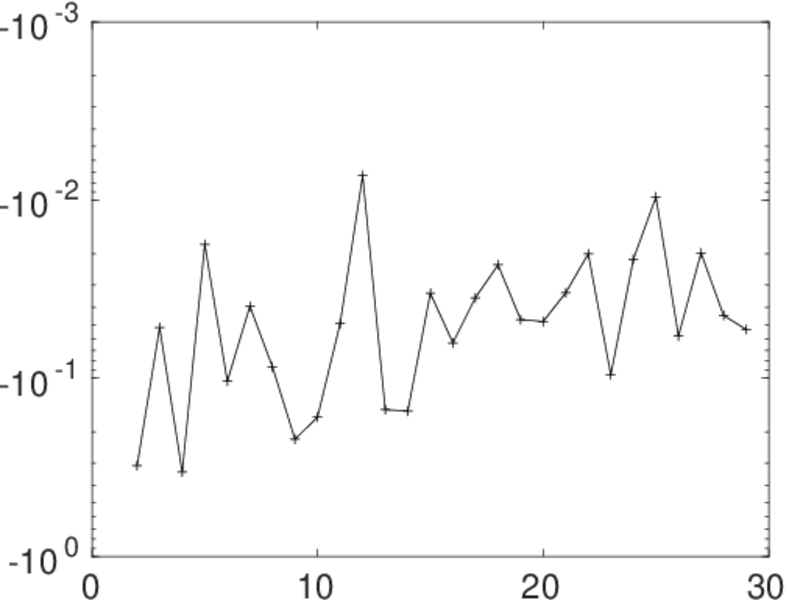
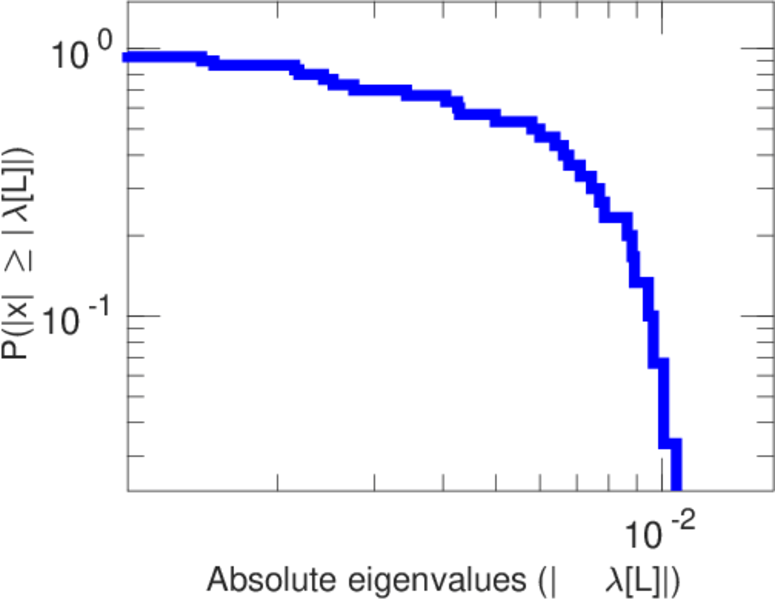
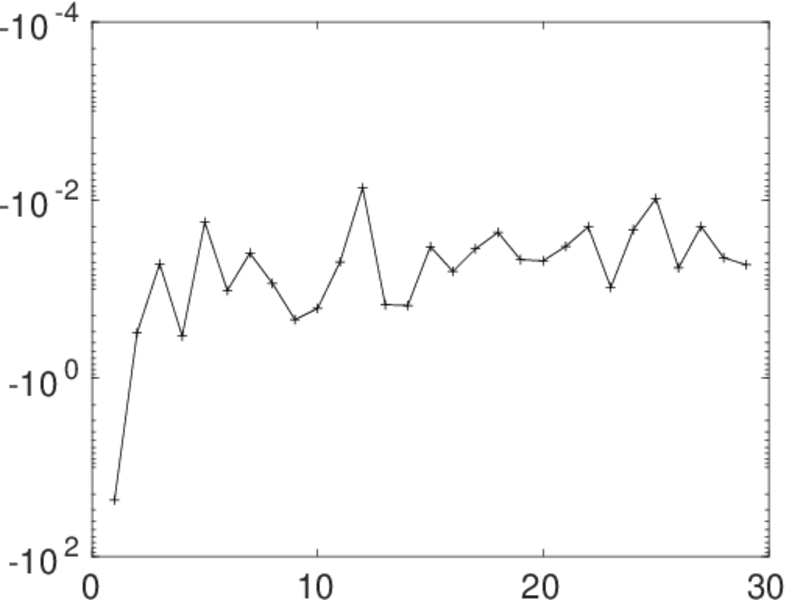
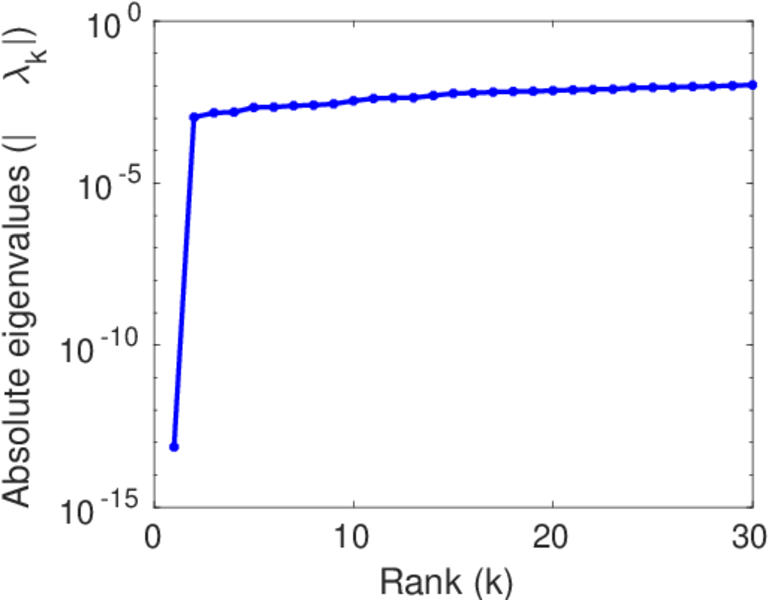
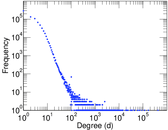
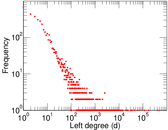
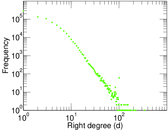
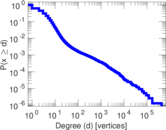
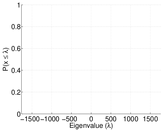
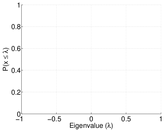
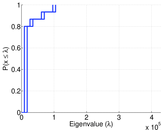
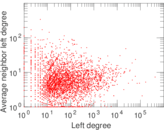
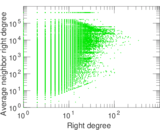
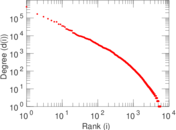
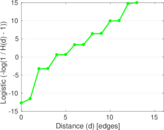
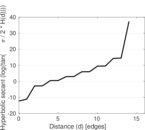
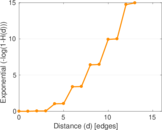
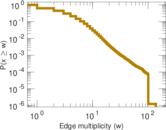
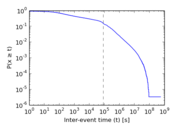
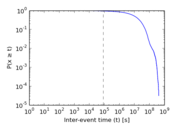
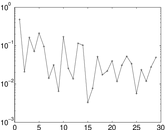
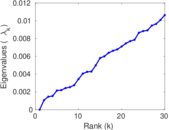
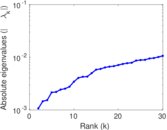
Plots


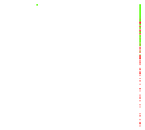


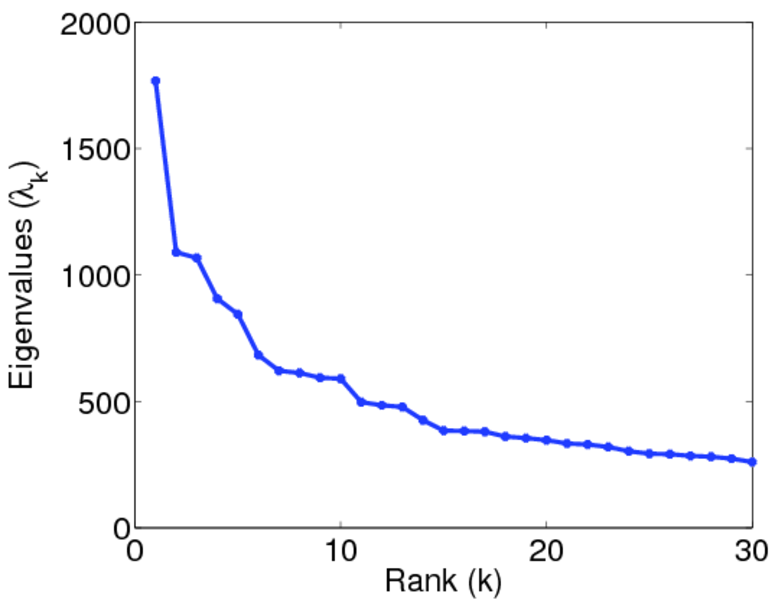
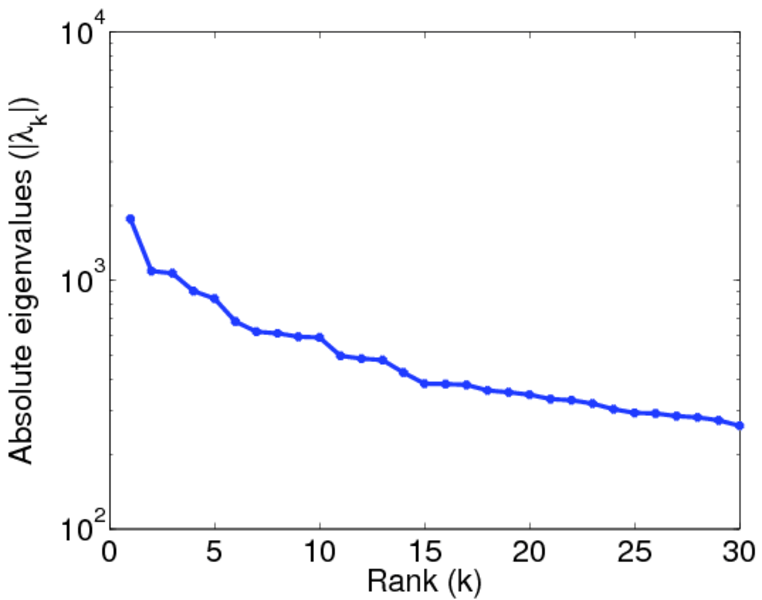
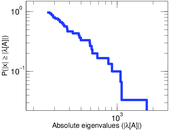
Matrix decompositions plots


Downloads
References
|
[1]
|
Jérôme Kunegis.
KONECT – The Koblenz Network Collection.
In Proc. Int. Conf. on World Wide Web Companion, pages
1343–1350, 2013.
[ http ]
|
|
[2]
|
Dominik Benz, Andreas Hotho, Robert Jäschke, Beate Krause, Folke Mitzlaff,
Christoph Schmitz, and Gerd Stumme.
The social bookmark and publication management system BibSonomy.
The VLDB J., 19(6):849–875, dec 2010.
|
 KONECT ‣ Networks ‣
Buy Me a Coffee
KONECT ‣ Networks ‣
Buy Me a Coffee