BibSonomy user–tag
This is the bipartite user–tag network from BibSonomy. Each edge represents a
tag assignment. The network allows multiple edge as users may use a tag for
multiple documents. The network is complete as it is taken from the official
BibSonomy dump.
Metadata
Statistics
| Size | n = | 210,467
|
| Left size | n1 = | 5,794
|
| Right size | n2 = | 204,673
|
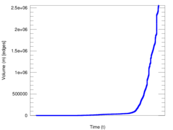
| Volume | m = | 2,555,080
|
| Unique edge count | m̿ = | 453,987
|
| Wedge count | s = | 991,843,705
|
| Claw count | z = | 4,596,638,282,952
|
| Cross count | x = | 19,818,609,712,155,388
|
| Square count | q = | 305,062,057
|
| 4-Tour count | T4 = | 6,409,052,574
|
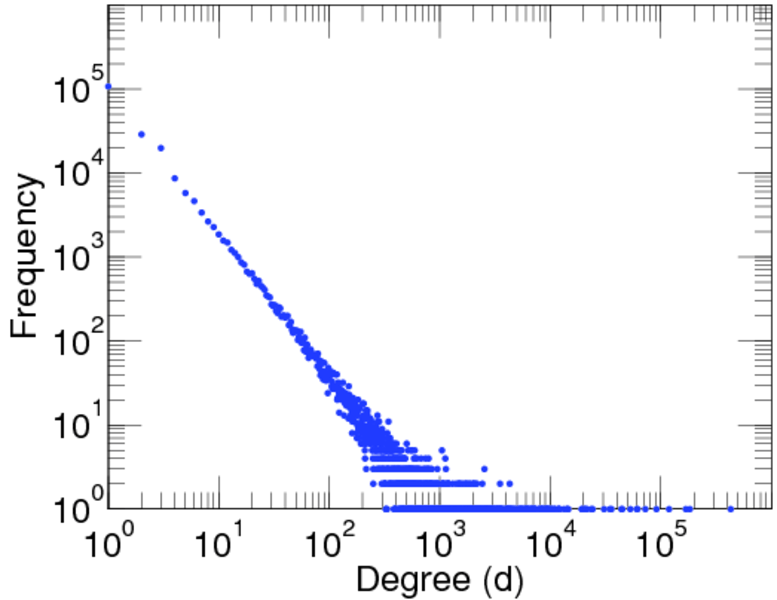
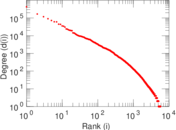
| Maximum degree | dmax = | 428,436
|
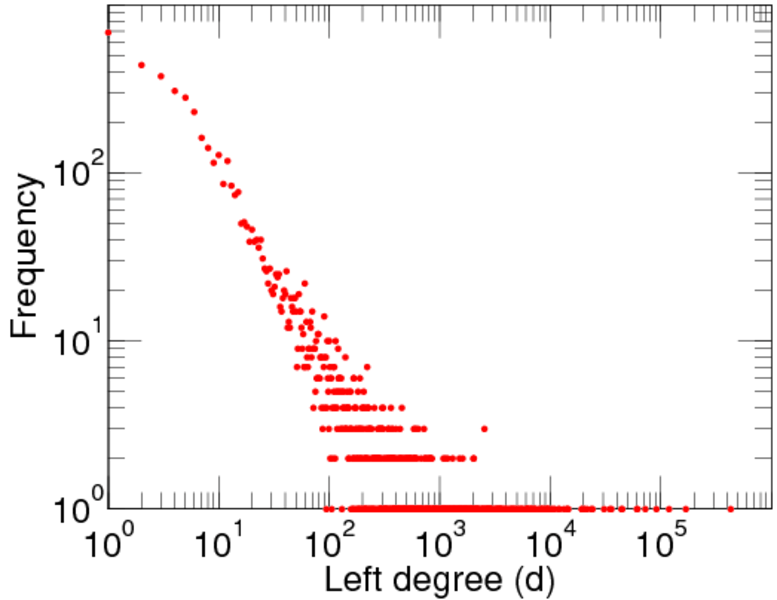
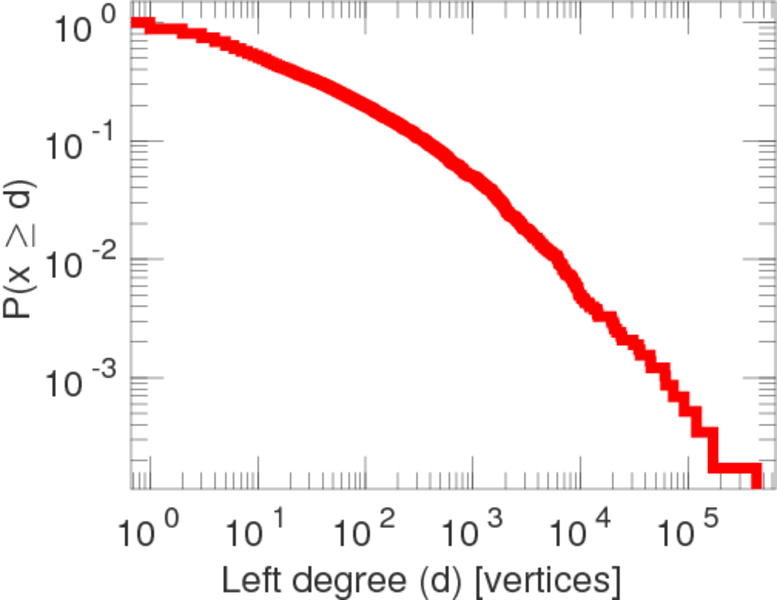
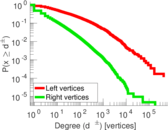
| Maximum left degree | d1max = | 428,436
|
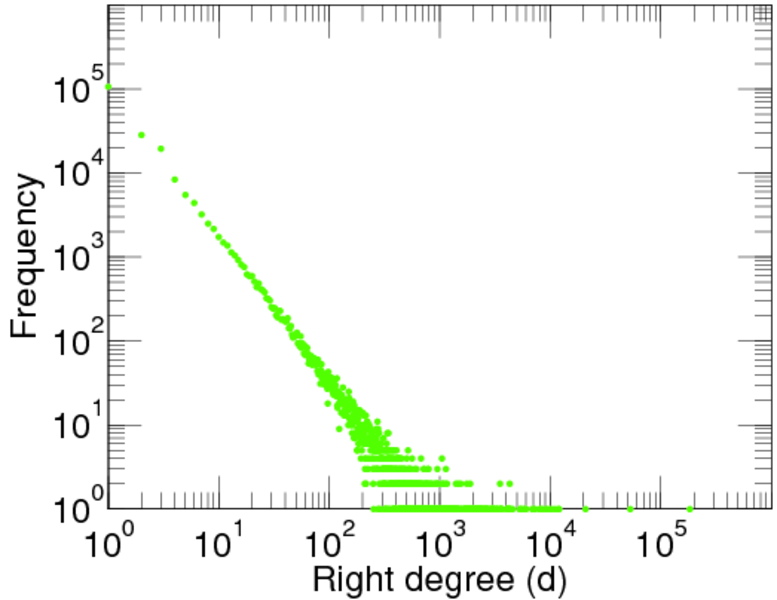
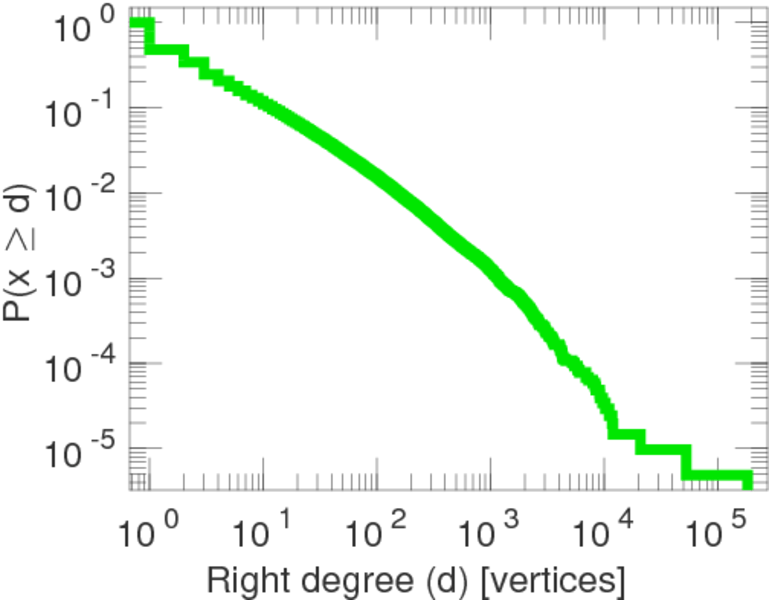
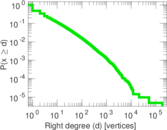
| Maximum right degree | d2max = | 182,908
|
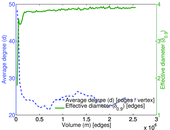
| Average degree | d = | 24.280 1
|
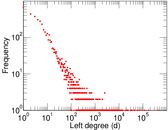
| Average left degree | d1 = | 440.987
|
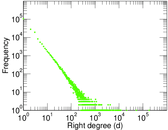
| Average right degree | d2 = | 12.483 7
|
| Fill | p = | 0.000 382 829
|
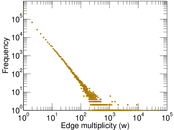
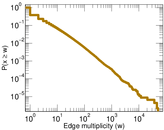
| Average edge multiplicity | m̃ = | 5.628 09
|
| Size of LCC | N = | 209,357
|
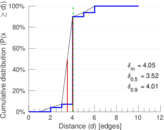
| Diameter | δ = | 12
|
| 50-Percentile effective diameter | δ0.5 = | 3.517 73
|
| 90-Percentile effective diameter | δ0.9 = | 4.011 15
|
| Median distance | δM = | 4
|
| Mean distance | δm = | 4.051 36
|
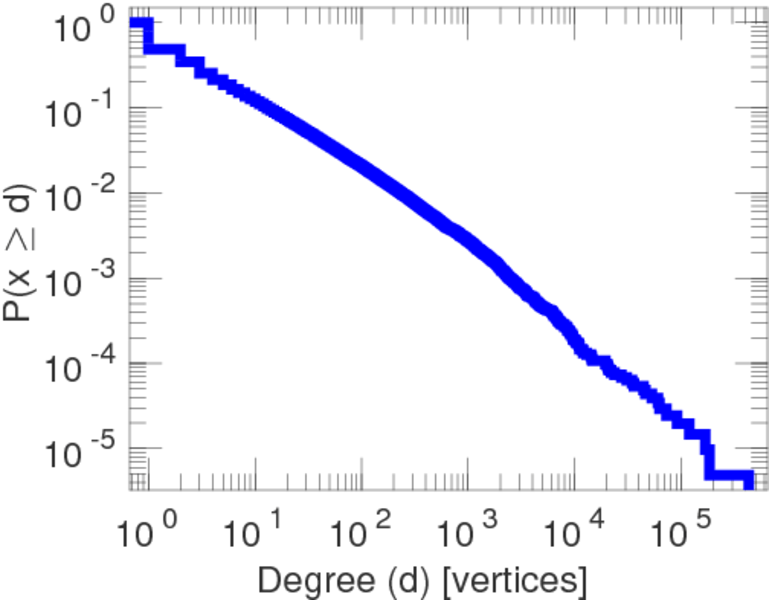
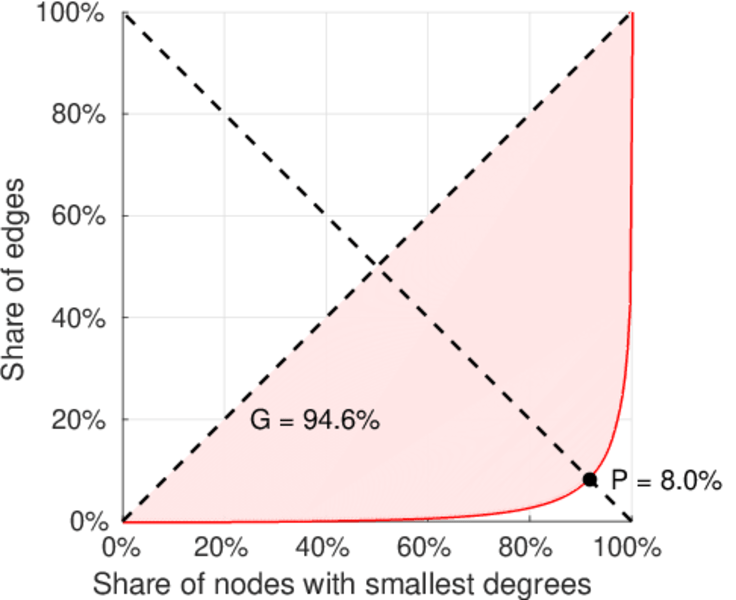
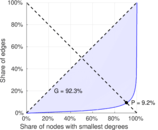
| Gini coefficient | G = | 0.926 128
|
| Balanced inequality ratio | P = | 0.089 785 8
|
| Left balanced inequality ratio | P1 = | 0.080 483 2
|
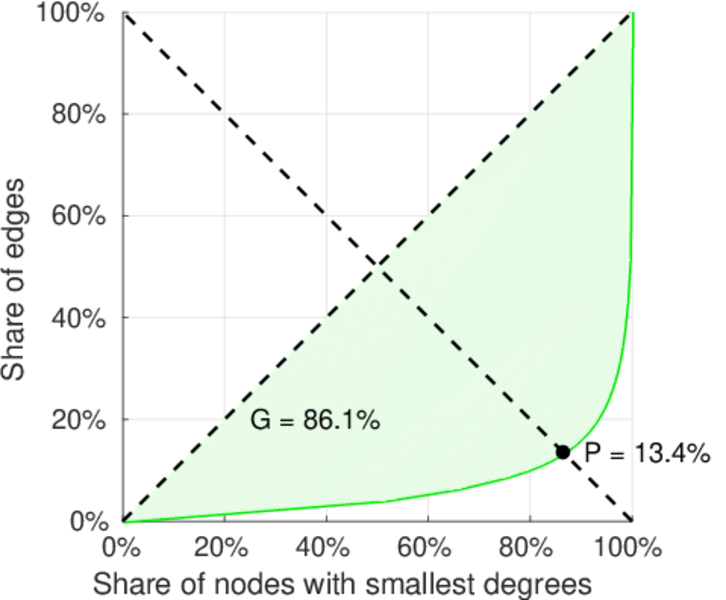
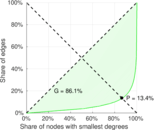
| Right balanced inequality ratio | P2 = | 0.134 076
|
| Relative edge distribution entropy | Her = | 0.772 367
|
| Power law exponent | γ = | 3.674 91
|
| Tail power law exponent | γt = | 1.961 00
|
| Tail power law exponent with p | γ3 = | 1.961 00
|
| p-value | p = | 0.271 000
|
| Left tail power law exponent with p | γ3,1 = | 1.681 00
|
| Left p-value | p1 = | 0.000 00
|
| Right tail power law exponent with p | γ3,2 = | 2.201 00
|
| Right p-value | p2 = | 0.000 00
|
| Degree assortativity | ρ = | −0.152 058
|
| Degree assortativity p-value | pρ = | 0.000 00
|
| Spectral norm | α = | 62,391.4
|
| Algebraic connectivity | a = | 0.016 601 9
|
| Spectral separation | |λ1[A] / λ2[A]| = | 1.105 36
|
| Controllability | C = | 199,969
|
| Relative controllability | Cr = | 0.950 120
|
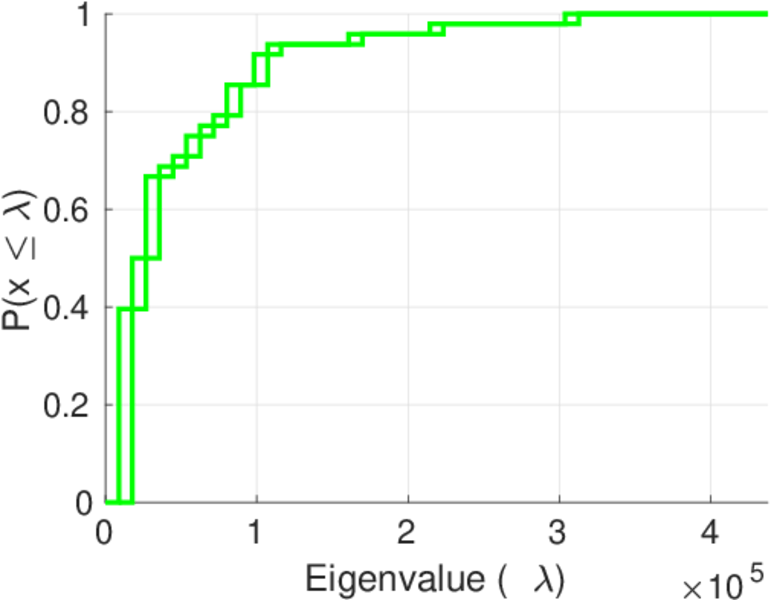
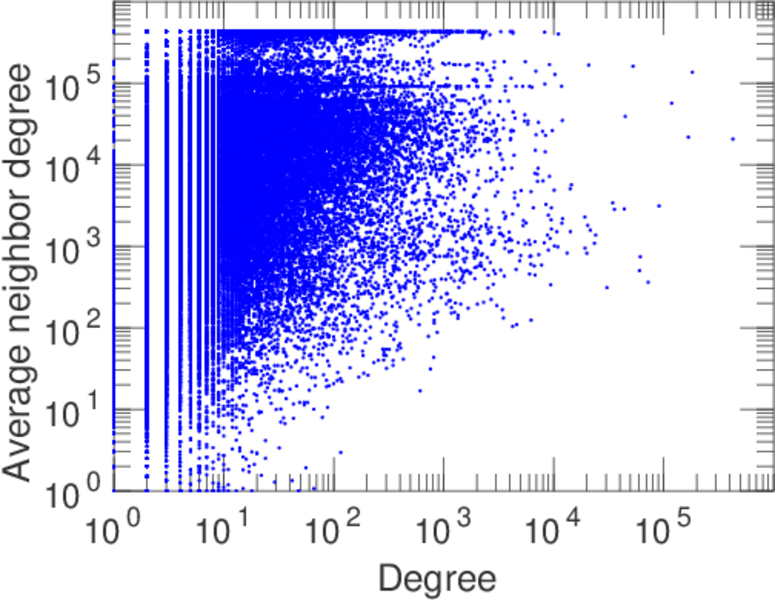
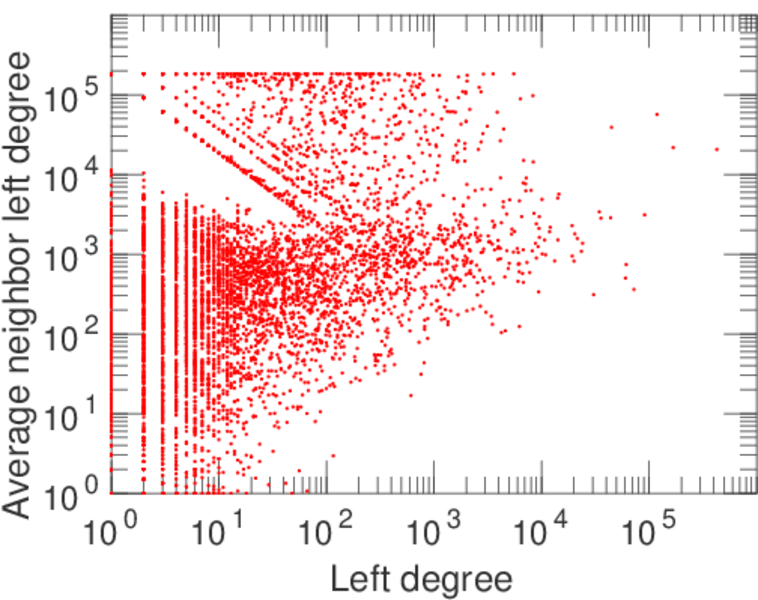
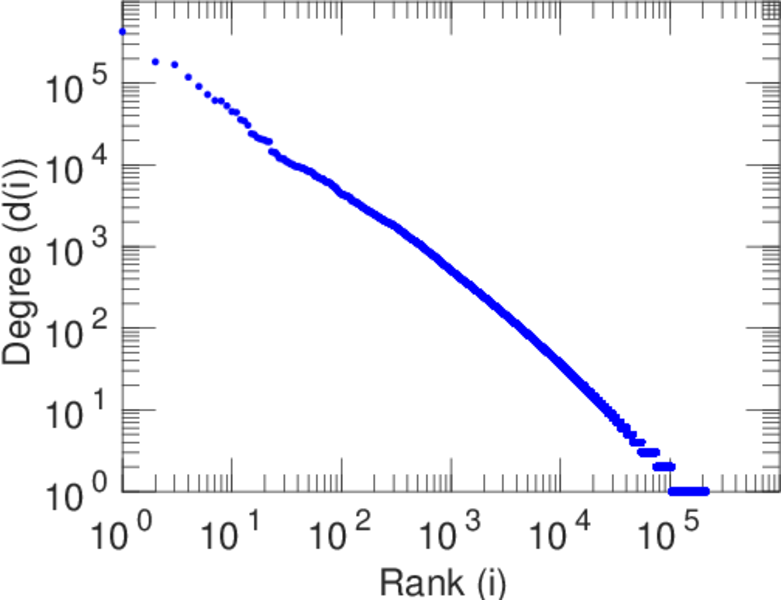
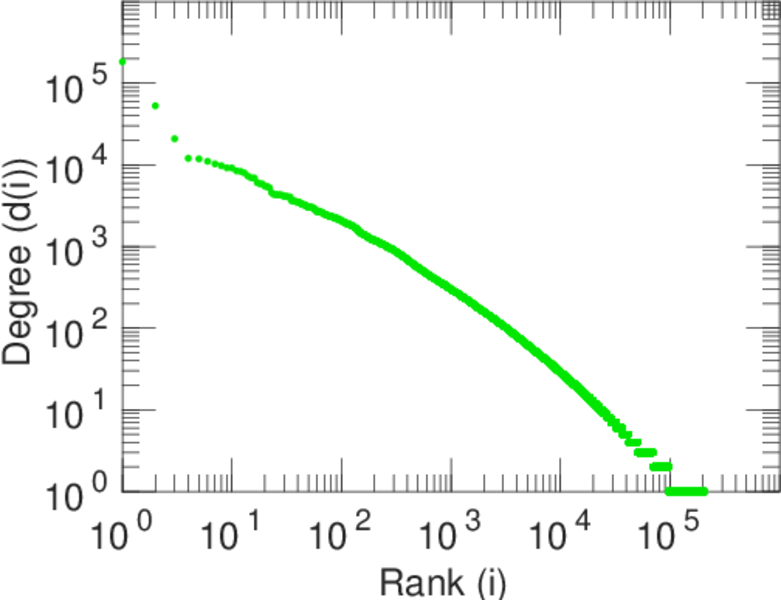
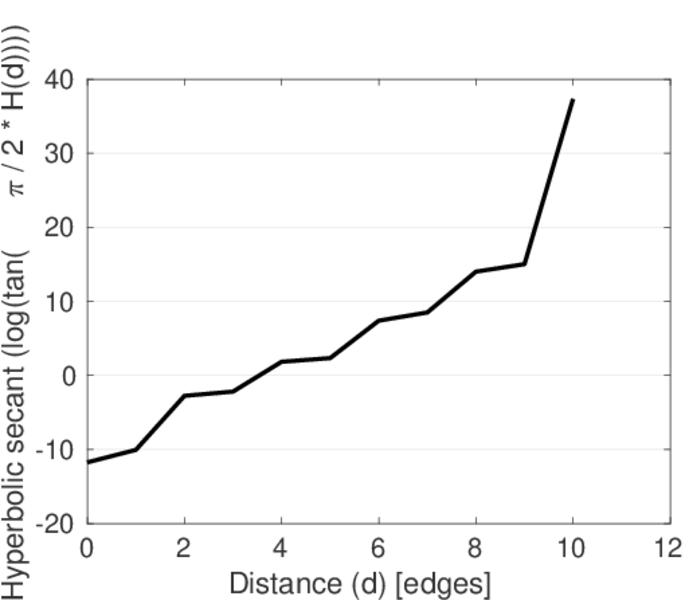
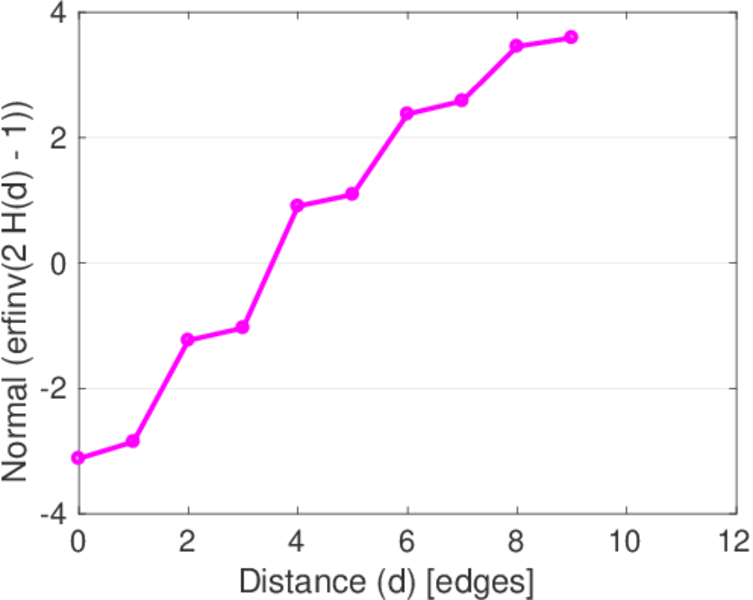
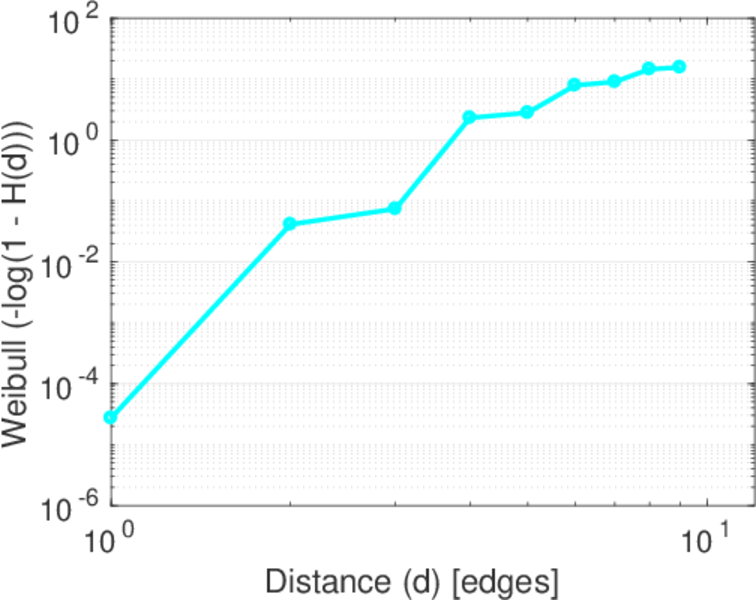
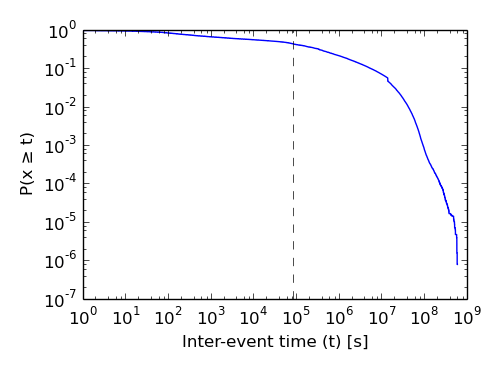
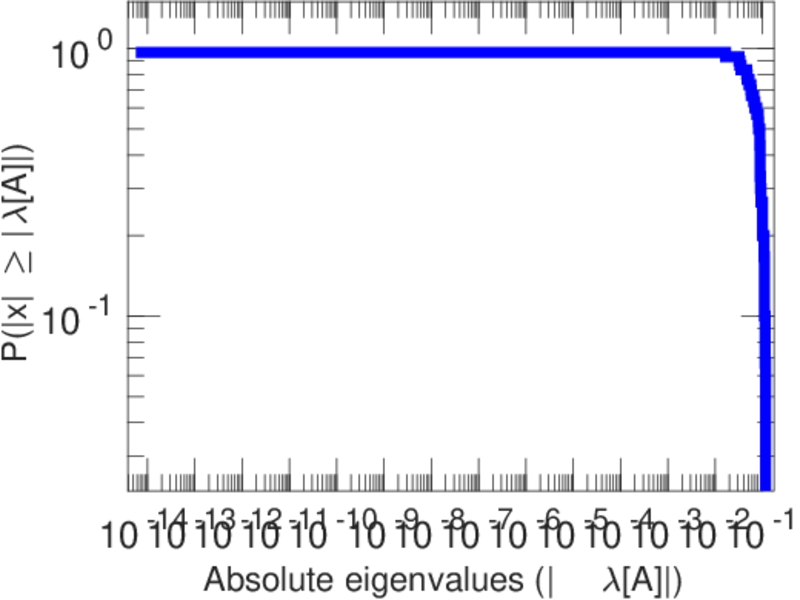
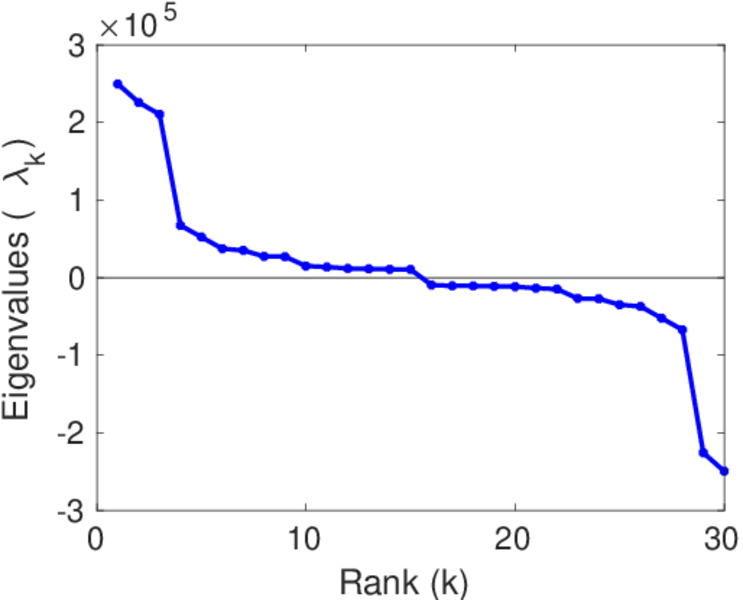
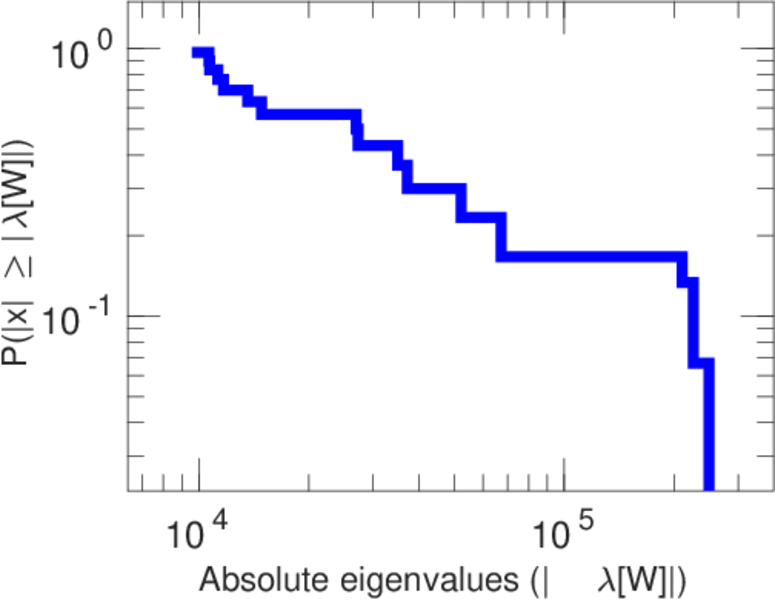
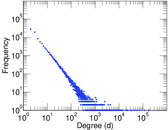
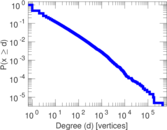
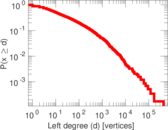
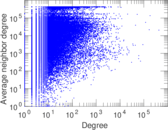
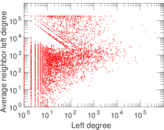
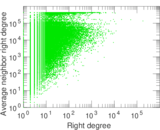
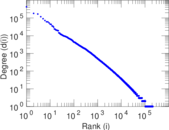
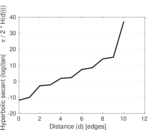
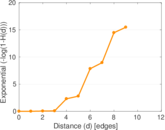
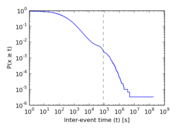
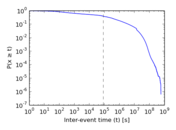
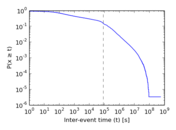
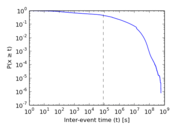
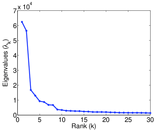
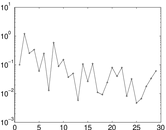
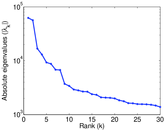
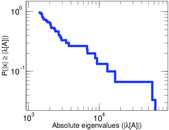
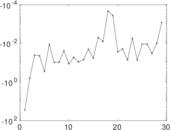
Plots


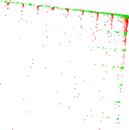
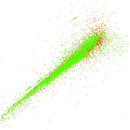
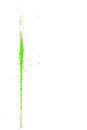


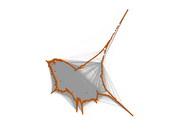
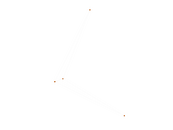


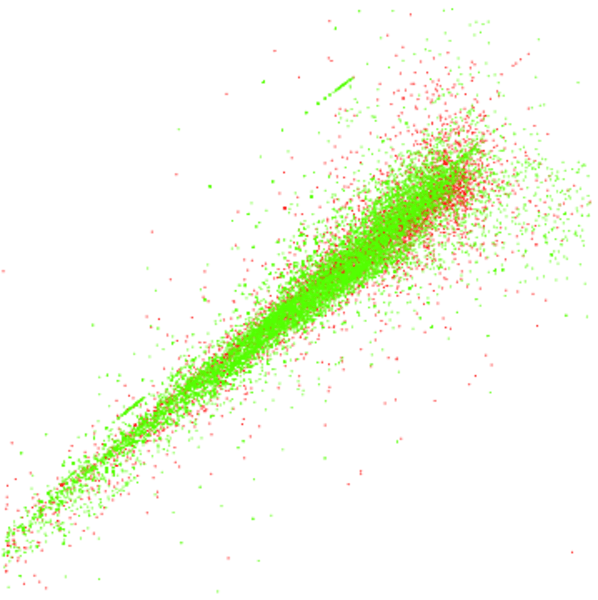
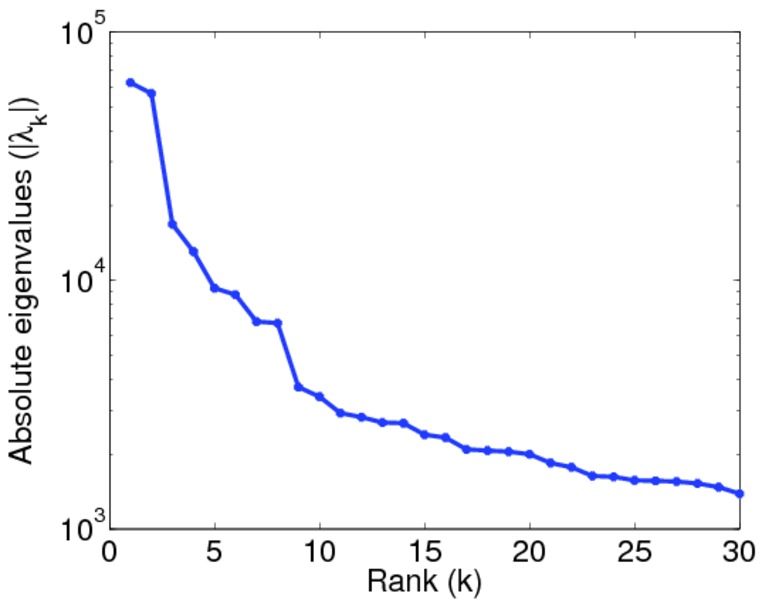
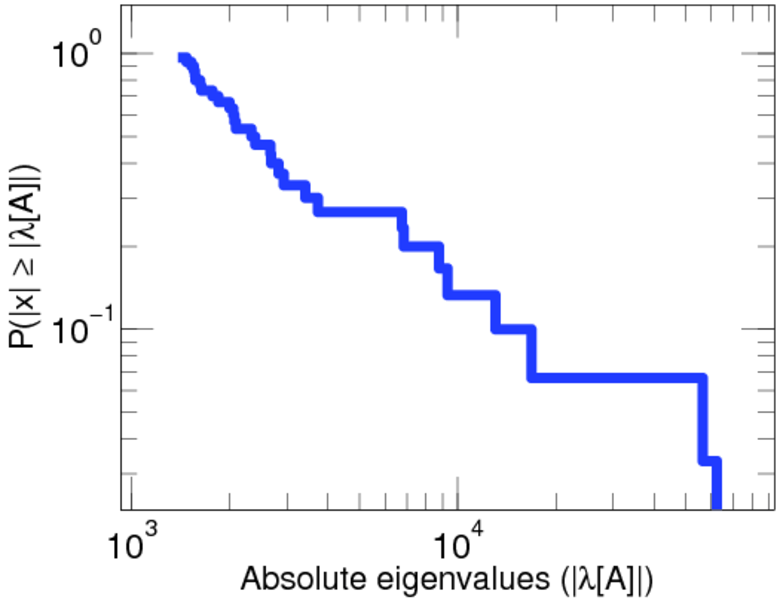
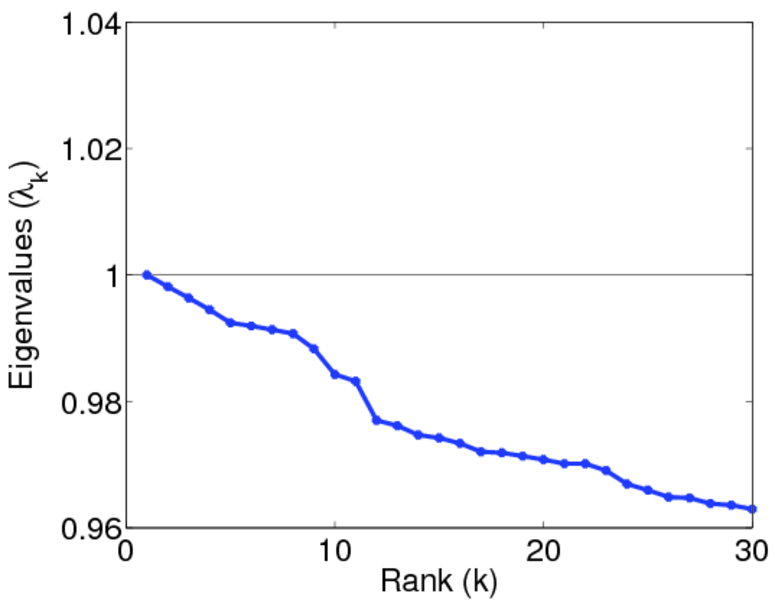
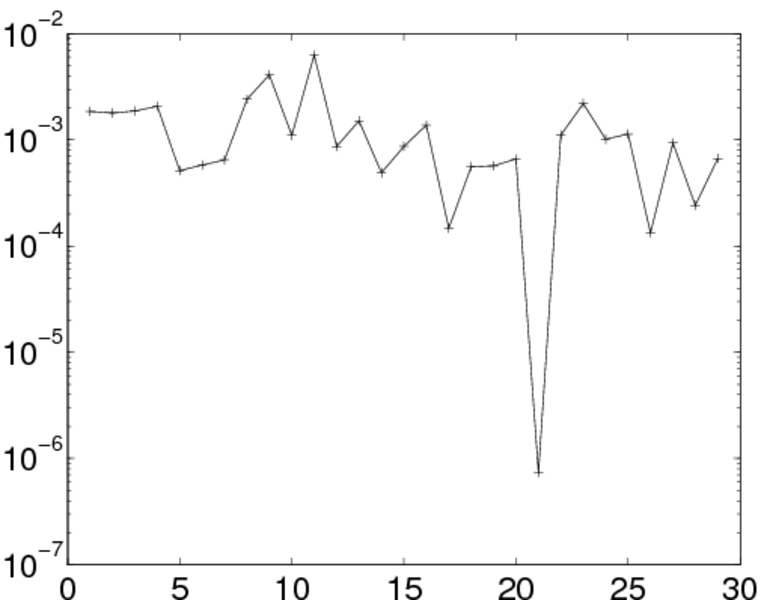
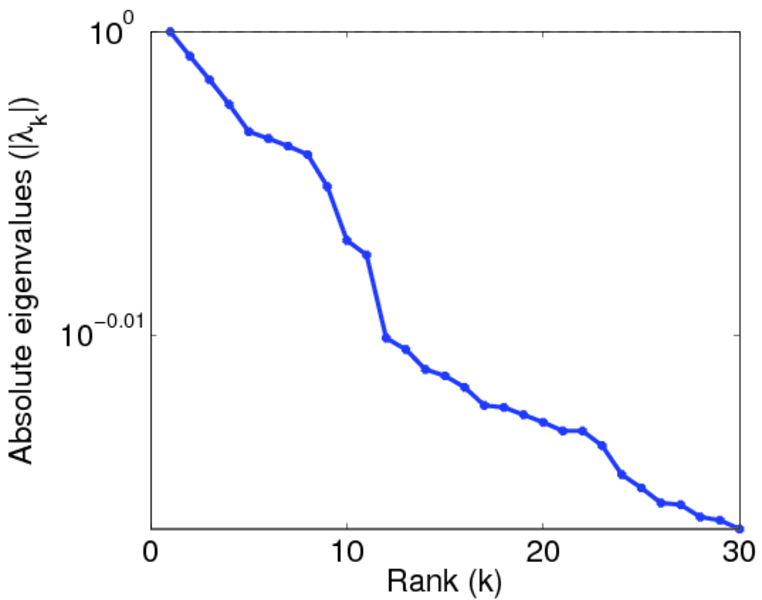
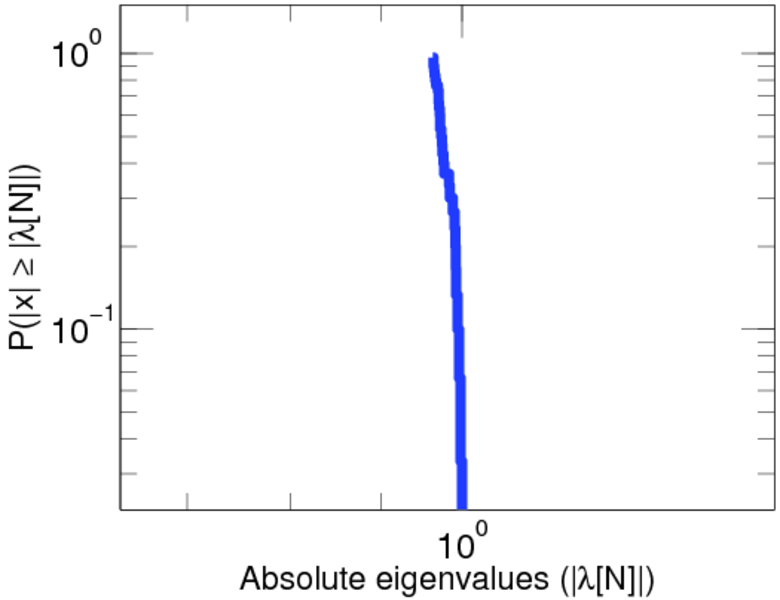
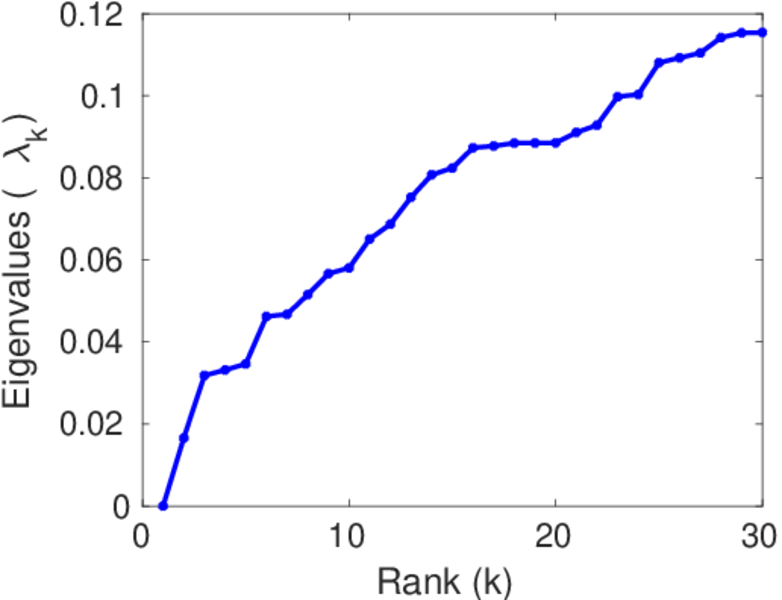
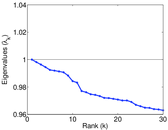
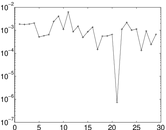
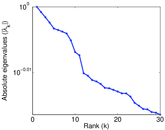
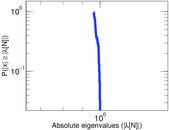
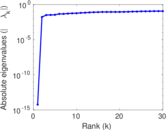
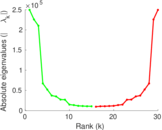
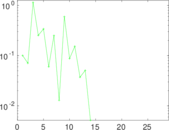
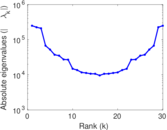
Matrix decompositions plots


Downloads
References
|
[1]
|
Jérôme Kunegis.
KONECT – The Koblenz Network Collection.
In Proc. Int. Conf. on World Wide Web Companion, pages
1343–1350, 2013.
[ http ]
|
|
[2]
|
Dominik Benz, Andreas Hotho, Robert Jäschke, Beate Krause, Folke Mitzlaff,
Christoph Schmitz, and Gerd Stumme.
The social bookmark and publication management system BibSonomy.
The VLDB J., 19(6):849–875, dec 2010.
|
 KONECT ‣ Networks ‣
Buy Me a Coffee
KONECT ‣ Networks ‣
Buy Me a Coffee