CiteULike tag–item
This is the bipartite network of tags and publications in CiteULike. Each edge
represents a tag assignment that connects a tag and a publication. Since the
same tag can be assigned to a single publication by multiple users, the network
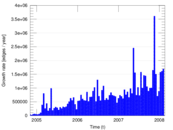
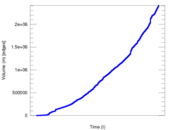
contains multiple edges. The edges are annotated with the creation time of the
tag assignment.
Metadata
Statistics
| Size | n = | 885,046
|
| Left size | n1 = | 153,277
|
| Right size | n2 = | 731,769
|
| Volume | m = | 2,411,819
|
| Unique edge count | m̿ = | 2,338,554
|
| Wedge count | s = | 21,880,206,884
|
| Claw count | z = | 1,213,193,044,873,518
|
| Cross count | x = | 5.511 04 × 1019
|
| Square count | q = | 383,860,055
|
| 4-Tour count | T4 = | 90,596,413,384
|
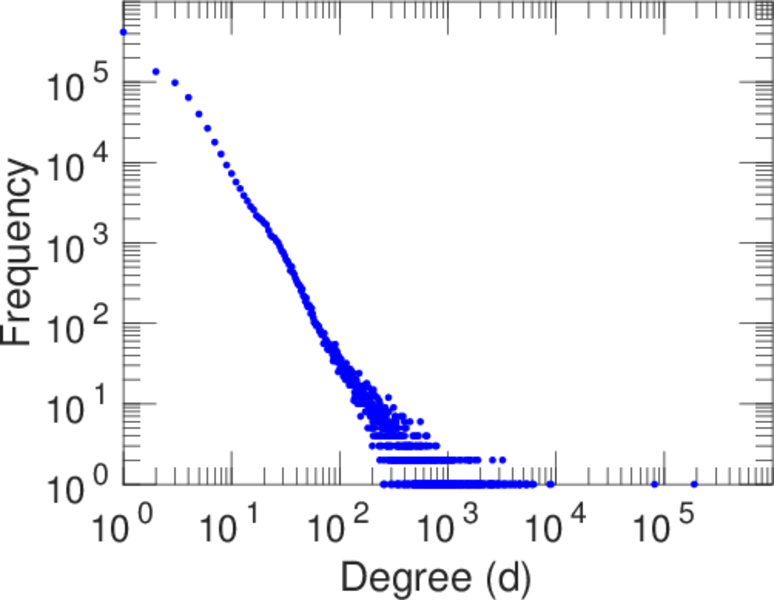
| Maximum degree | dmax = | 189,295
|
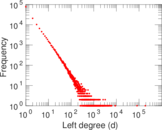
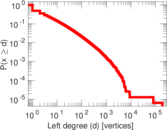
| Maximum left degree | d1max = | 189,295
|
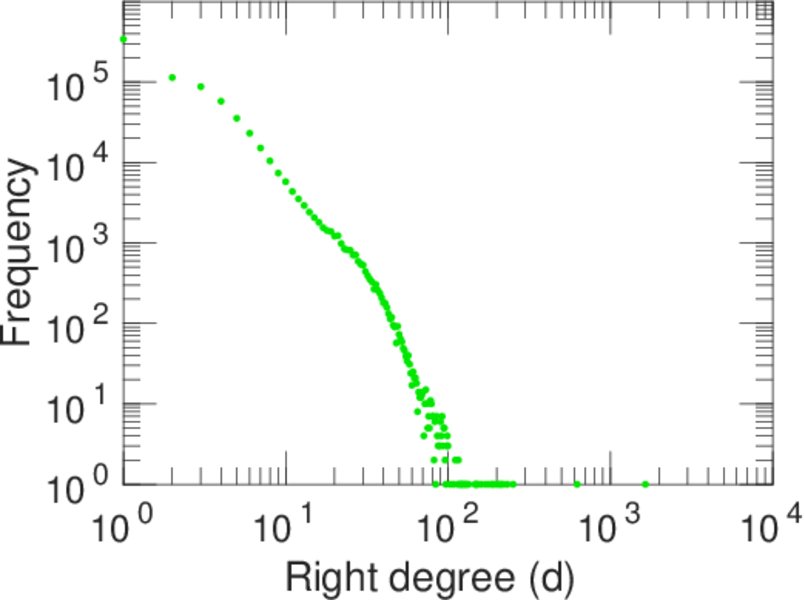
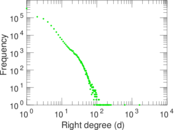
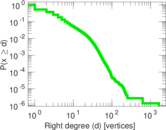
| Maximum right degree | d2max = | 1,646
|
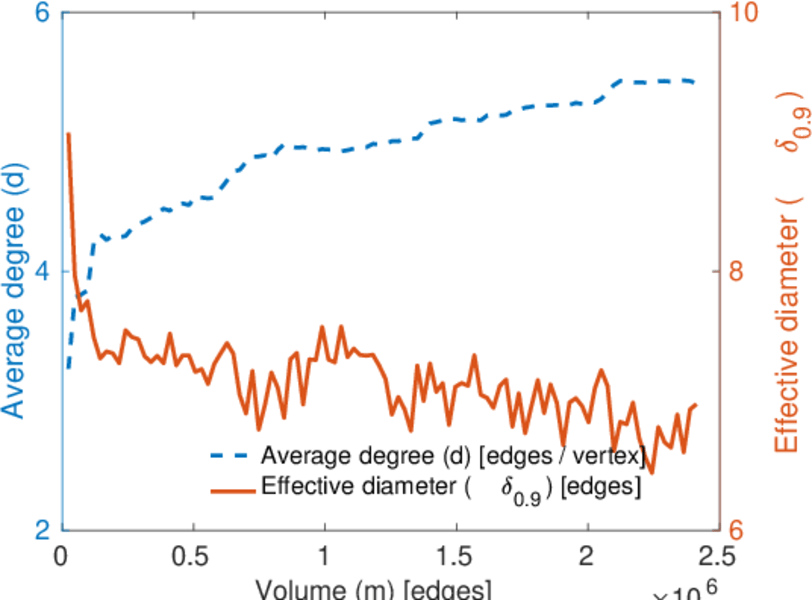
| Average degree | d = | 5.450 16
|
| Average left degree | d1 = | 15.735 0
|
| Average right degree | d2 = | 3.295 87
|
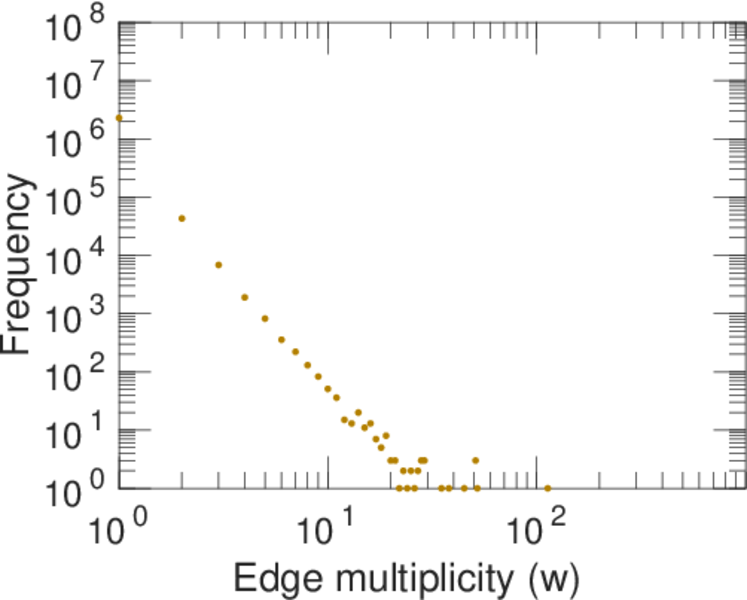
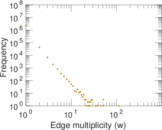
| Average edge multiplicity | m̃ = | 1.031 33
|
| Size of LCC | N = | 857,460
|
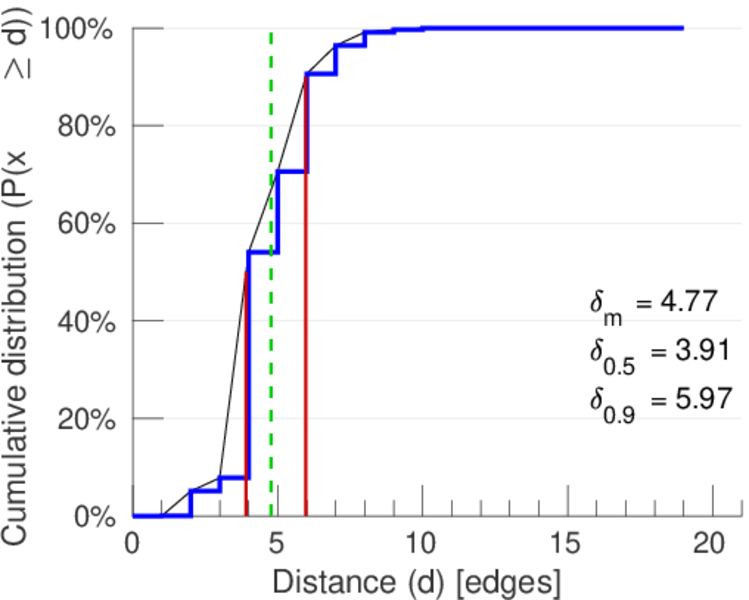
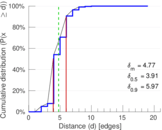
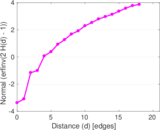
| Diameter | δ = | 24
|
| 50-Percentile effective diameter | δ0.5 = | 3.912 25
|
| 90-Percentile effective diameter | δ0.9 = | 5.970 78
|
| Median distance | δM = | 4
|
| Mean distance | δm = | 4.768 26
|
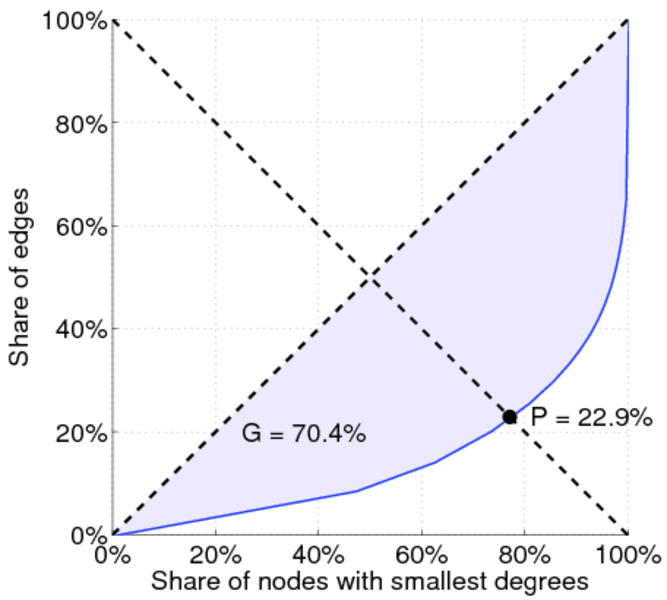
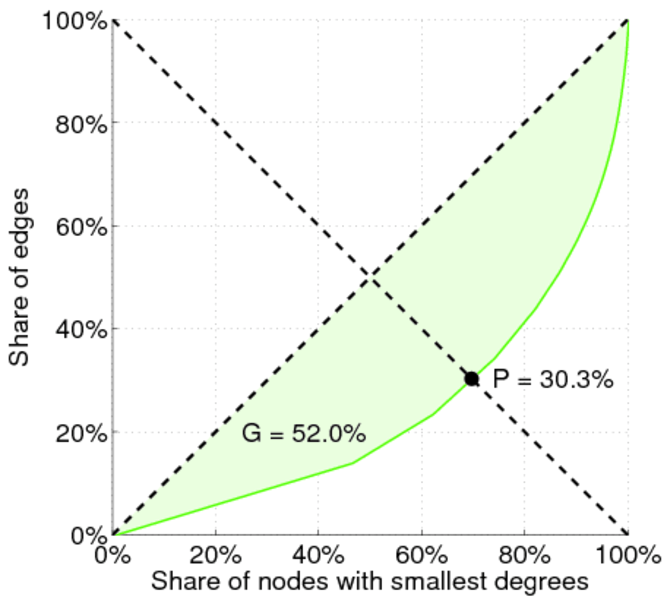
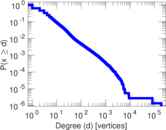
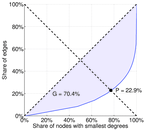
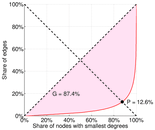
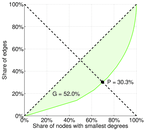
| Gini coefficient | G = | 0.707 021
|
| Balanced inequality ratio | P = | 0.226 626
|
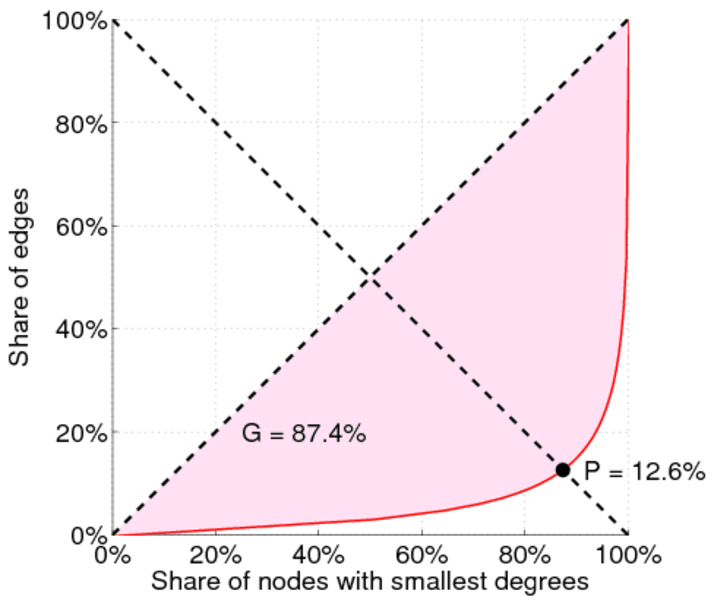
| Left balanced inequality ratio | P1 = | 0.126 018
|
| Right balanced inequality ratio | P2 = | 0.303 091
|
| Relative edge distribution entropy | Her = | 0.847 063
|
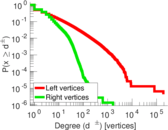
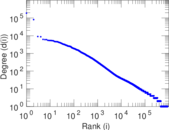
| Power law exponent | γ = | 2.325 35
|
| Tail power law exponent | γt = | 2.331 00
|
| Tail power law exponent with p | γ3 = | 2.331 00
|
| p-value | p = | 0.000 00
|
| Left tail power law exponent with p | γ3,1 = | 1.721 00
|
| Left p-value | p1 = | 0.000 00
|
| Right tail power law exponent with p | γ3,2 = | 5.501 00
|
| Right p-value | p2 = | 0.031 000 0
|
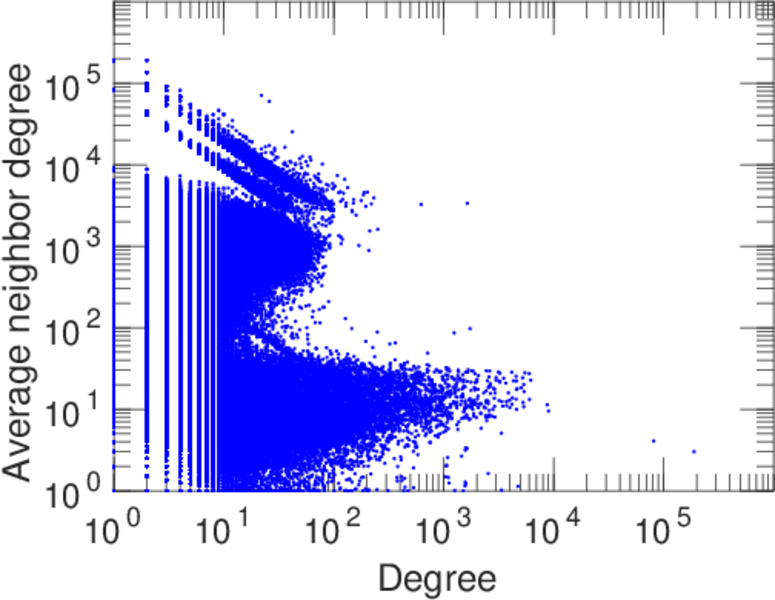
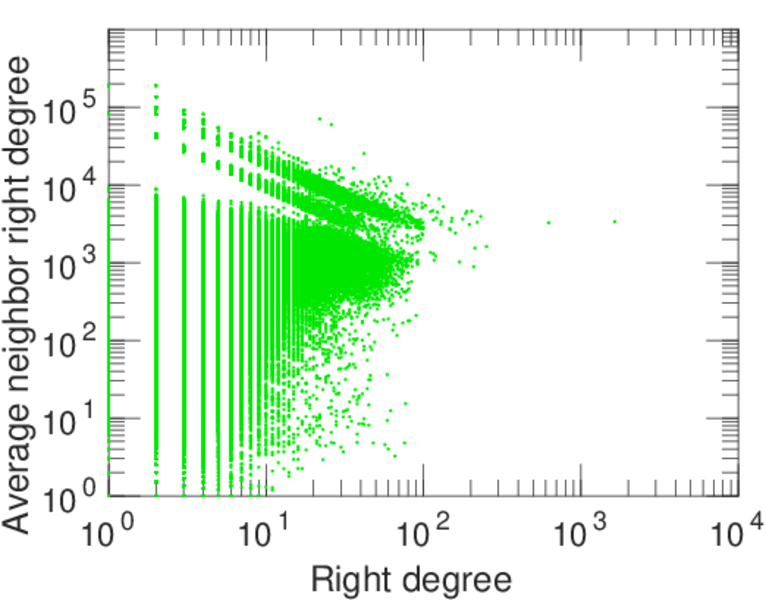
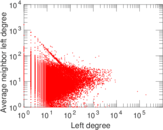
| Degree assortativity | ρ = | −0.083 370 6
|
| Degree assortativity p-value | pρ = | 0.000 00
|
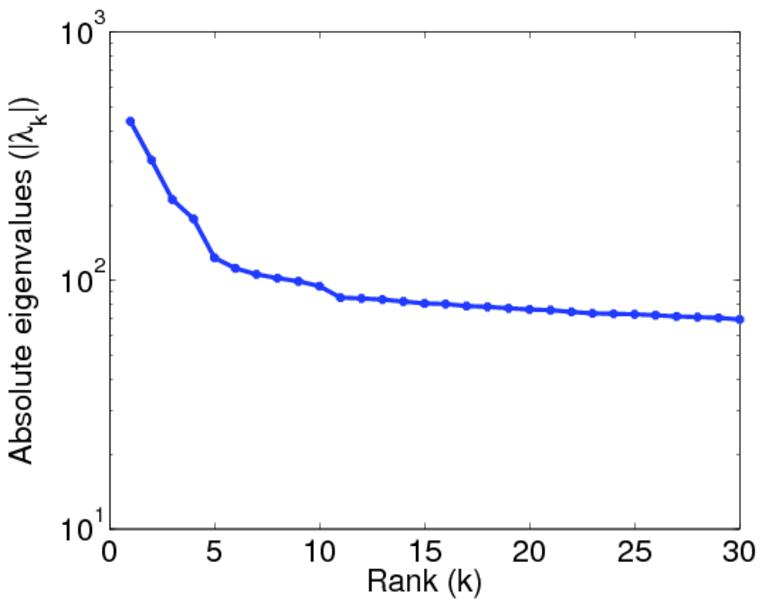
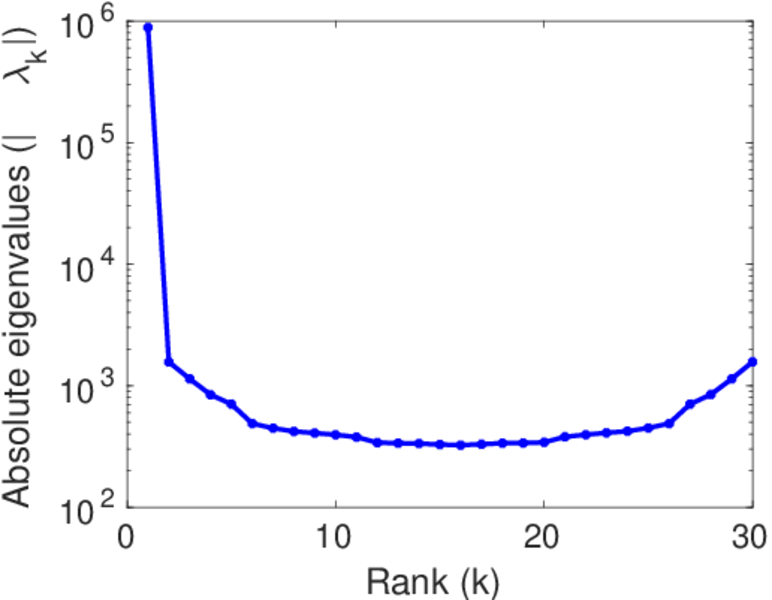
| Spectral norm | α = | 436.053
|
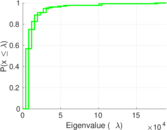
| Algebraic connectivity | a = | 0.001 147 49
|
| Spectral separation | |λ1[A] / λ2[A]| = | 1.430 65
|
| Controllability | C = | 645,431
|
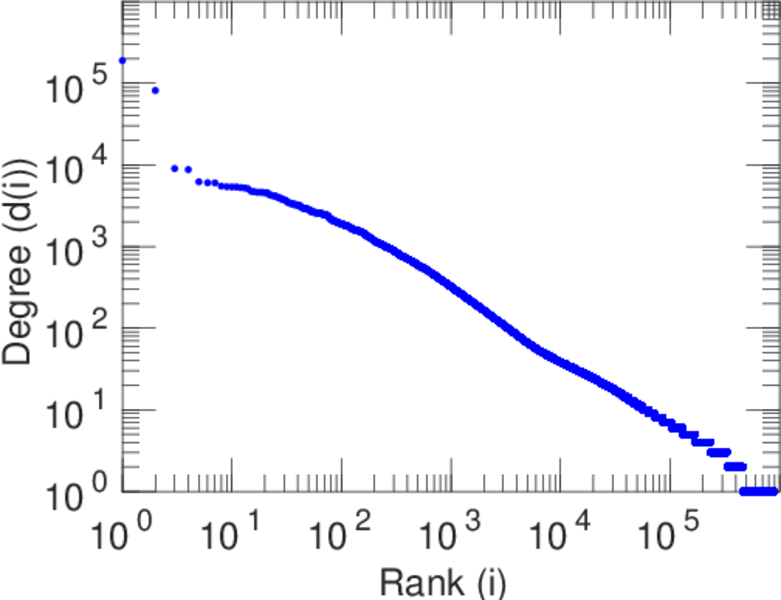
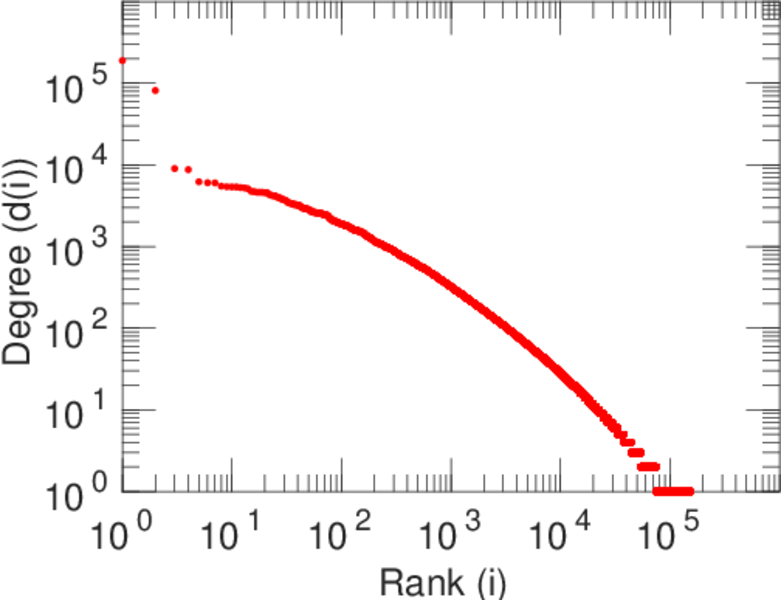
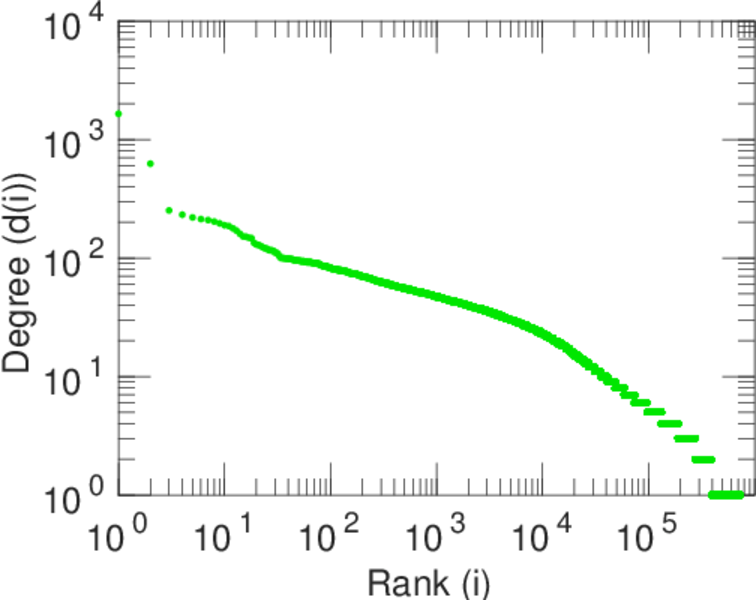
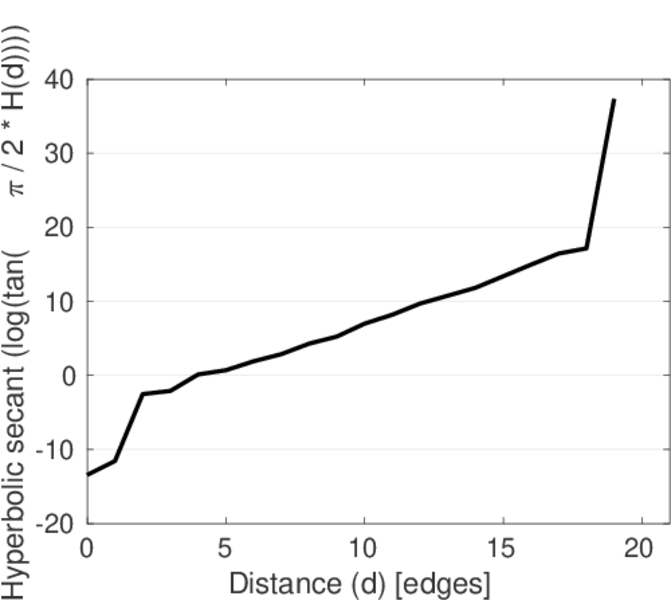
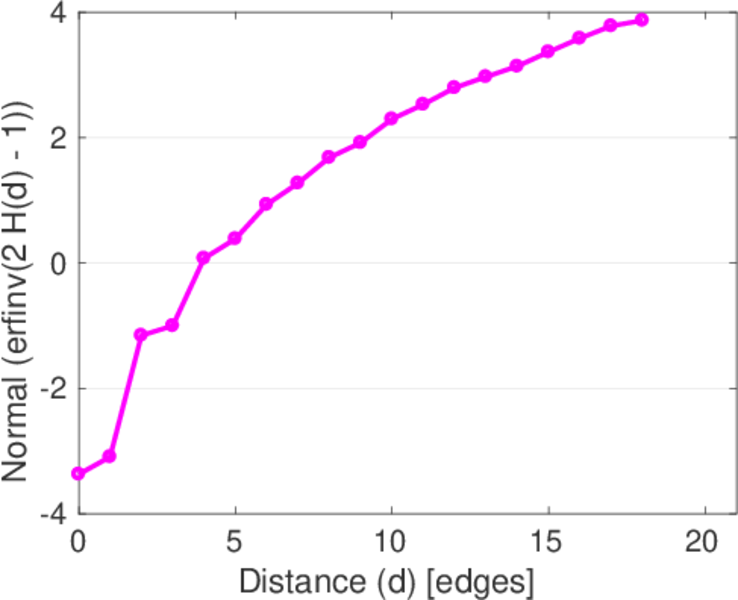
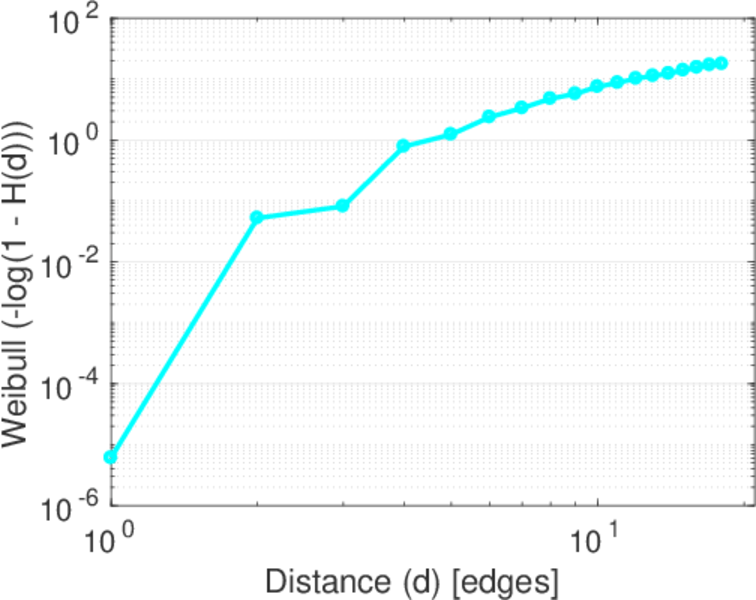
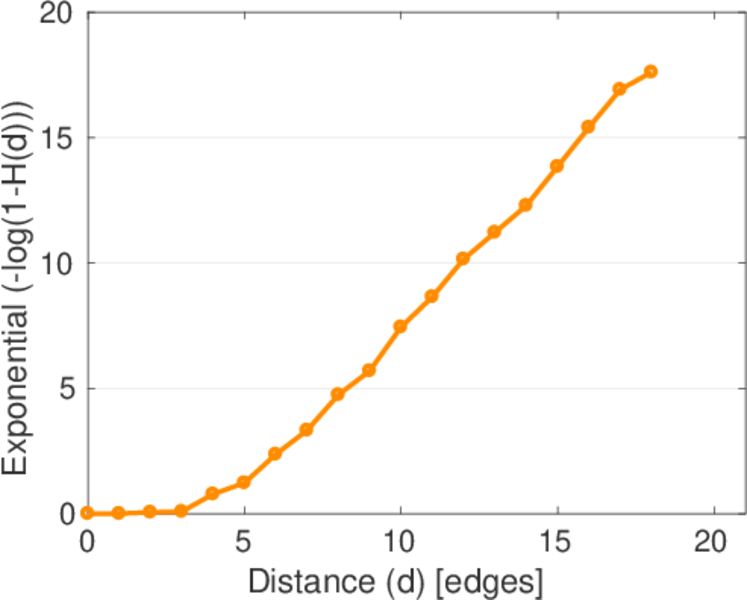
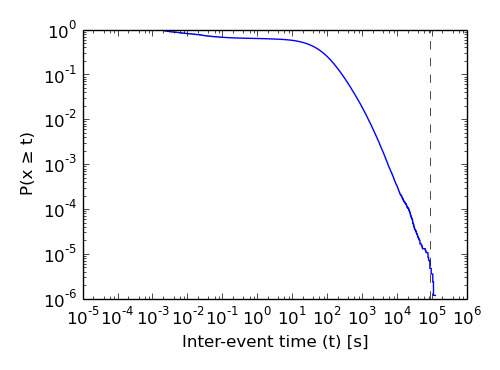
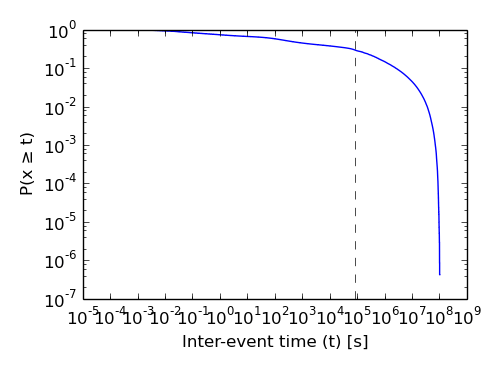
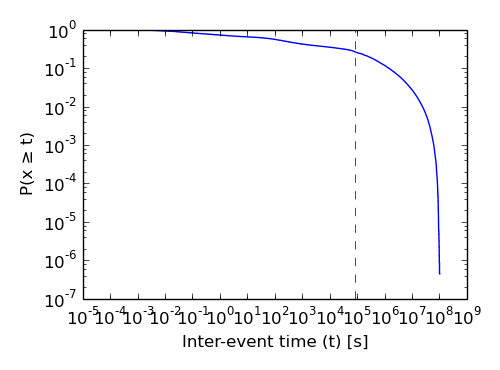
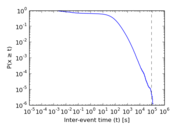
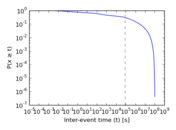
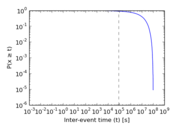
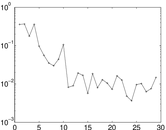
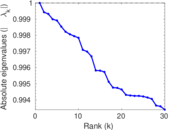
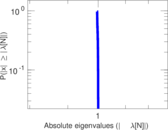
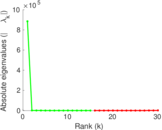
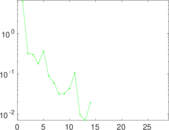
Plots


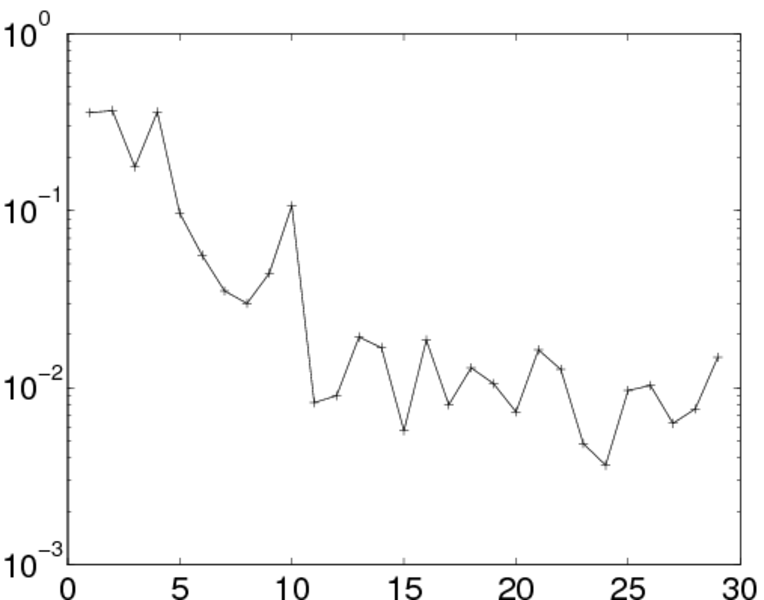
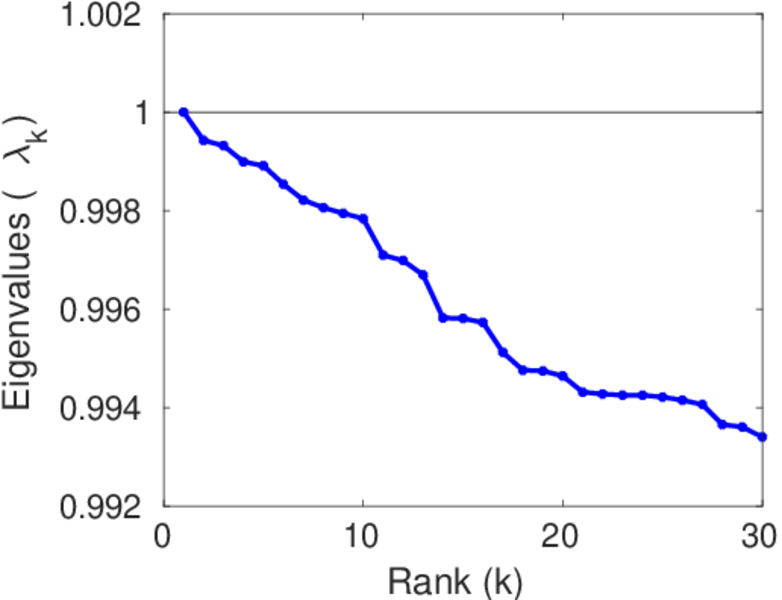
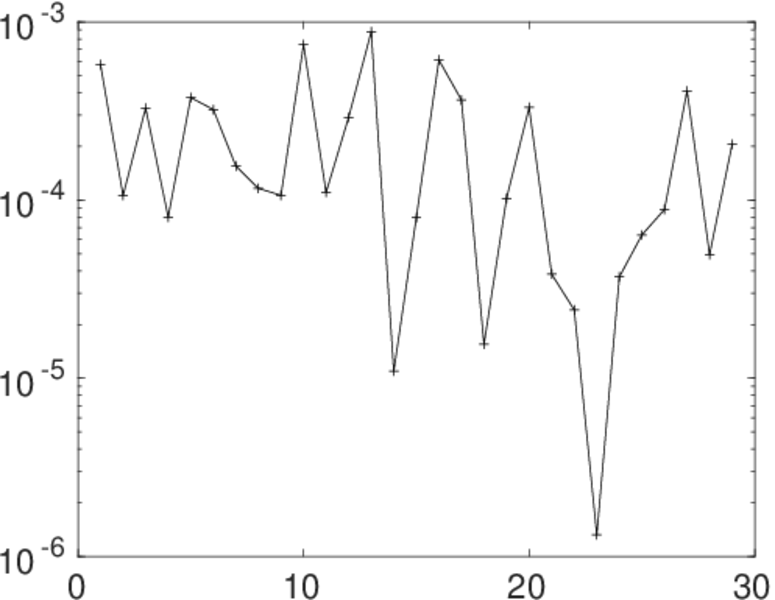
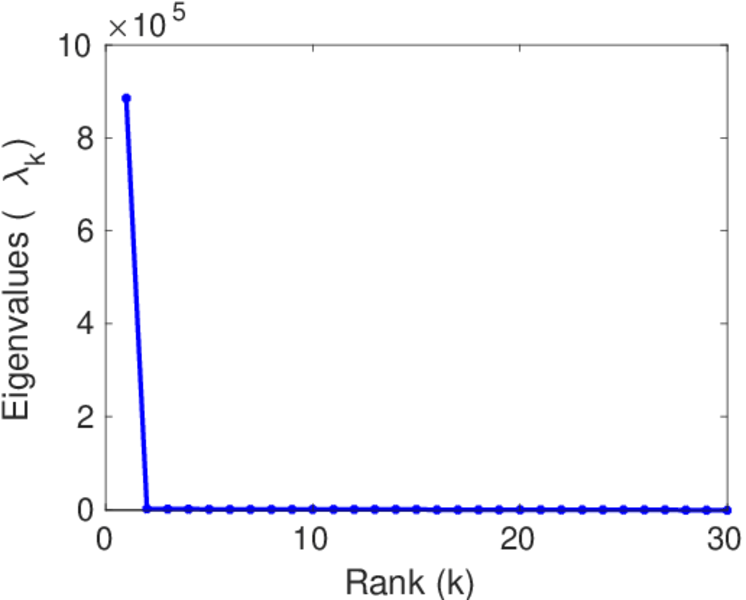
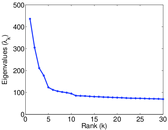
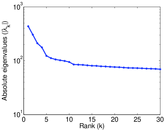
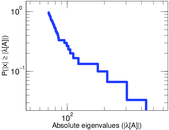
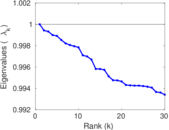
Matrix decompositions plots


Downloads
References
|
[1]
|
Jérôme Kunegis.
KONECT – The Koblenz Network Collection.
In Proc. Int. Conf. on World Wide Web Companion, pages
1343–1350, 2013.
[ http ]
|
|
[2]
|
Kevin Emamy and Richard Cameron.
CiteULike: A researcher's social bookmarking service.
Ariadne, (51), 2007.
|
 KONECT ‣ Networks ‣
Buy Me a Coffee
KONECT ‣ Networks ‣
Buy Me a Coffee