CiteULike user–item
This is the bipartite network of users and publications in CiteULike. Each
edge represents a tag assignment that connects a users and a publication.
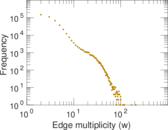
Since a user can be assign multiple tags to a publication, the network contains
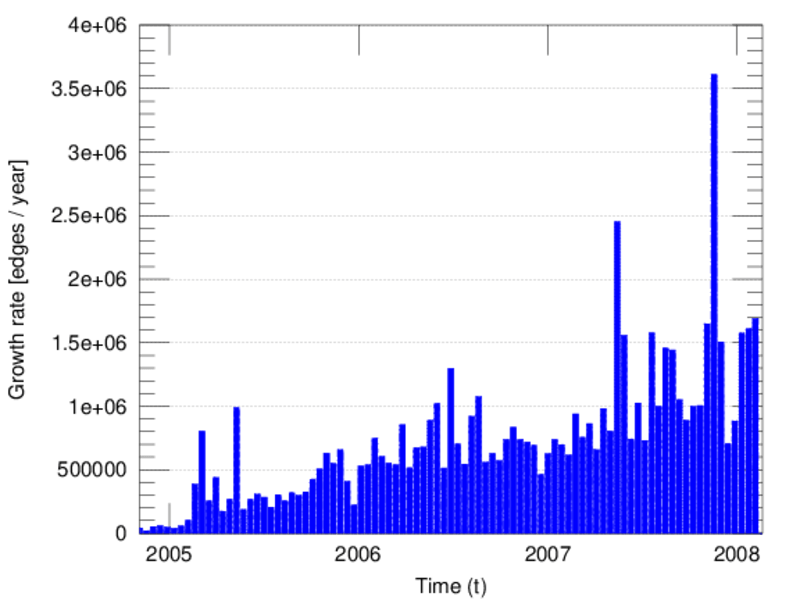
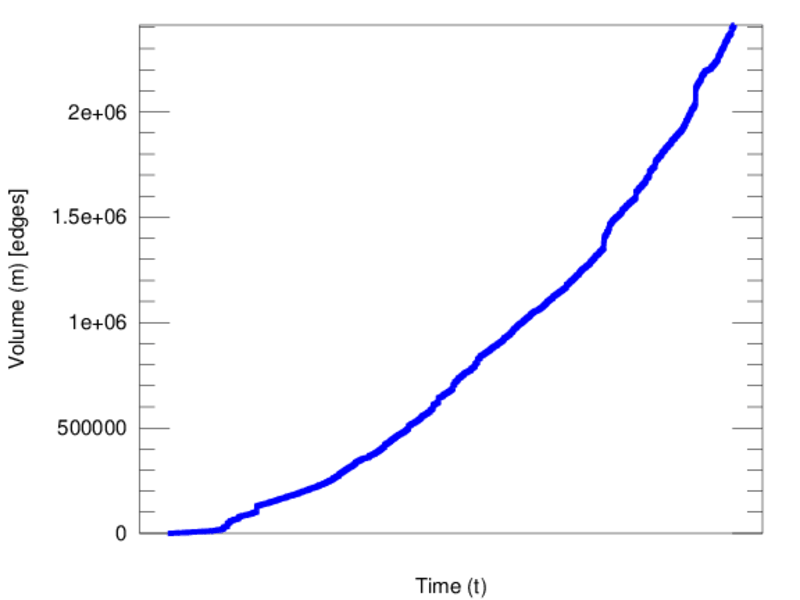
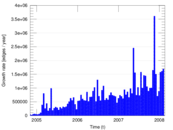
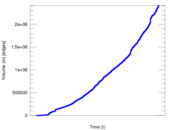
multiple edges. The edges are annotated with the creation time of the tag
assignment.
Metadata
Statistics
| Size | n = | 754,484
|
| Left size | n1 = | 22,715
|
| Right size | n2 = | 731,769
|
| Volume | m = | 2,411,819
|
| Unique edge count | m̿ = | 842,426
|
| Wedge count | s = | 343,677,541
|
| Claw count | z = | 476,035,640,534
|
| Cross count | x = | 909,343,585,975,693
|
| Square count | q = | 962,735
|
| 4-Tour count | T4 = | 1,384,098,060
|
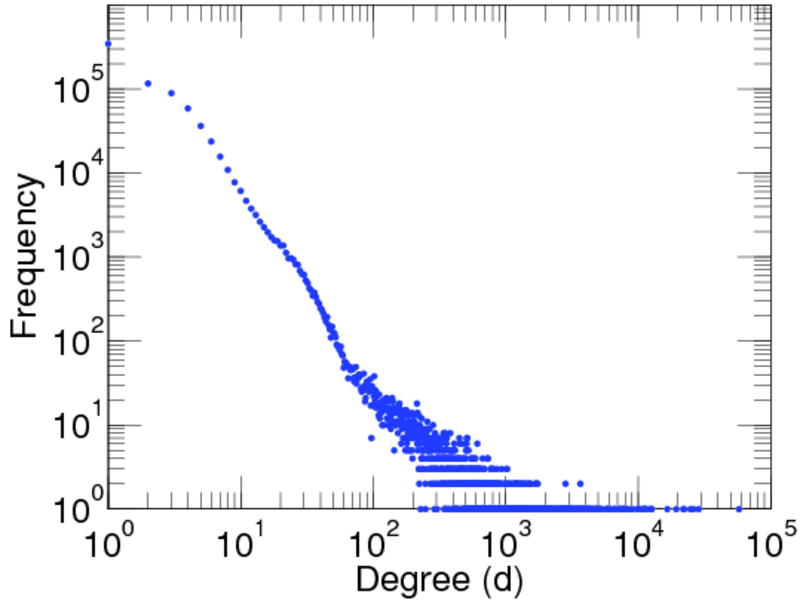
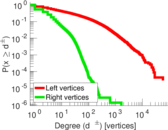
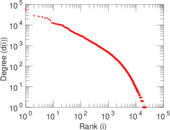
| Maximum degree | dmax = | 57,706
|
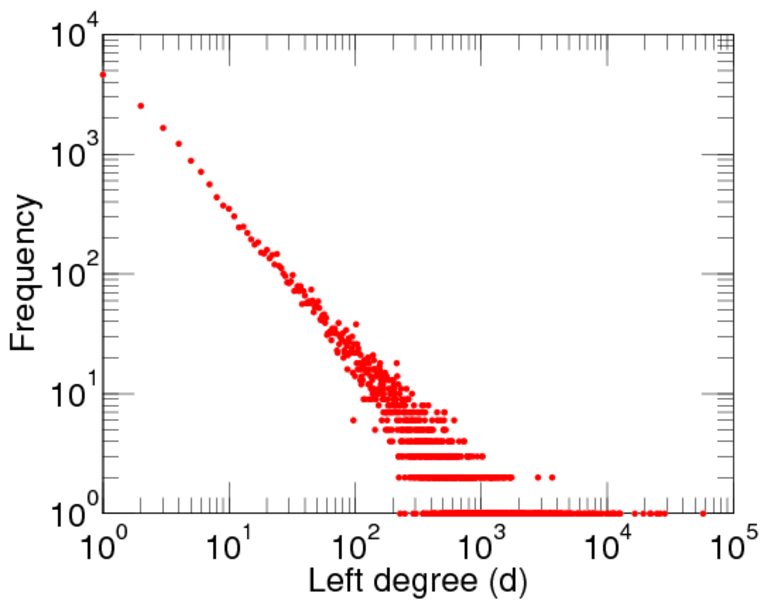
| Maximum left degree | d1max = | 57,706
|
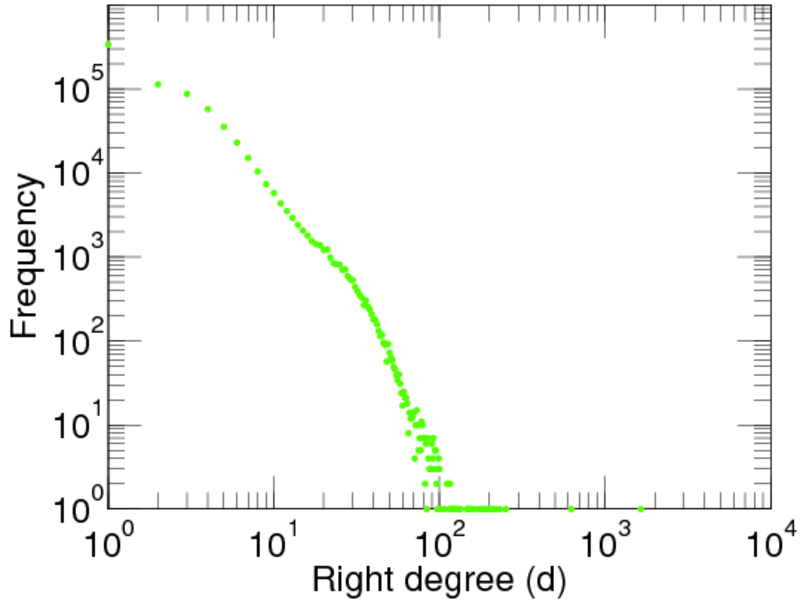
| Maximum right degree | d2max = | 1,646
|
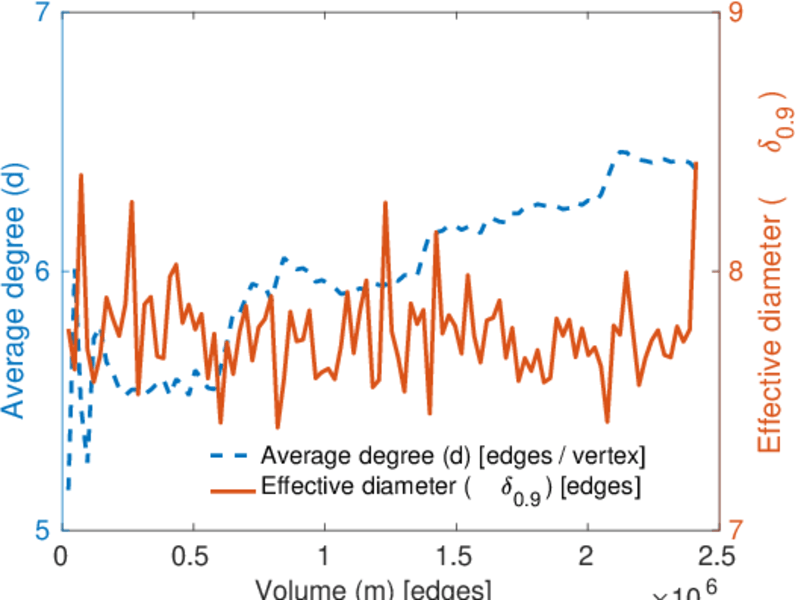
| Average degree | d = | 6.393 29
|
| Average left degree | d1 = | 106.177
|
| Average right degree | d2 = | 3.295 87
|
| Fill | p = | 5.068 10 × 10−5
|
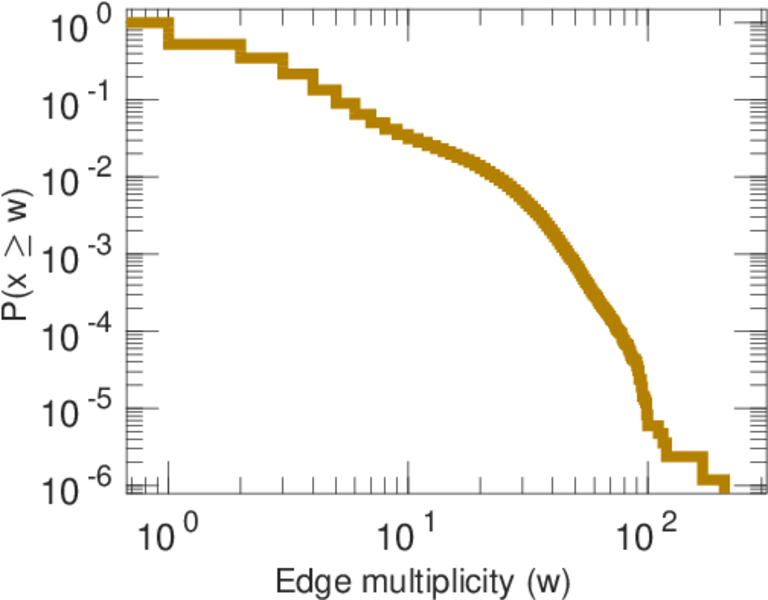
| Average edge multiplicity | m̃ = | 2.862 94
|
| Size of LCC | N = | 576,245
|
| Diameter | δ = | 20
|
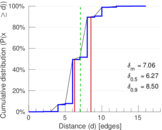
| 50-Percentile effective diameter | δ0.5 = | 6.265 75
|
| 90-Percentile effective diameter | δ0.9 = | 8.501 64
|
| Median distance | δM = | 7
|
| Mean distance | δm = | 7.064 48
|
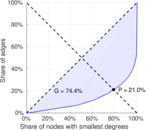
| Gini coefficient | G = | 0.747 683
|
| Balanced inequality ratio | P = | 0.209 926
|
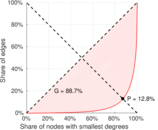
| Left balanced inequality ratio | P1 = | 0.128 030
|
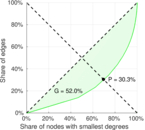
| Right balanced inequality ratio | P2 = | 0.303 091
|
| Relative edge distribution entropy | Her = | 0.848 102
|
| Power law exponent | γ = | 9.072 94
|
| Tail power law exponent | γt = | 3.281 00
|
| Tail power law exponent with p | γ3 = | 3.281 00
|
| p-value | p = | 0.000 00
|
| Left tail power law exponent with p | γ3,1 = | 1.461 00
|
| Left p-value | p1 = | 0.000 00
|
| Right tail power law exponent with p | γ3,2 = | 3.321 00
|
| Right p-value | p2 = | 0.061 000 0
|
| Degree assortativity | ρ = | −0.023 376 8
|
| Degree assortativity p-value | pρ = | 3.765 43 × 10−102
|
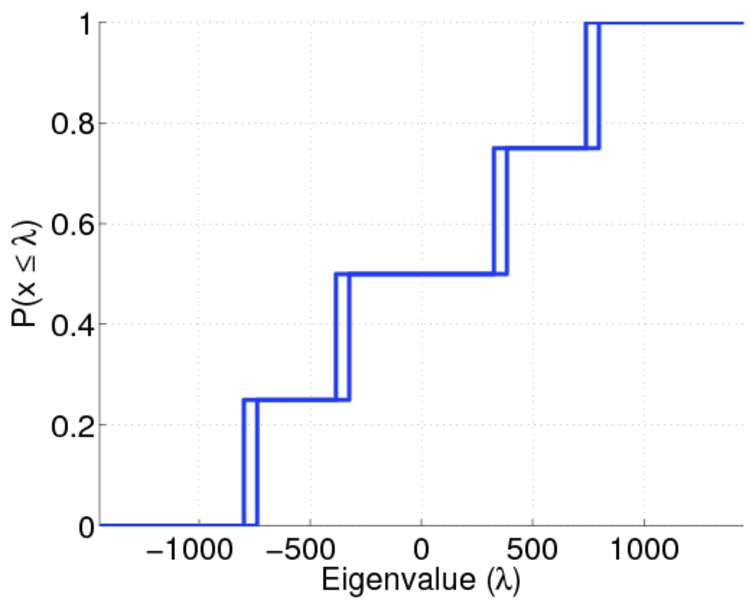
| Spectral norm | α = | 1,448.25
|
| Algebraic connectivity | a = | 0.000 109 746
|
| Spectral separation | |λ1[A] / λ2[A]| = | 1.448 50
|
| Controllability | C = | 709,624
|
| Relative controllability | Cr = | 0.940 542
|
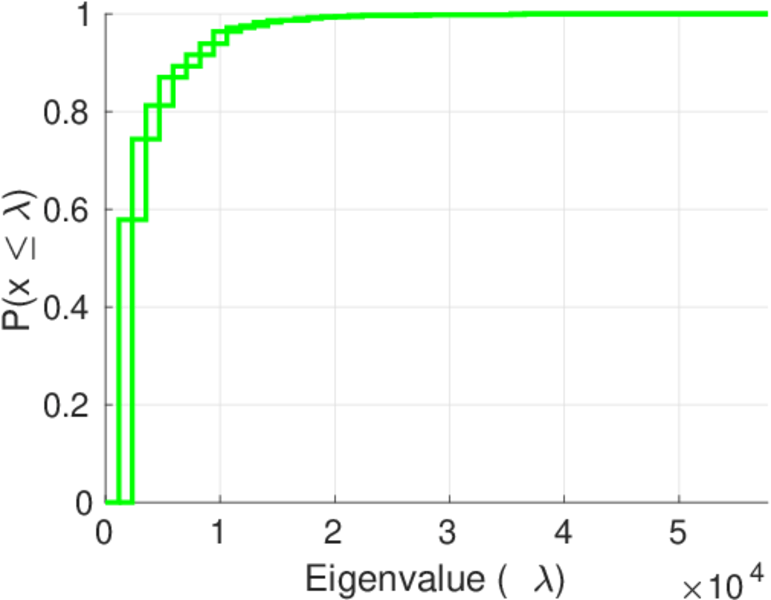
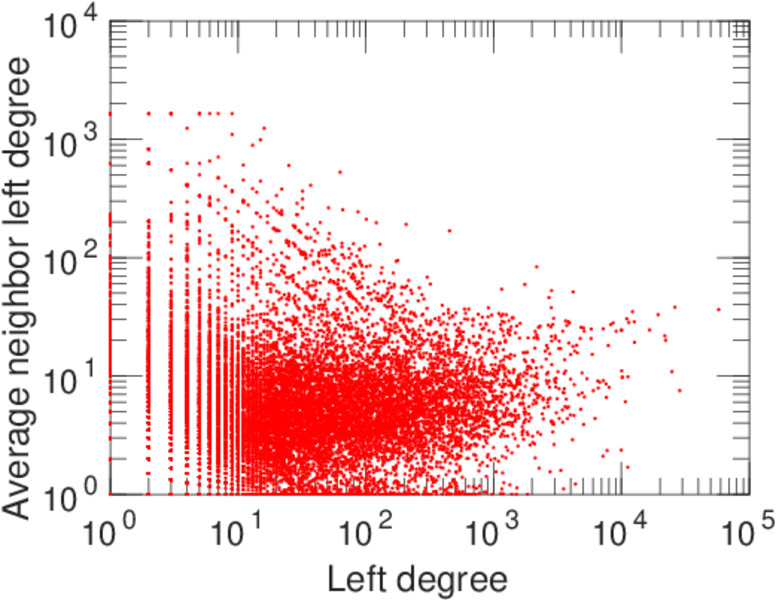
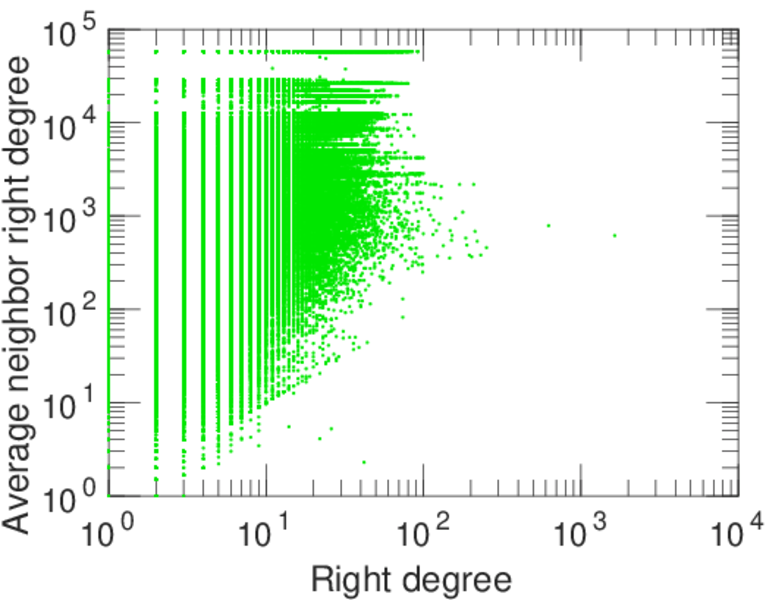
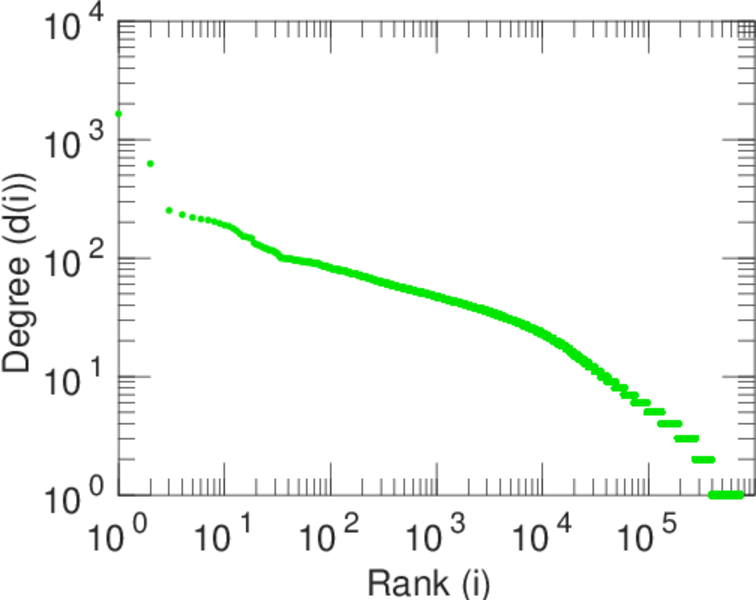
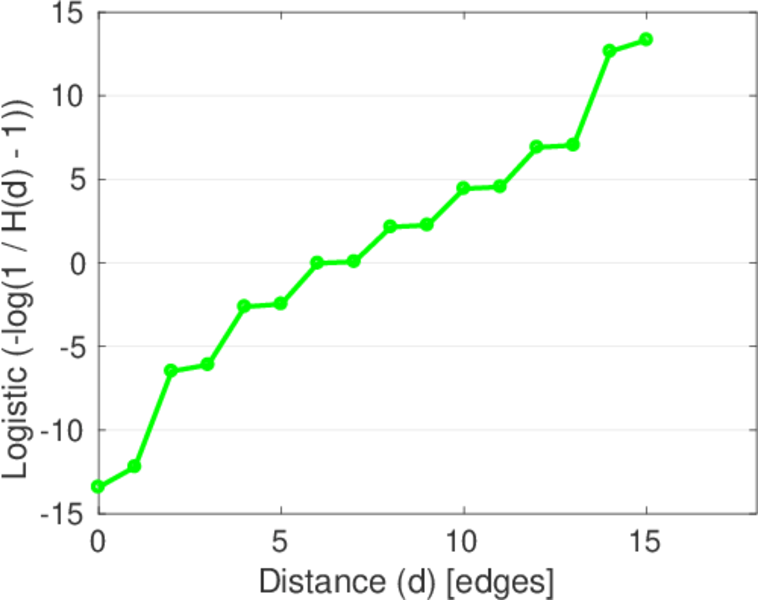
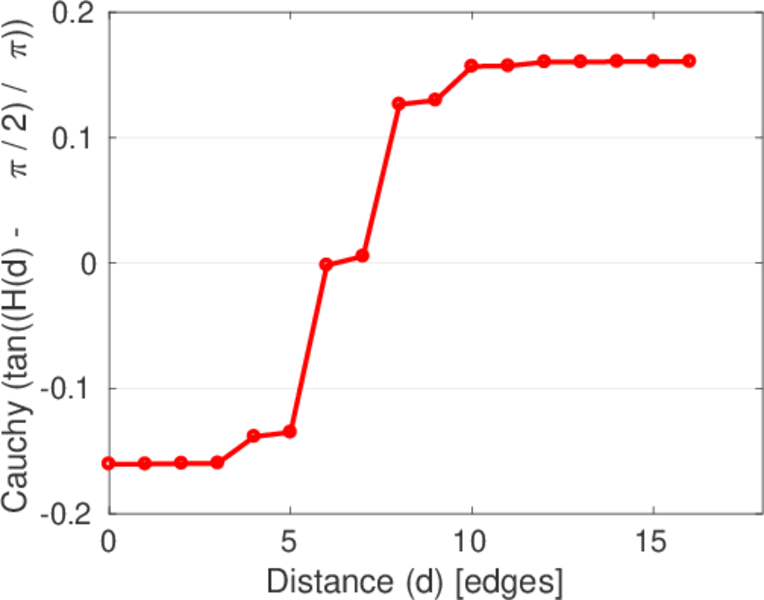
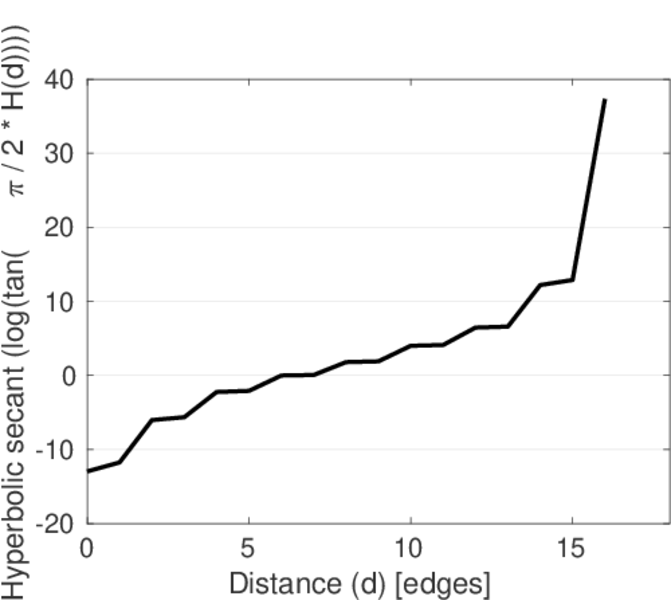
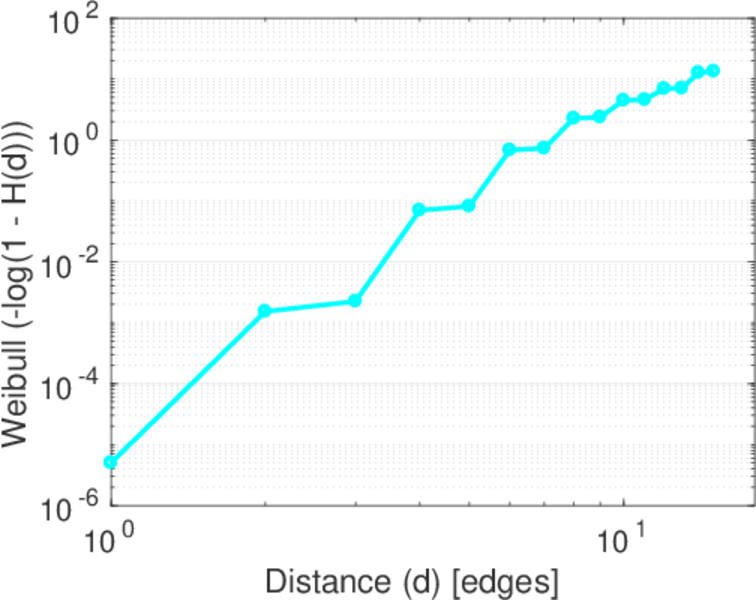
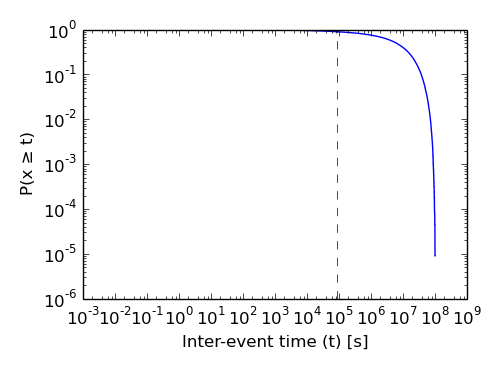
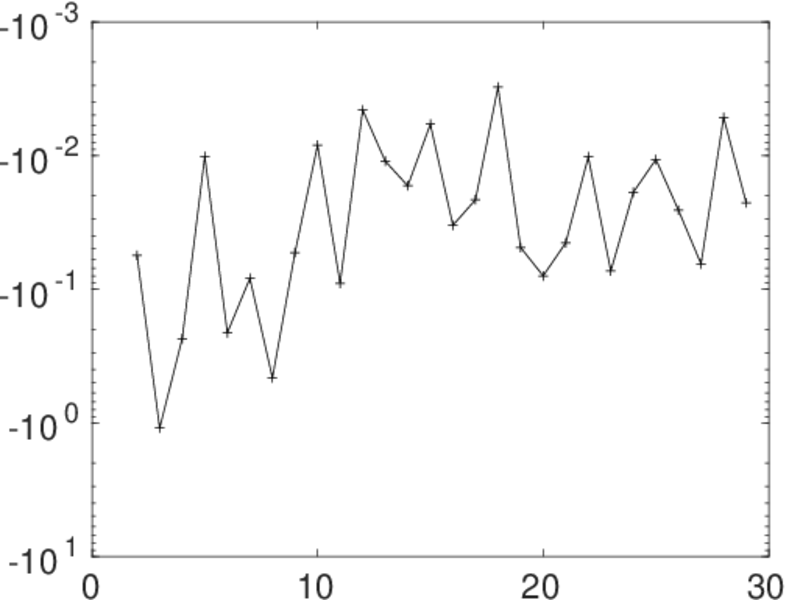
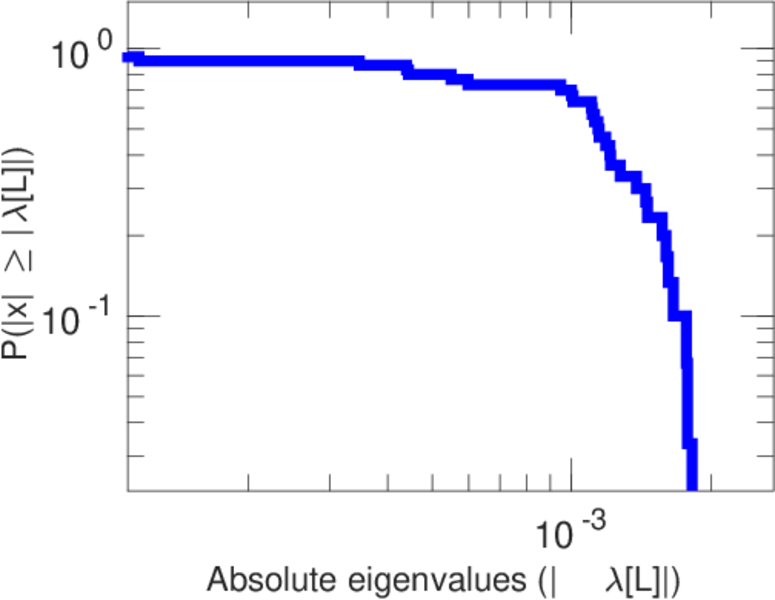
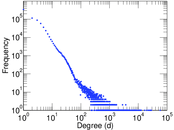
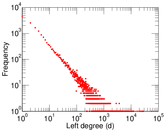
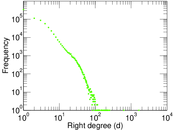
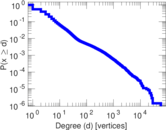
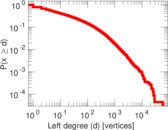
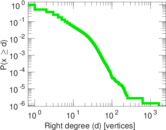
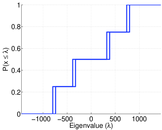
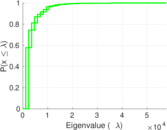
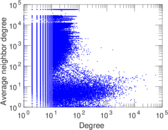
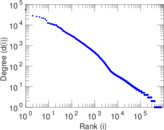
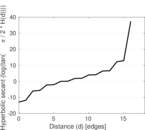
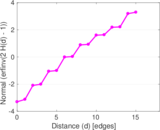
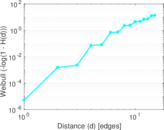
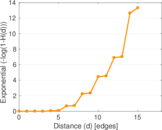
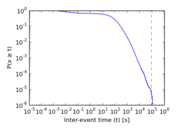
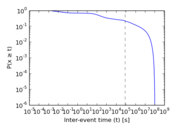
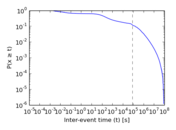
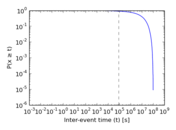
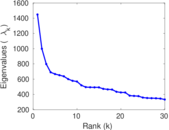
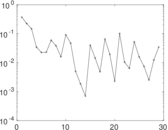
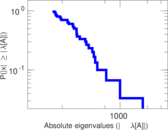
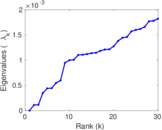
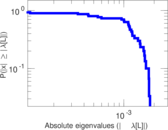
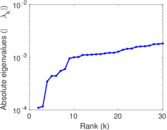
Plots


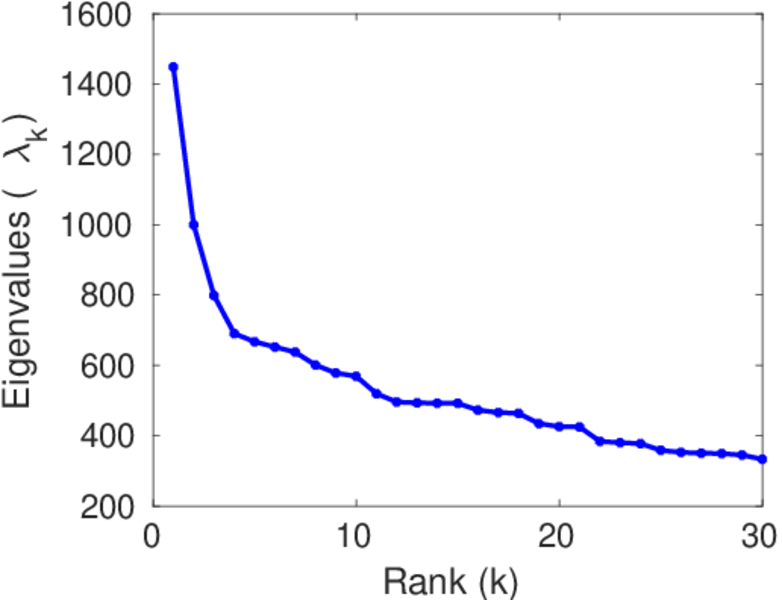
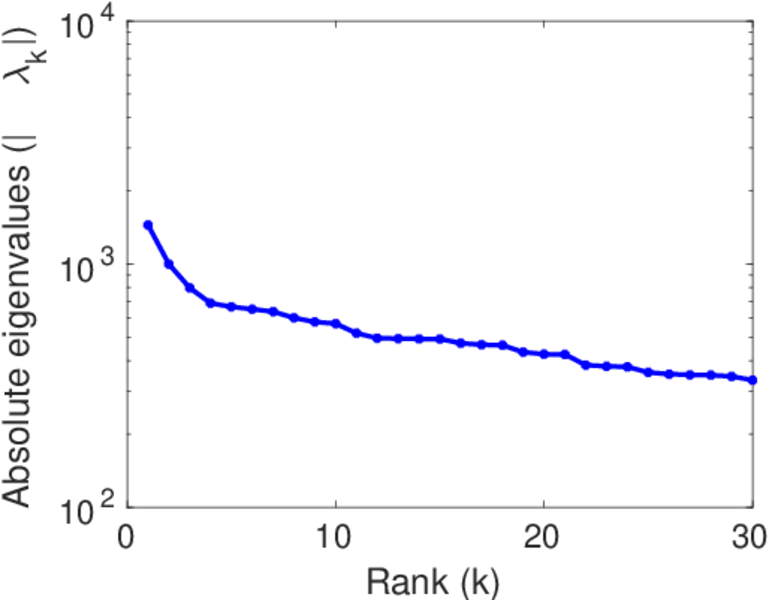
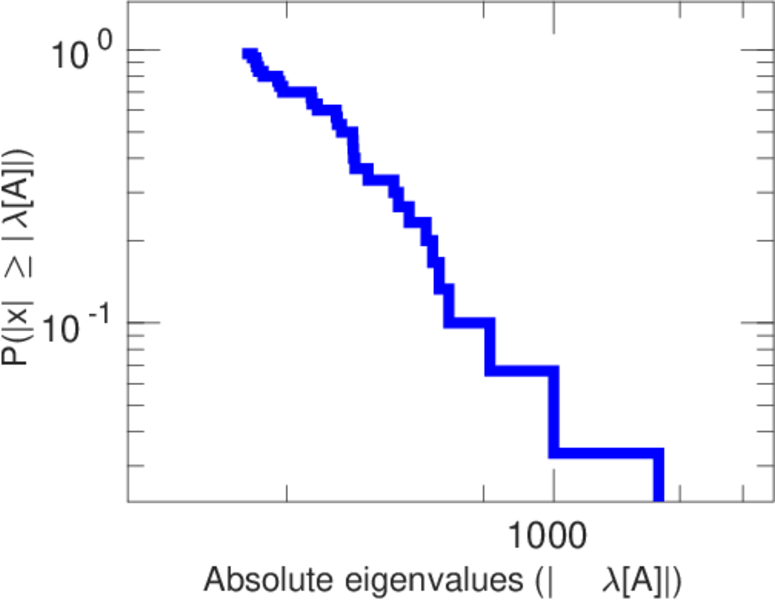
Matrix decompositions plots


Downloads
References
|
[1]
|
Jérôme Kunegis.
KONECT – The Koblenz Network Collection.
In Proc. Int. Conf. on World Wide Web Companion, pages
1343–1350, 2013.
[ http ]
|
|
[2]
|
Kevin Emamy and Richard Cameron.
CiteULike: A researcher's social bookmarking service.
Ariadne, (51), 2007.
|
 KONECT ‣ Networks ‣
Buy Me a Coffee
KONECT ‣ Networks ‣
Buy Me a Coffee