CiteULike user–tag
This is the bipartite network of users and tags in CiteULike. Each edge
represents a tag assignment that connects a user and a tag. Since a user can
assign a tag to multiple publications, the network contains multiple edges. The
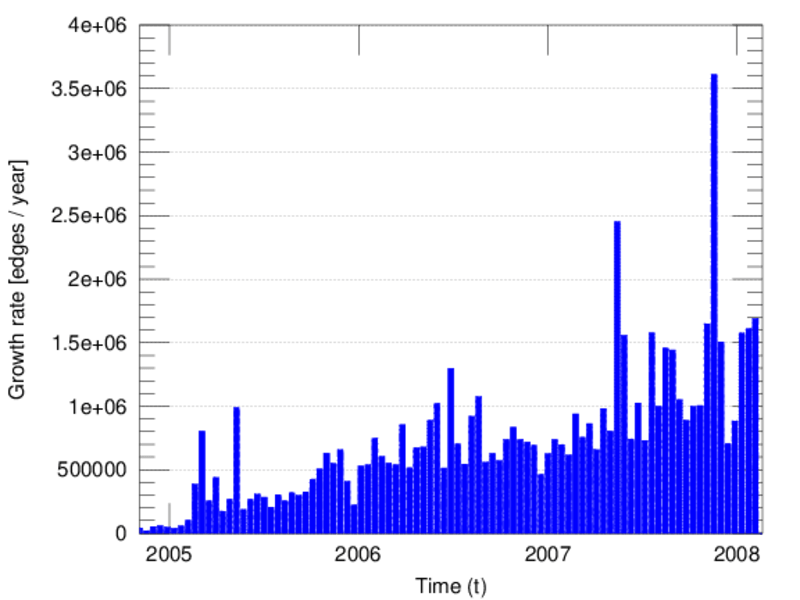
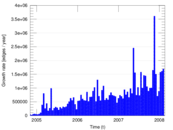
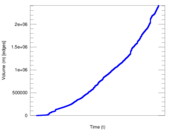
edges are annotated with the creation time of the tag assignment.
Metadata
Statistics
| Size | n = | 175,992
|
| Left size | n1 = | 22,715
|
| Right size | n2 = | 153,277
|
| Volume | m = | 2,411,819
|
| Unique edge count | m̿ = | 538,761
|
| Wedge count | s = | 192,371,639
|
| Claw count | z = | 194,428,758,411
|
| Cross count | x = | 302,871,675,261,597
|
| Square count | q = | 146,940,165
|
| 4-Tour count | T4 = | 1,946,141,506
|
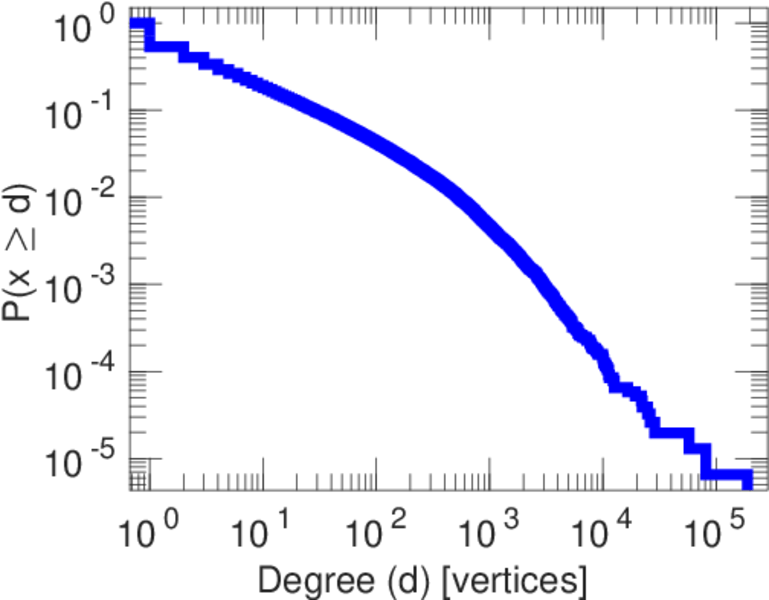
| Maximum degree | dmax = | 189,295
|
| Maximum left degree | d1max = | 57,706
|
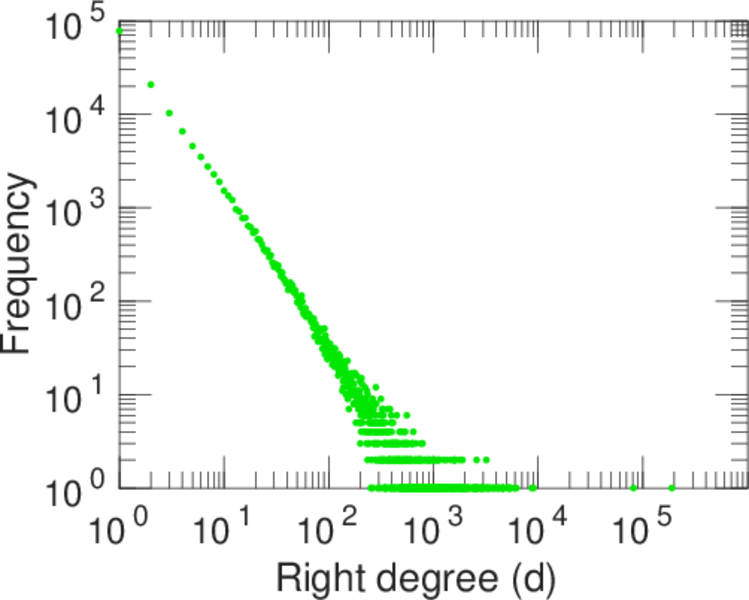
| Maximum right degree | d2max = | 189,295
|
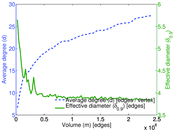
| Average degree | d = | 27.408 3
|
| Average left degree | d1 = | 106.177
|
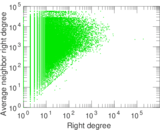
| Average right degree | d2 = | 15.735 0
|
| Fill | p = | 0.000 154 741
|
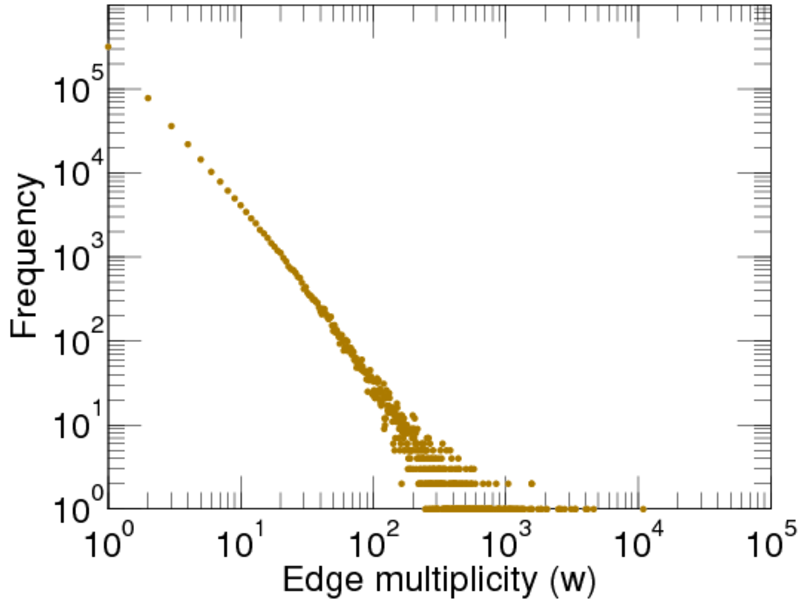
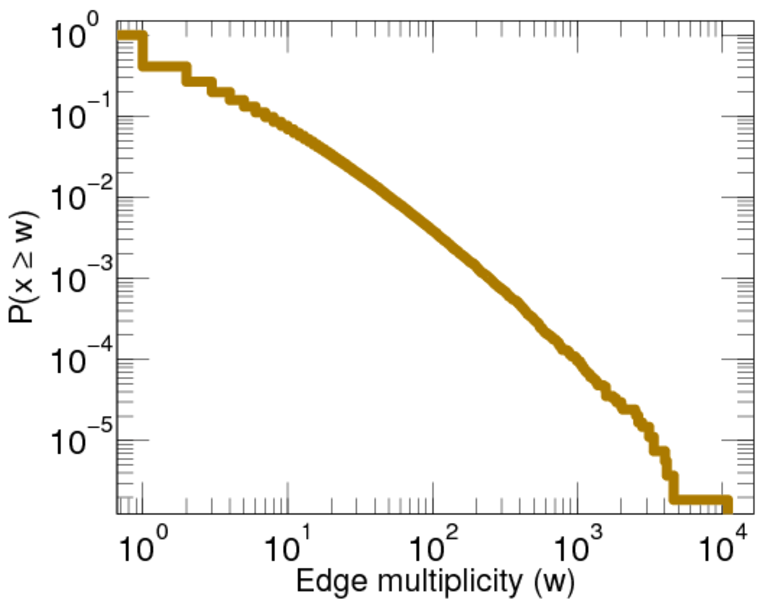
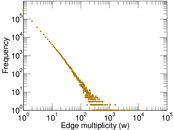
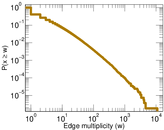
| Average edge multiplicity | m̃ = | 4.476 60
|
| Size of LCC | N = | 174,060
|
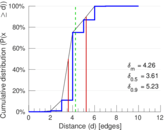
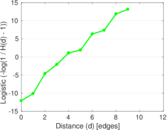
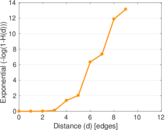
| Diameter | δ = | 12
|
| 50-Percentile effective diameter | δ0.5 = | 3.609 05
|
| 90-Percentile effective diameter | δ0.9 = | 5.233 56
|
| Median distance | δM = | 4
|
| Mean distance | δm = | 4.262 34
|
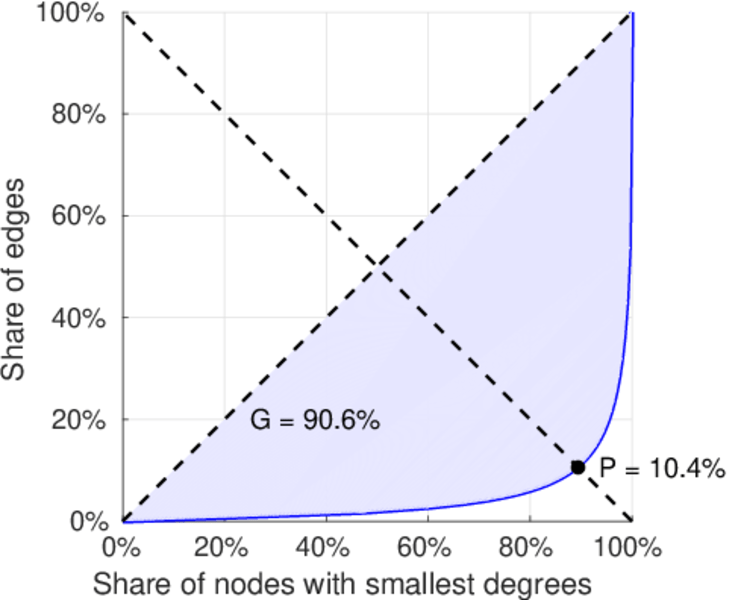
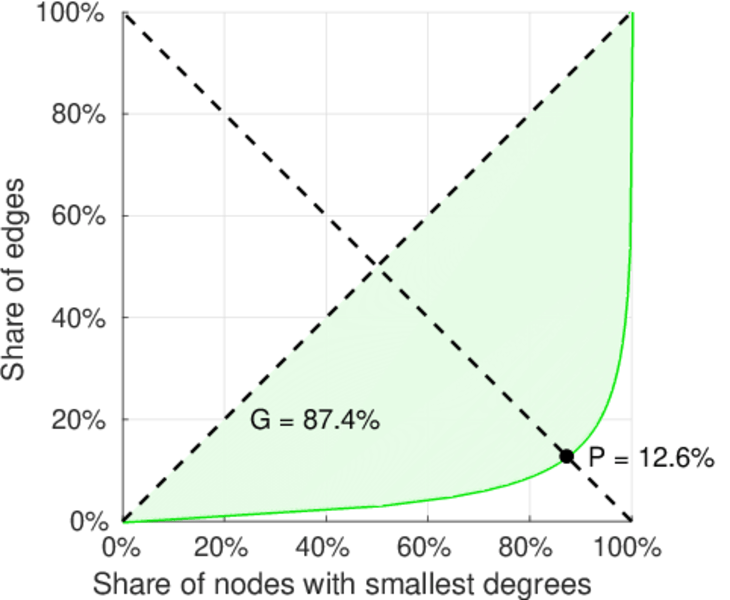
| Gini coefficient | G = | 0.912 555
|
| Balanced inequality ratio | P = | 0.099 462 3
|
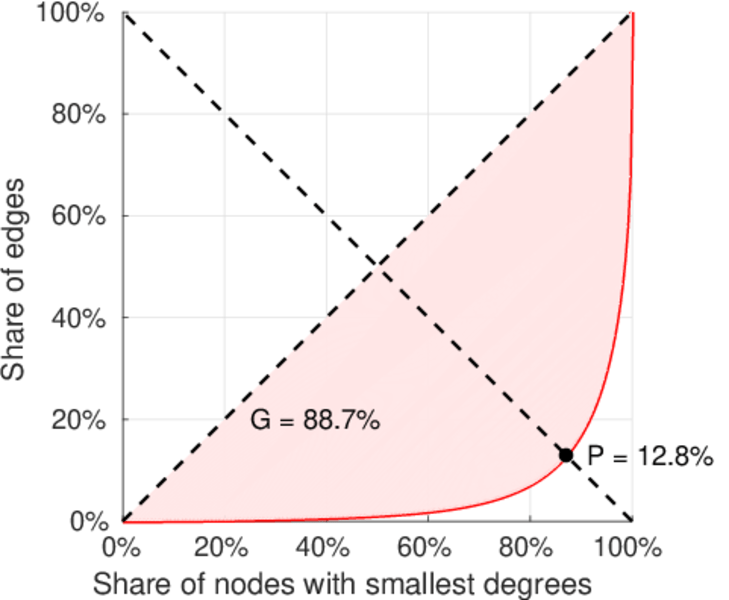
| Left balanced inequality ratio | P1 = | 0.128 030
|
| Right balanced inequality ratio | P2 = | 0.126 018
|
| Relative edge distribution entropy | Her = | 0.827 610
|
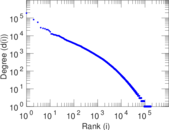
| Power law exponent | γ = | 2.821 69
|
| Tail power law exponent | γt = | 1.791 00
|
| Degree assortativity | ρ = | −0.097 101 6
|
| Degree assortativity p-value | pρ = | 0.000 00
|
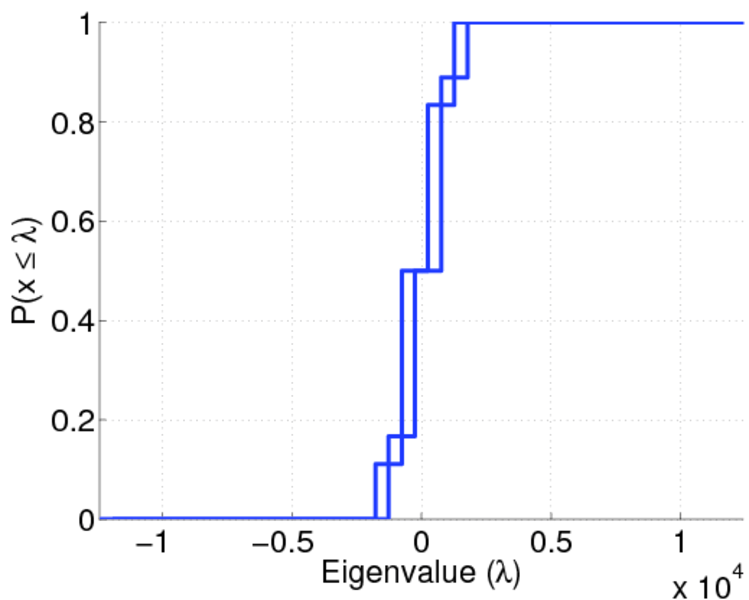
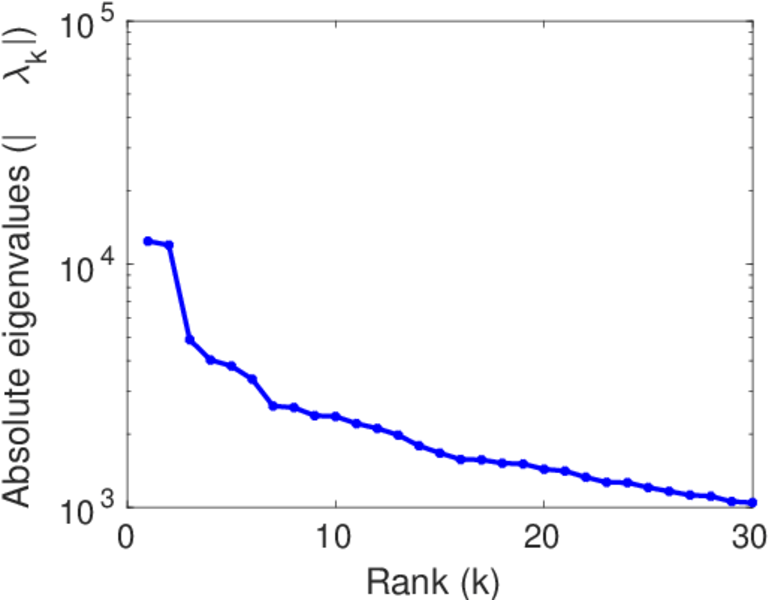
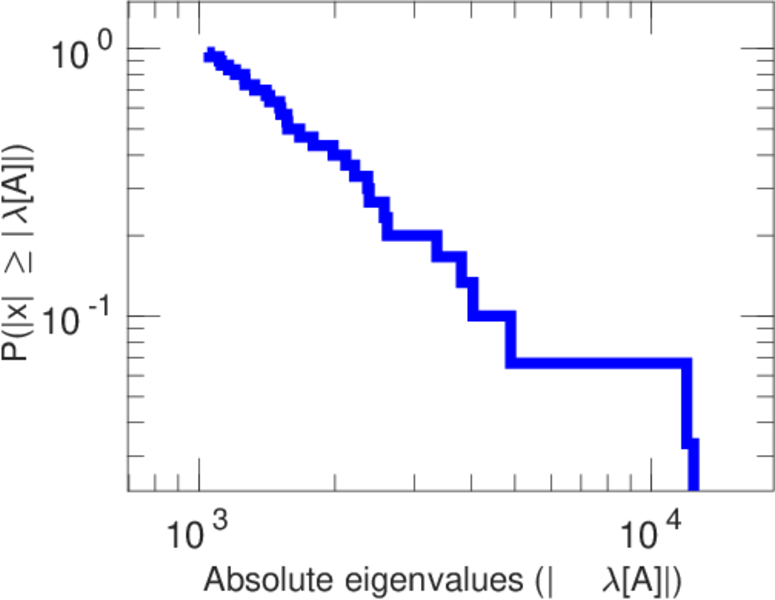
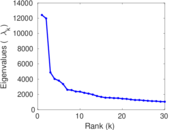
| Spectral norm | α = | 12,418.1
|
| Algebraic connectivity | a = | 0.031 527 5
|
| Spectral separation | |λ1[A] / λ2[A]| = | 1.037 44
|
| Controllability | C = | 142,640
|
| Relative controllability | Cr = | 0.810 491
|
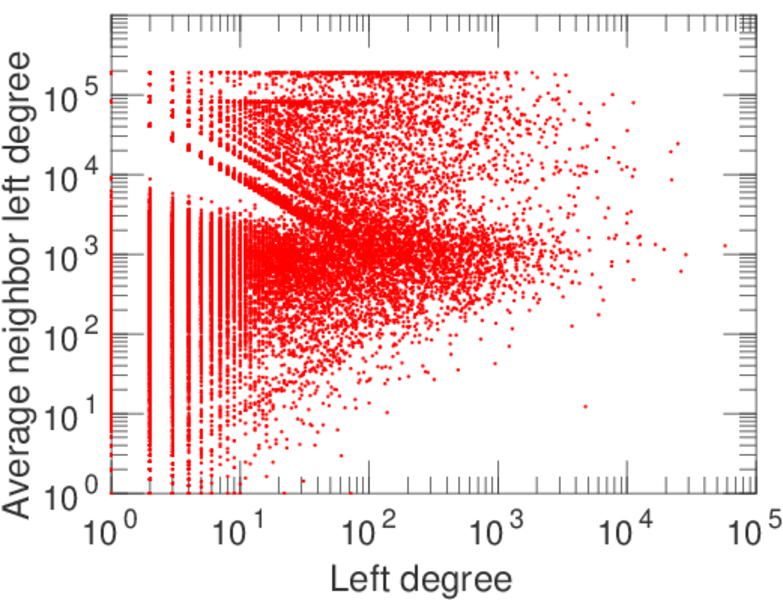
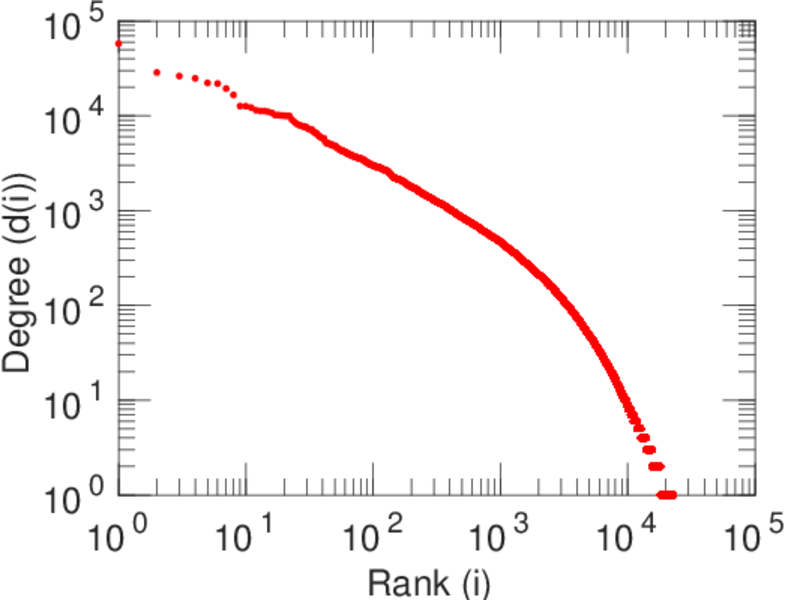
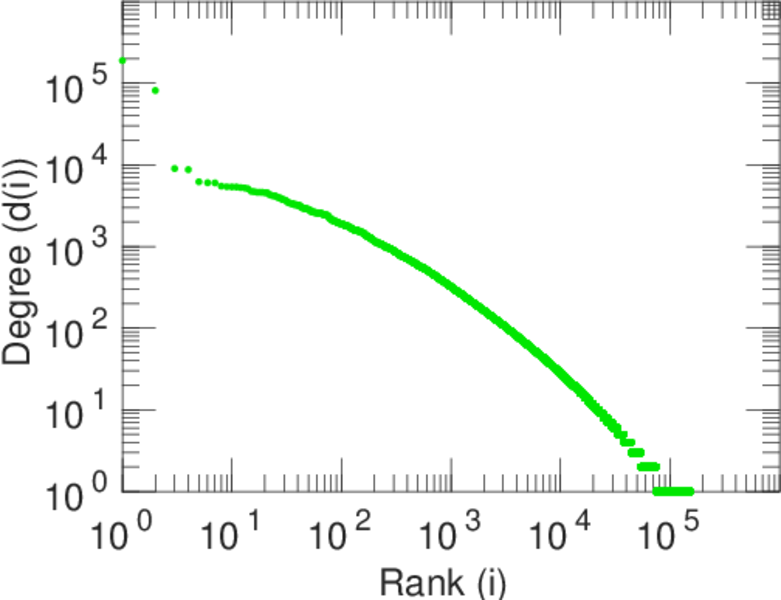
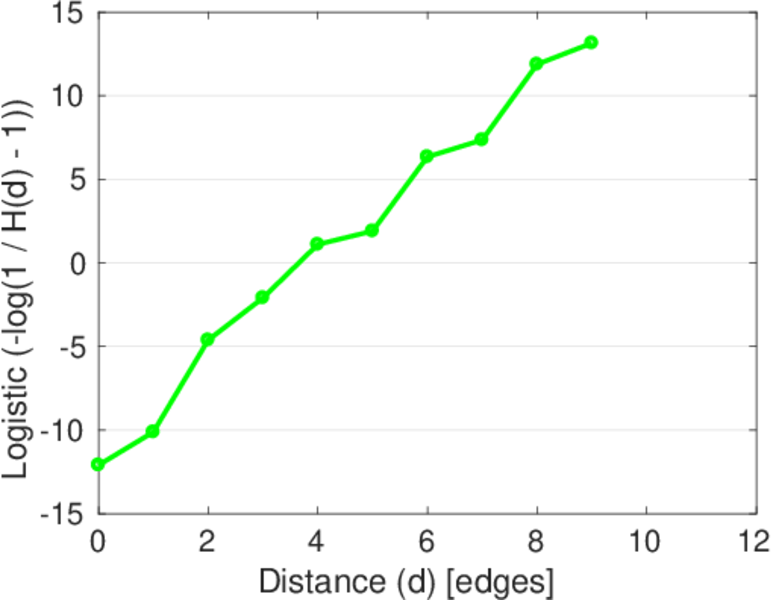
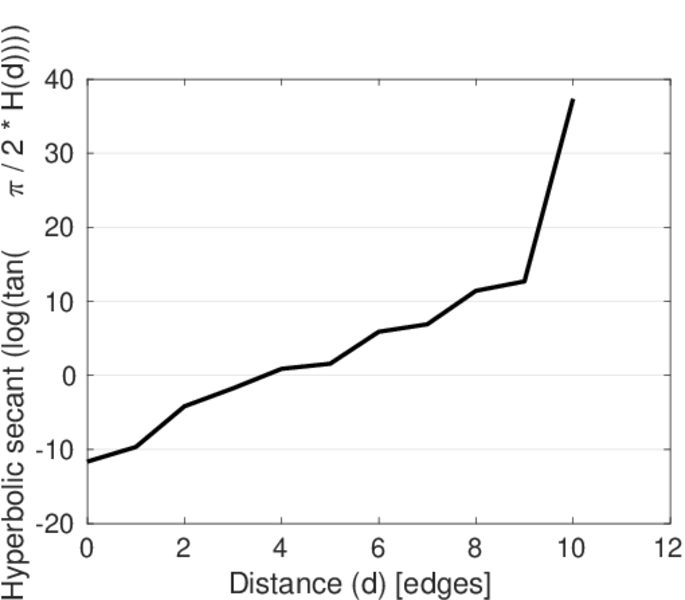
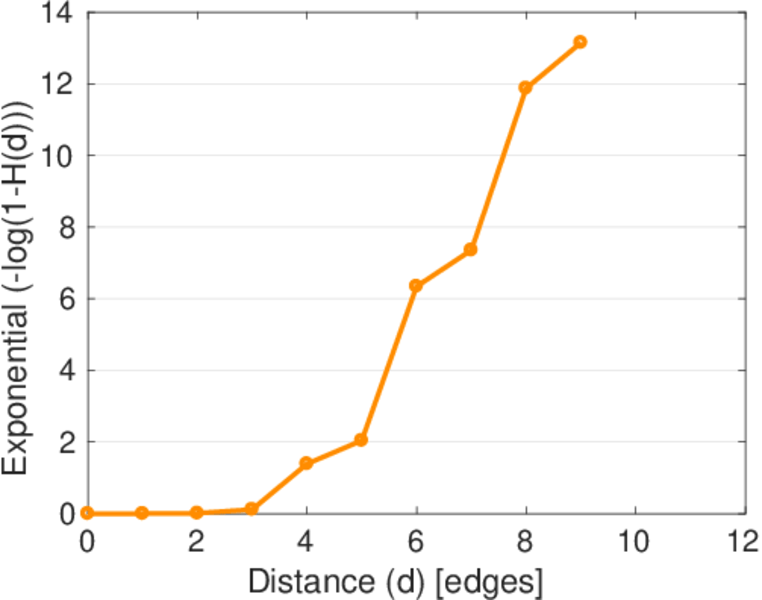
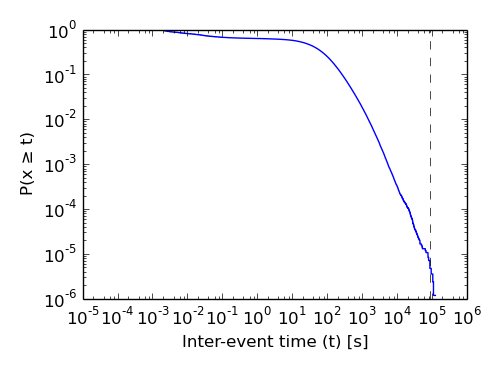
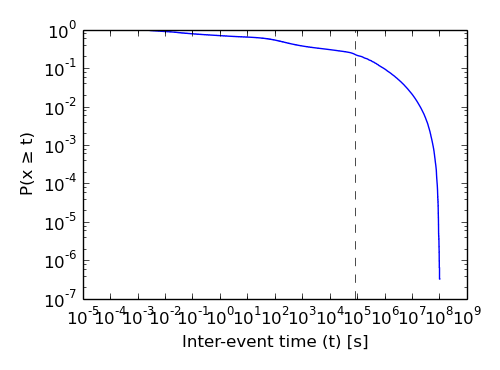
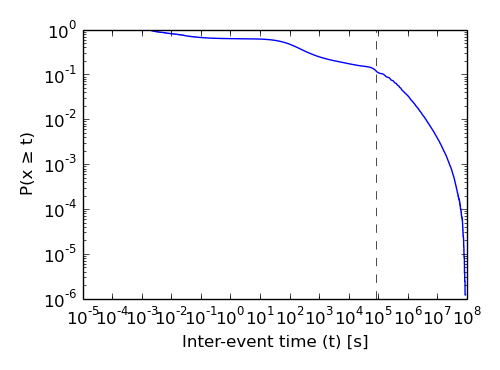
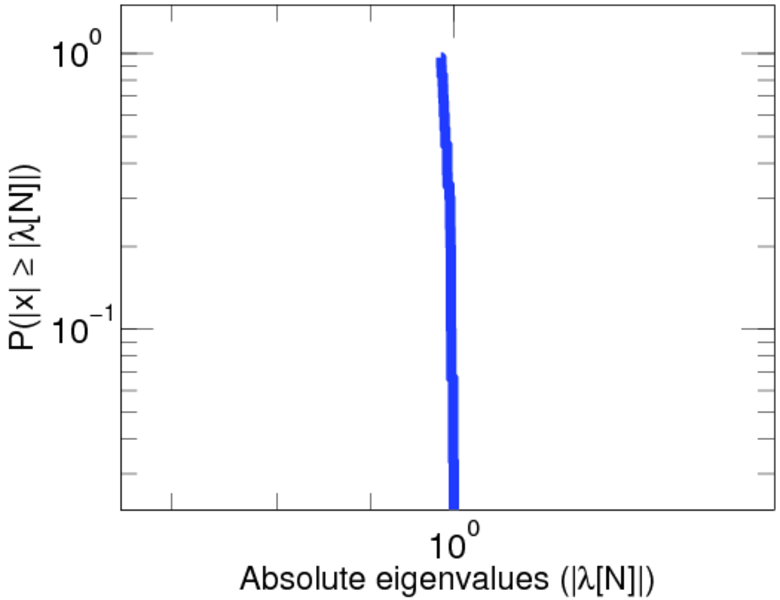
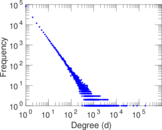
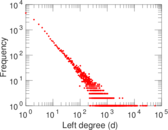
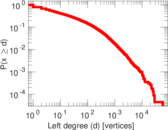
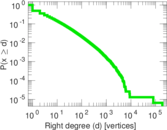
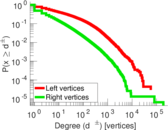
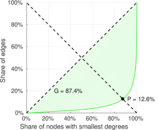
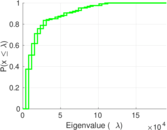
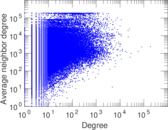
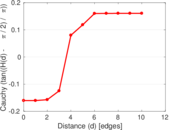
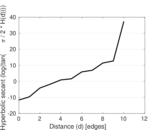
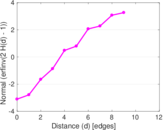
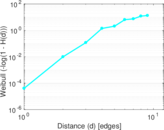
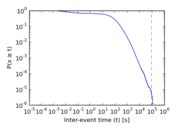
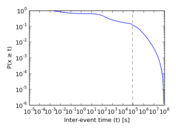
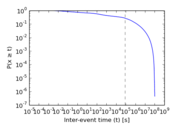
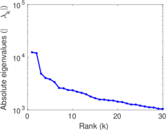
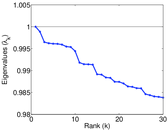
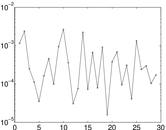
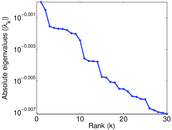
Plots


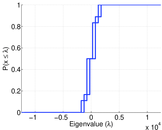

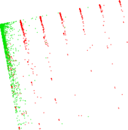

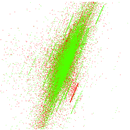


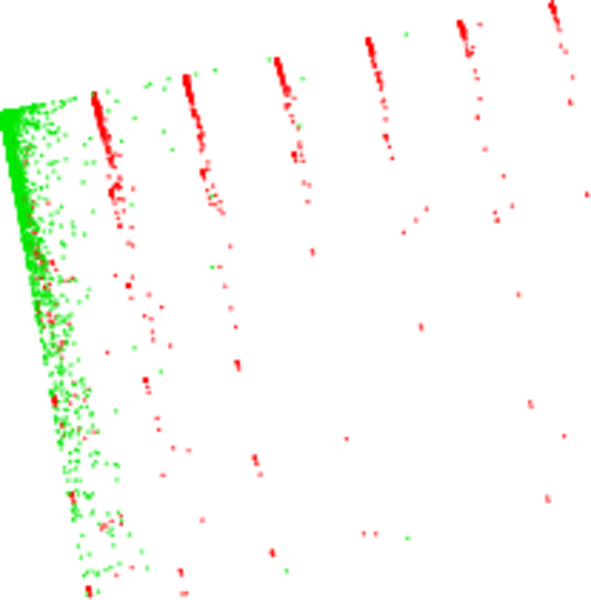
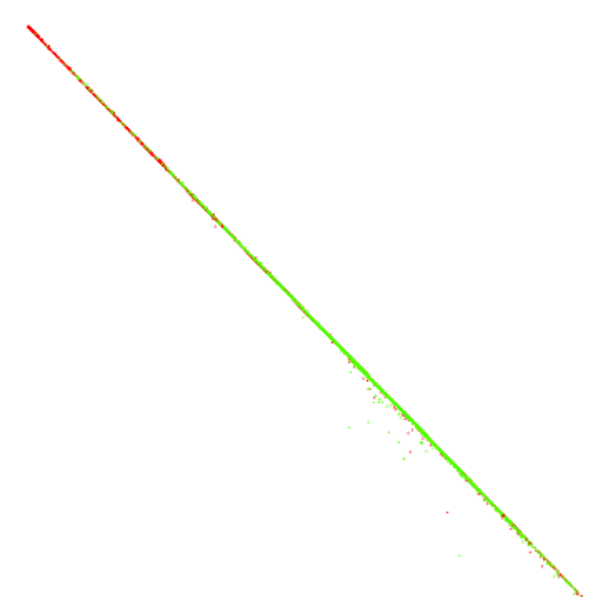
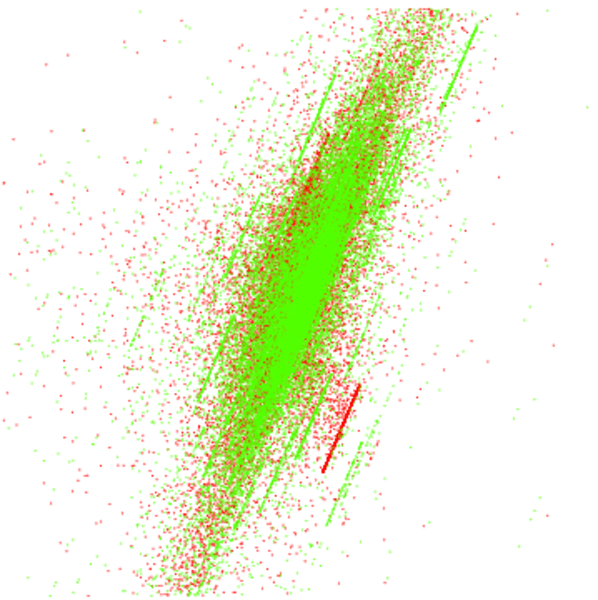
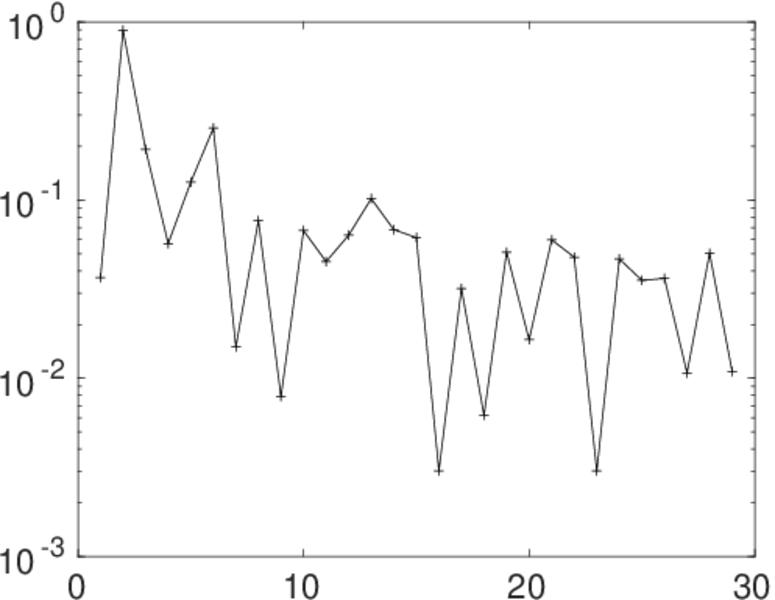
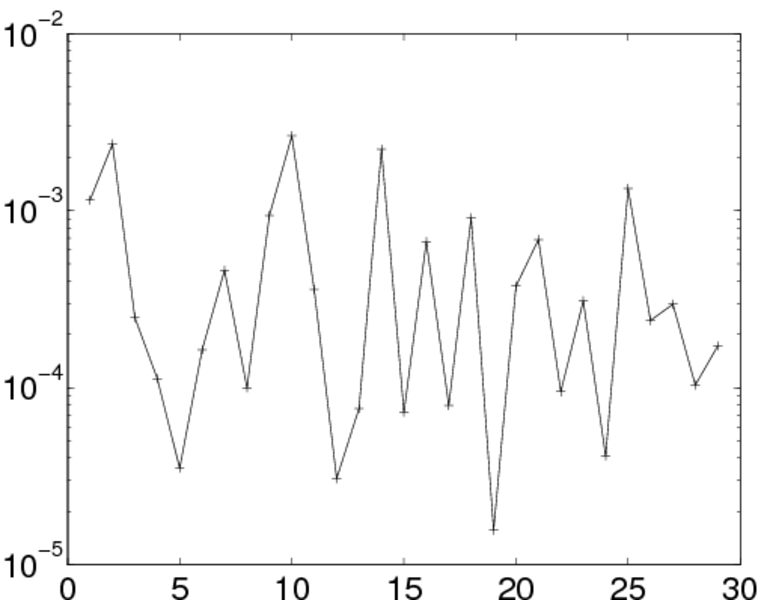
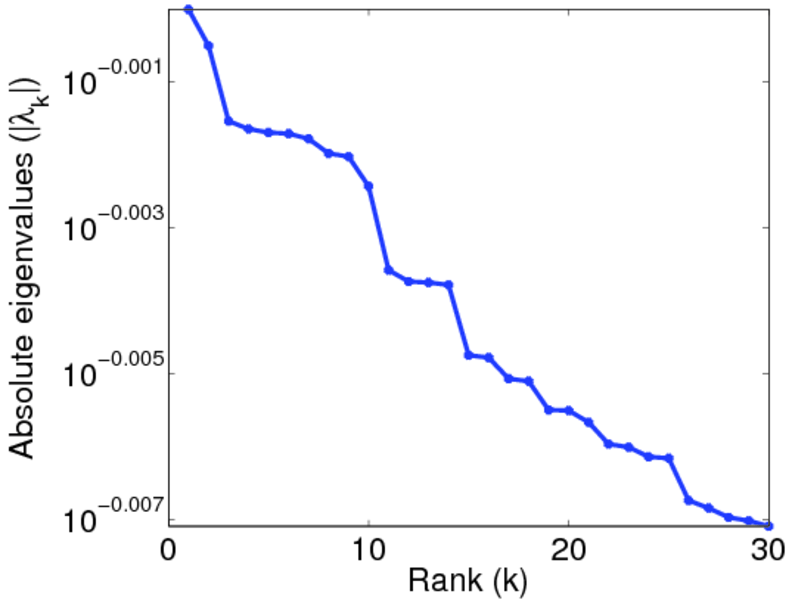
Matrix decompositions plots


Downloads
References
|
[1]
|
Jérôme Kunegis.
KONECT – The Koblenz Network Collection.
In Proc. Int. Conf. on World Wide Web Companion, pages
1343–1350, 2013.
[ http ]
|
|
[2]
|
Kevin Emamy and Richard Cameron.
CiteULike: A researcher's social bookmarking service.
Ariadne, (51), 2007.
|
 KONECT ‣ Networks ‣
Buy Me a Coffee
KONECT ‣ Networks ‣
Buy Me a Coffee