Digg votes
These are votes on stories by users of Digg. The network is bipartite, and
nodes represent users and stories, and each edge represents one vote. The data
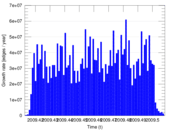
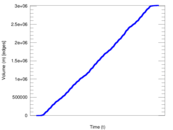
covers the period of a month in 2009. The dataset contains multiple edges,
when a single user has apparently given multiple votes to a single item.
Metadata
Statistics
| Size | n = | 142,962
|
| Left size | n1 = | 139,409
|
| Right size | n2 = | 3,553
|
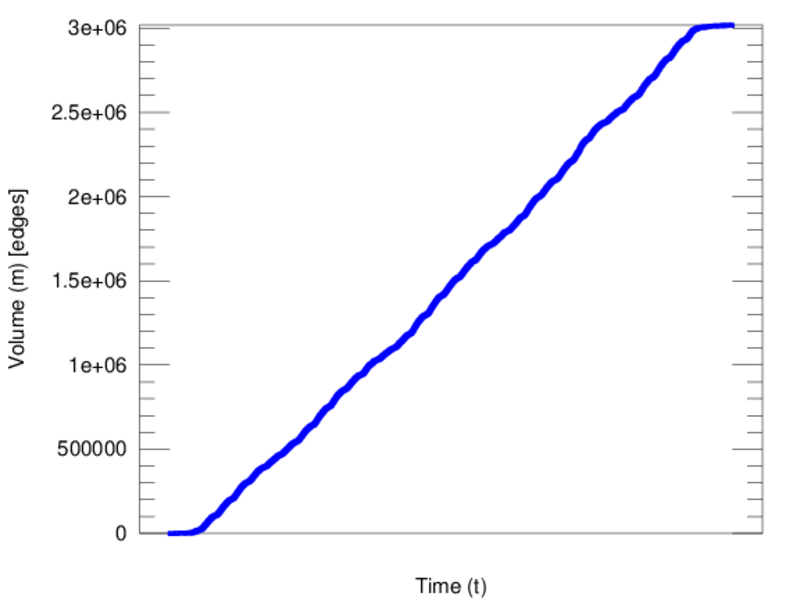
| Volume | m = | 3,018,197
|
| Unique edge count | m̿ = | 3,010,898
|
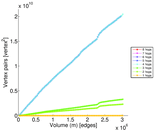
| Wedge count | s = | 3,452,748,079
|
| Claw count | z = | 5,552,161,405,338
|
| Cross count | x = | 17,710,305,006,153,294
|
| Square count | q = | 29,370,076,933
|
| 4-Tour count | T4 = | 248,779,120,872
|
| Maximum degree | dmax = | 24,099
|
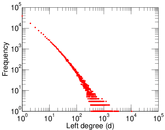
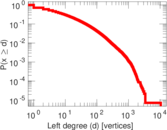
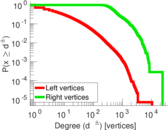
| Maximum left degree | d1max = | 10,526
|
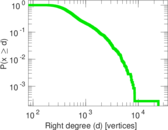
| Maximum right degree | d2max = | 24,099
|
| Average degree | d = | 42.223 8
|
| Average left degree | d1 = | 21.649 9
|
| Average right degree | d2 = | 849.478
|
| Fill | p = | 0.006 078 69
|
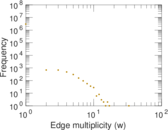
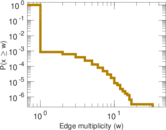
| Average edge multiplicity | m̃ = | 1.002 42
|
| Size of LCC | N = | 142,962
|
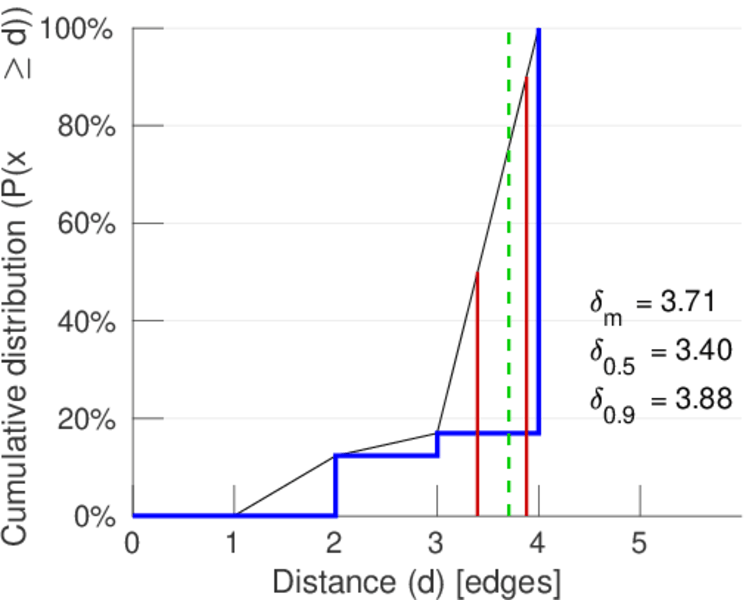
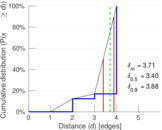
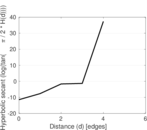
| Diameter | δ = | 4
|
| 50-Percentile effective diameter | δ0.5 = | 3.398 00
|
| 90-Percentile effective diameter | δ0.9 = | 3.879 60
|
| Median distance | δM = | 4
|
| Mean distance | δm = | 3.707 10
|
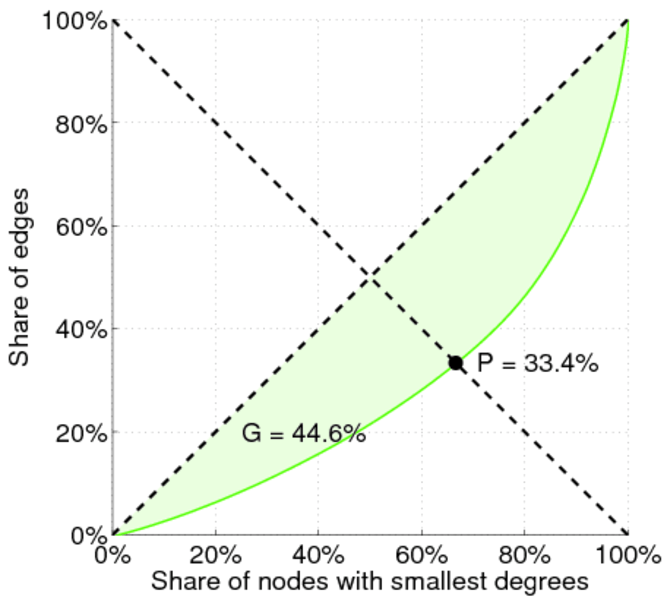
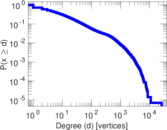
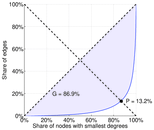
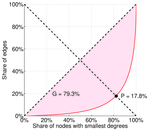
| Gini coefficient | G = | 0.882 325
|
| Balanced inequality ratio | P = | 0.126 496
|
| Left balanced inequality ratio | P1 = | 0.177 512
|
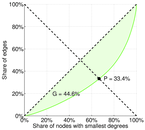
| Right balanced inequality ratio | P2 = | 0.333 871
|
| Relative edge distribution entropy | Her = | 0.820 754
|
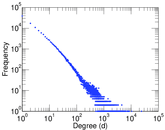
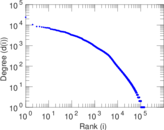
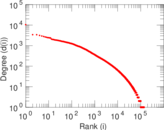
| Power law exponent | γ = | 1.572 35
|
| Tail power law exponent | γt = | 1.771 00
|
| Degree assortativity | ρ = | −0.179 694
|
| Degree assortativity p-value | pρ = | 0.000 00
|
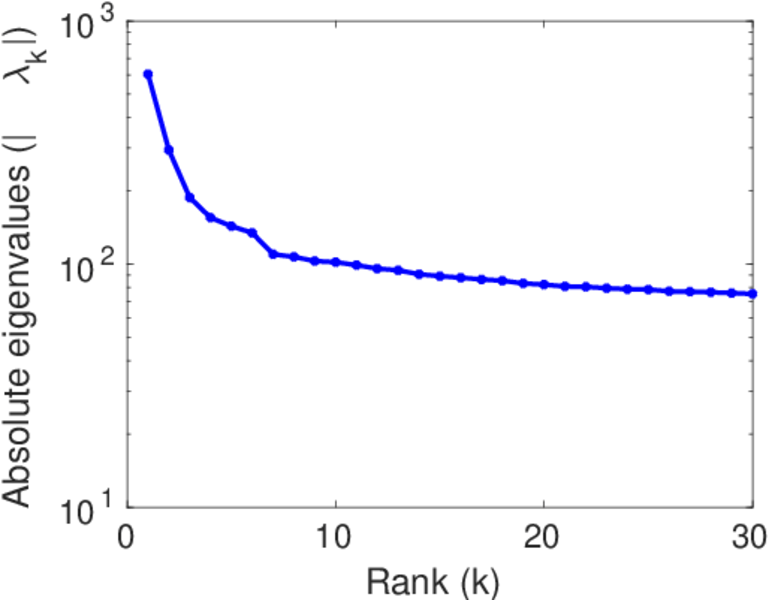
| Spectral norm | α = | 604.628
|
| Algebraic connectivity | a = | 0.631 175
|
| Controllability | C = | 135,856
|
| Relative controllability | Cr = | 0.950 294
|
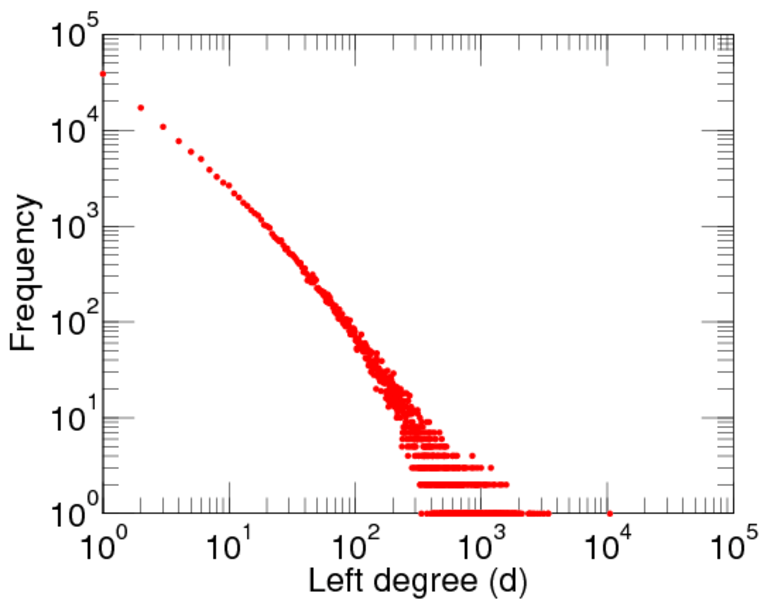
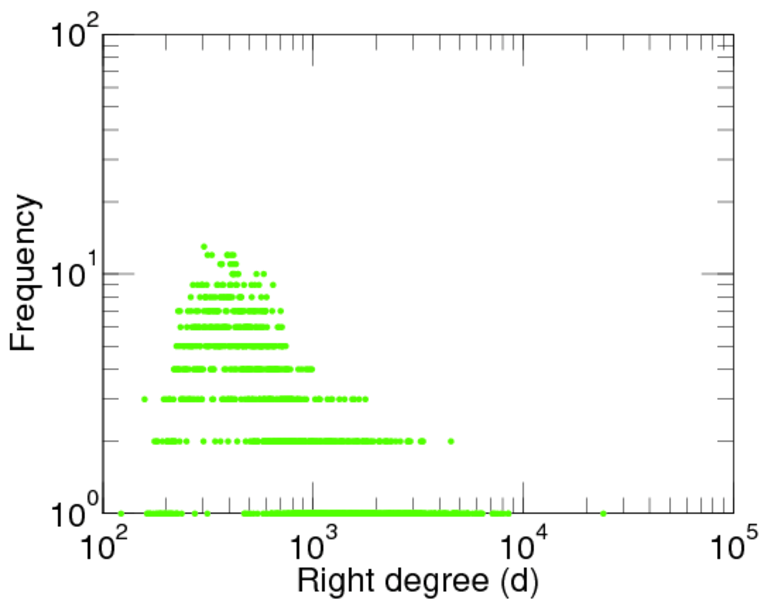
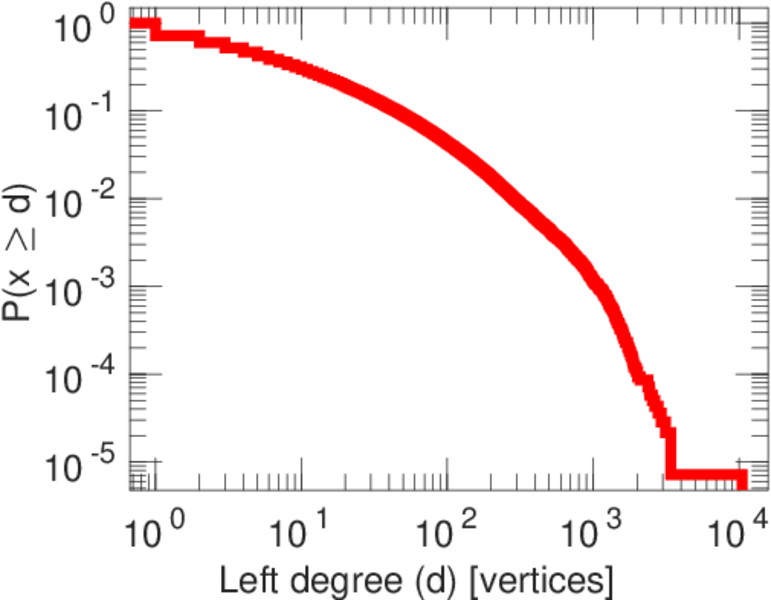
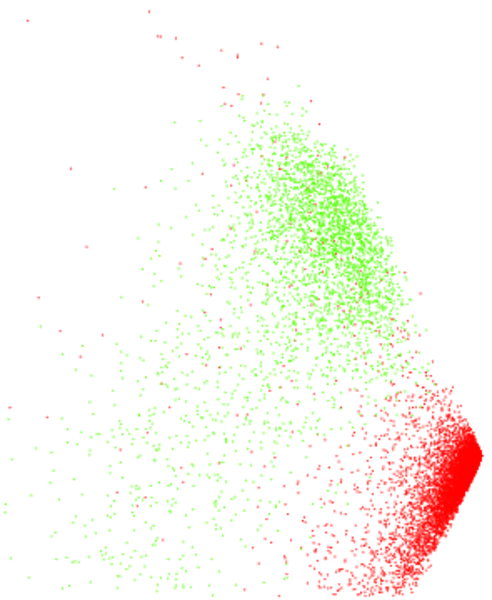
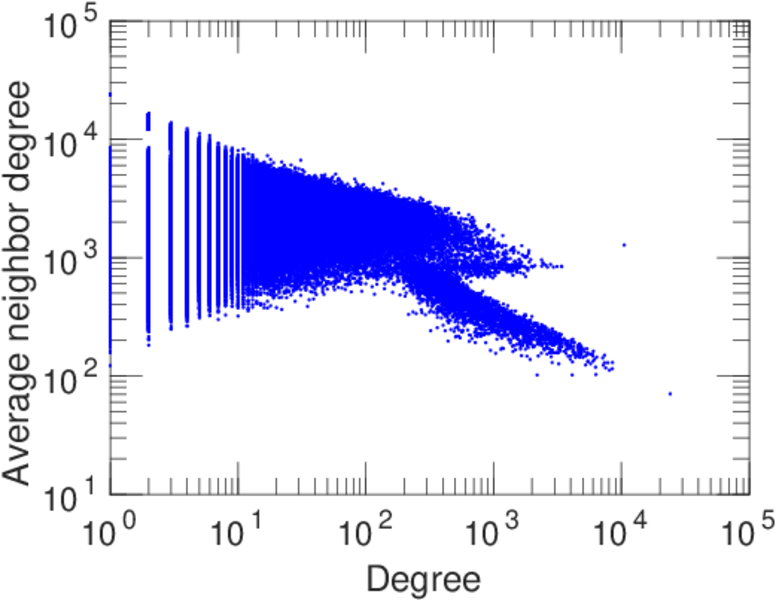
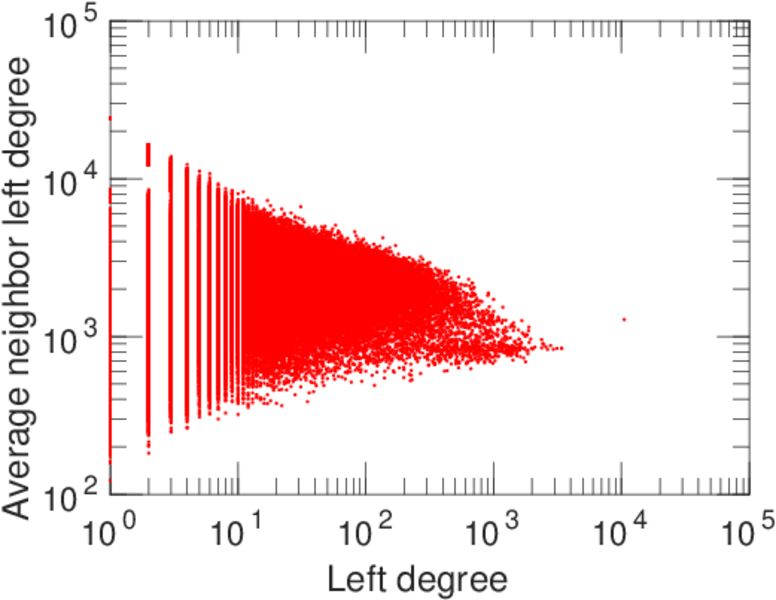
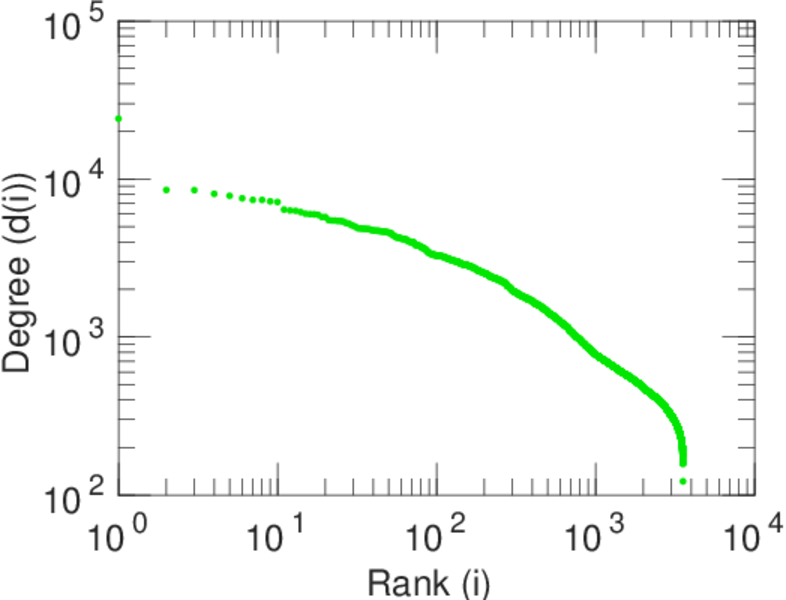
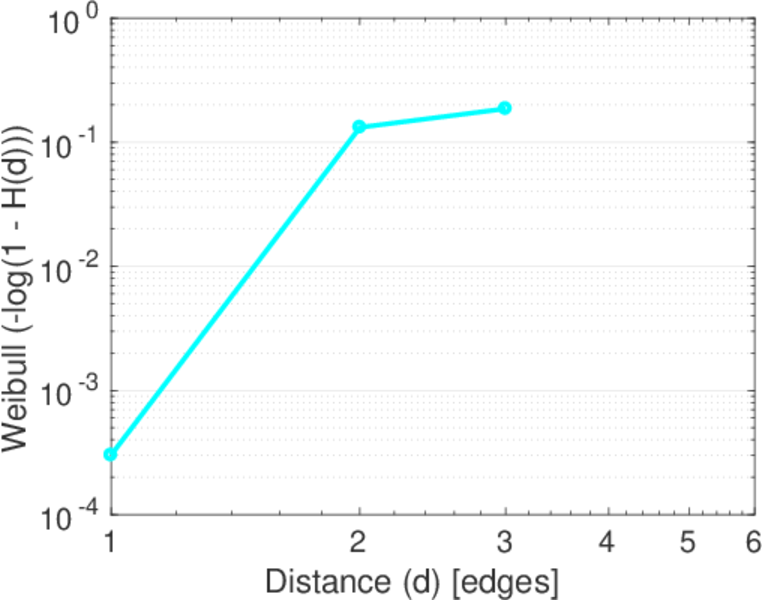
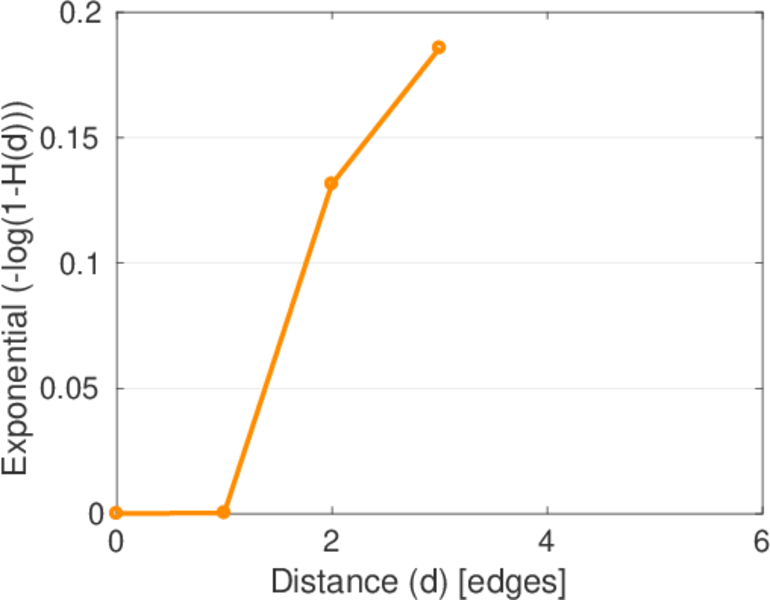
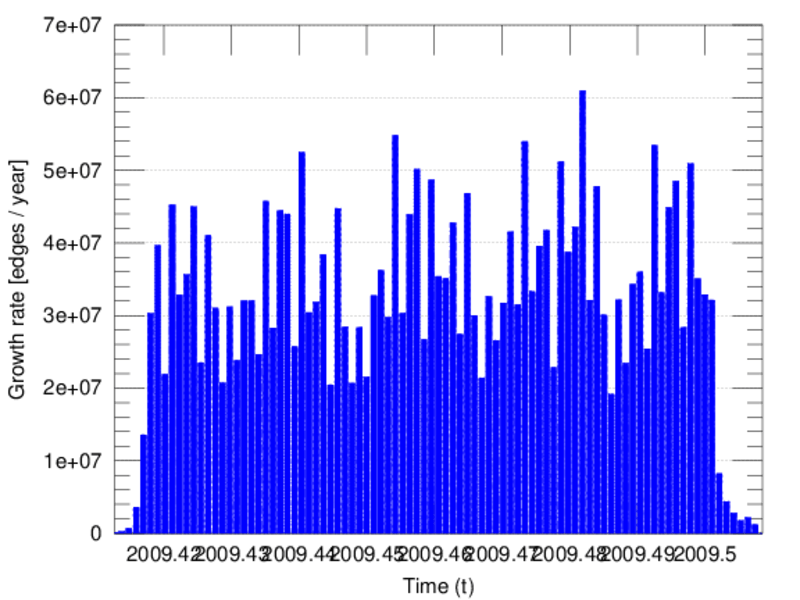
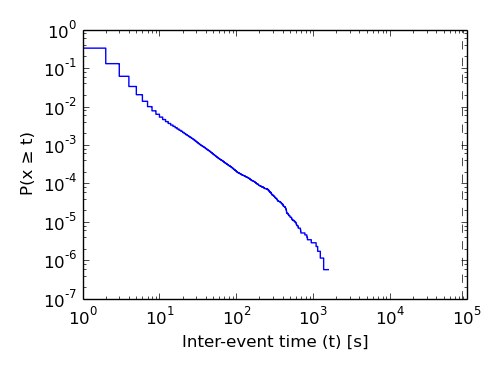
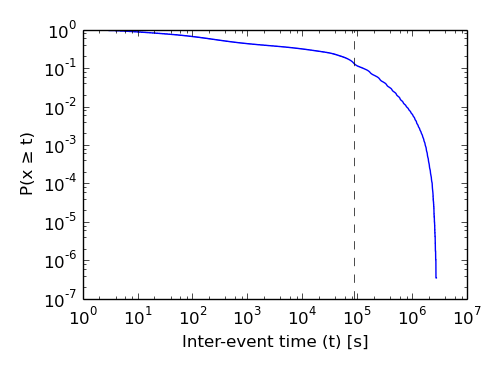
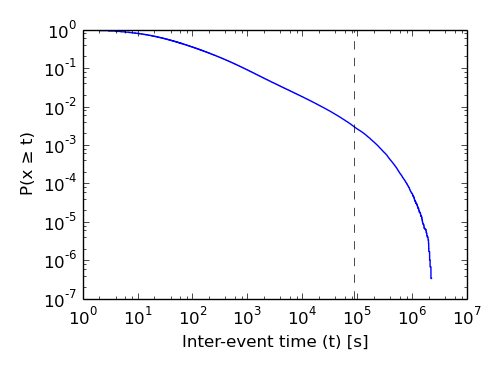
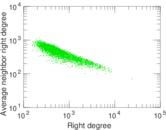
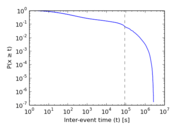
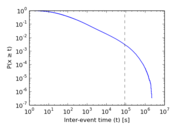
Plots


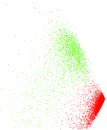
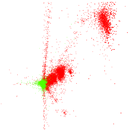
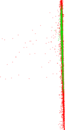


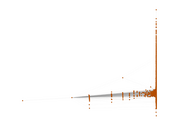


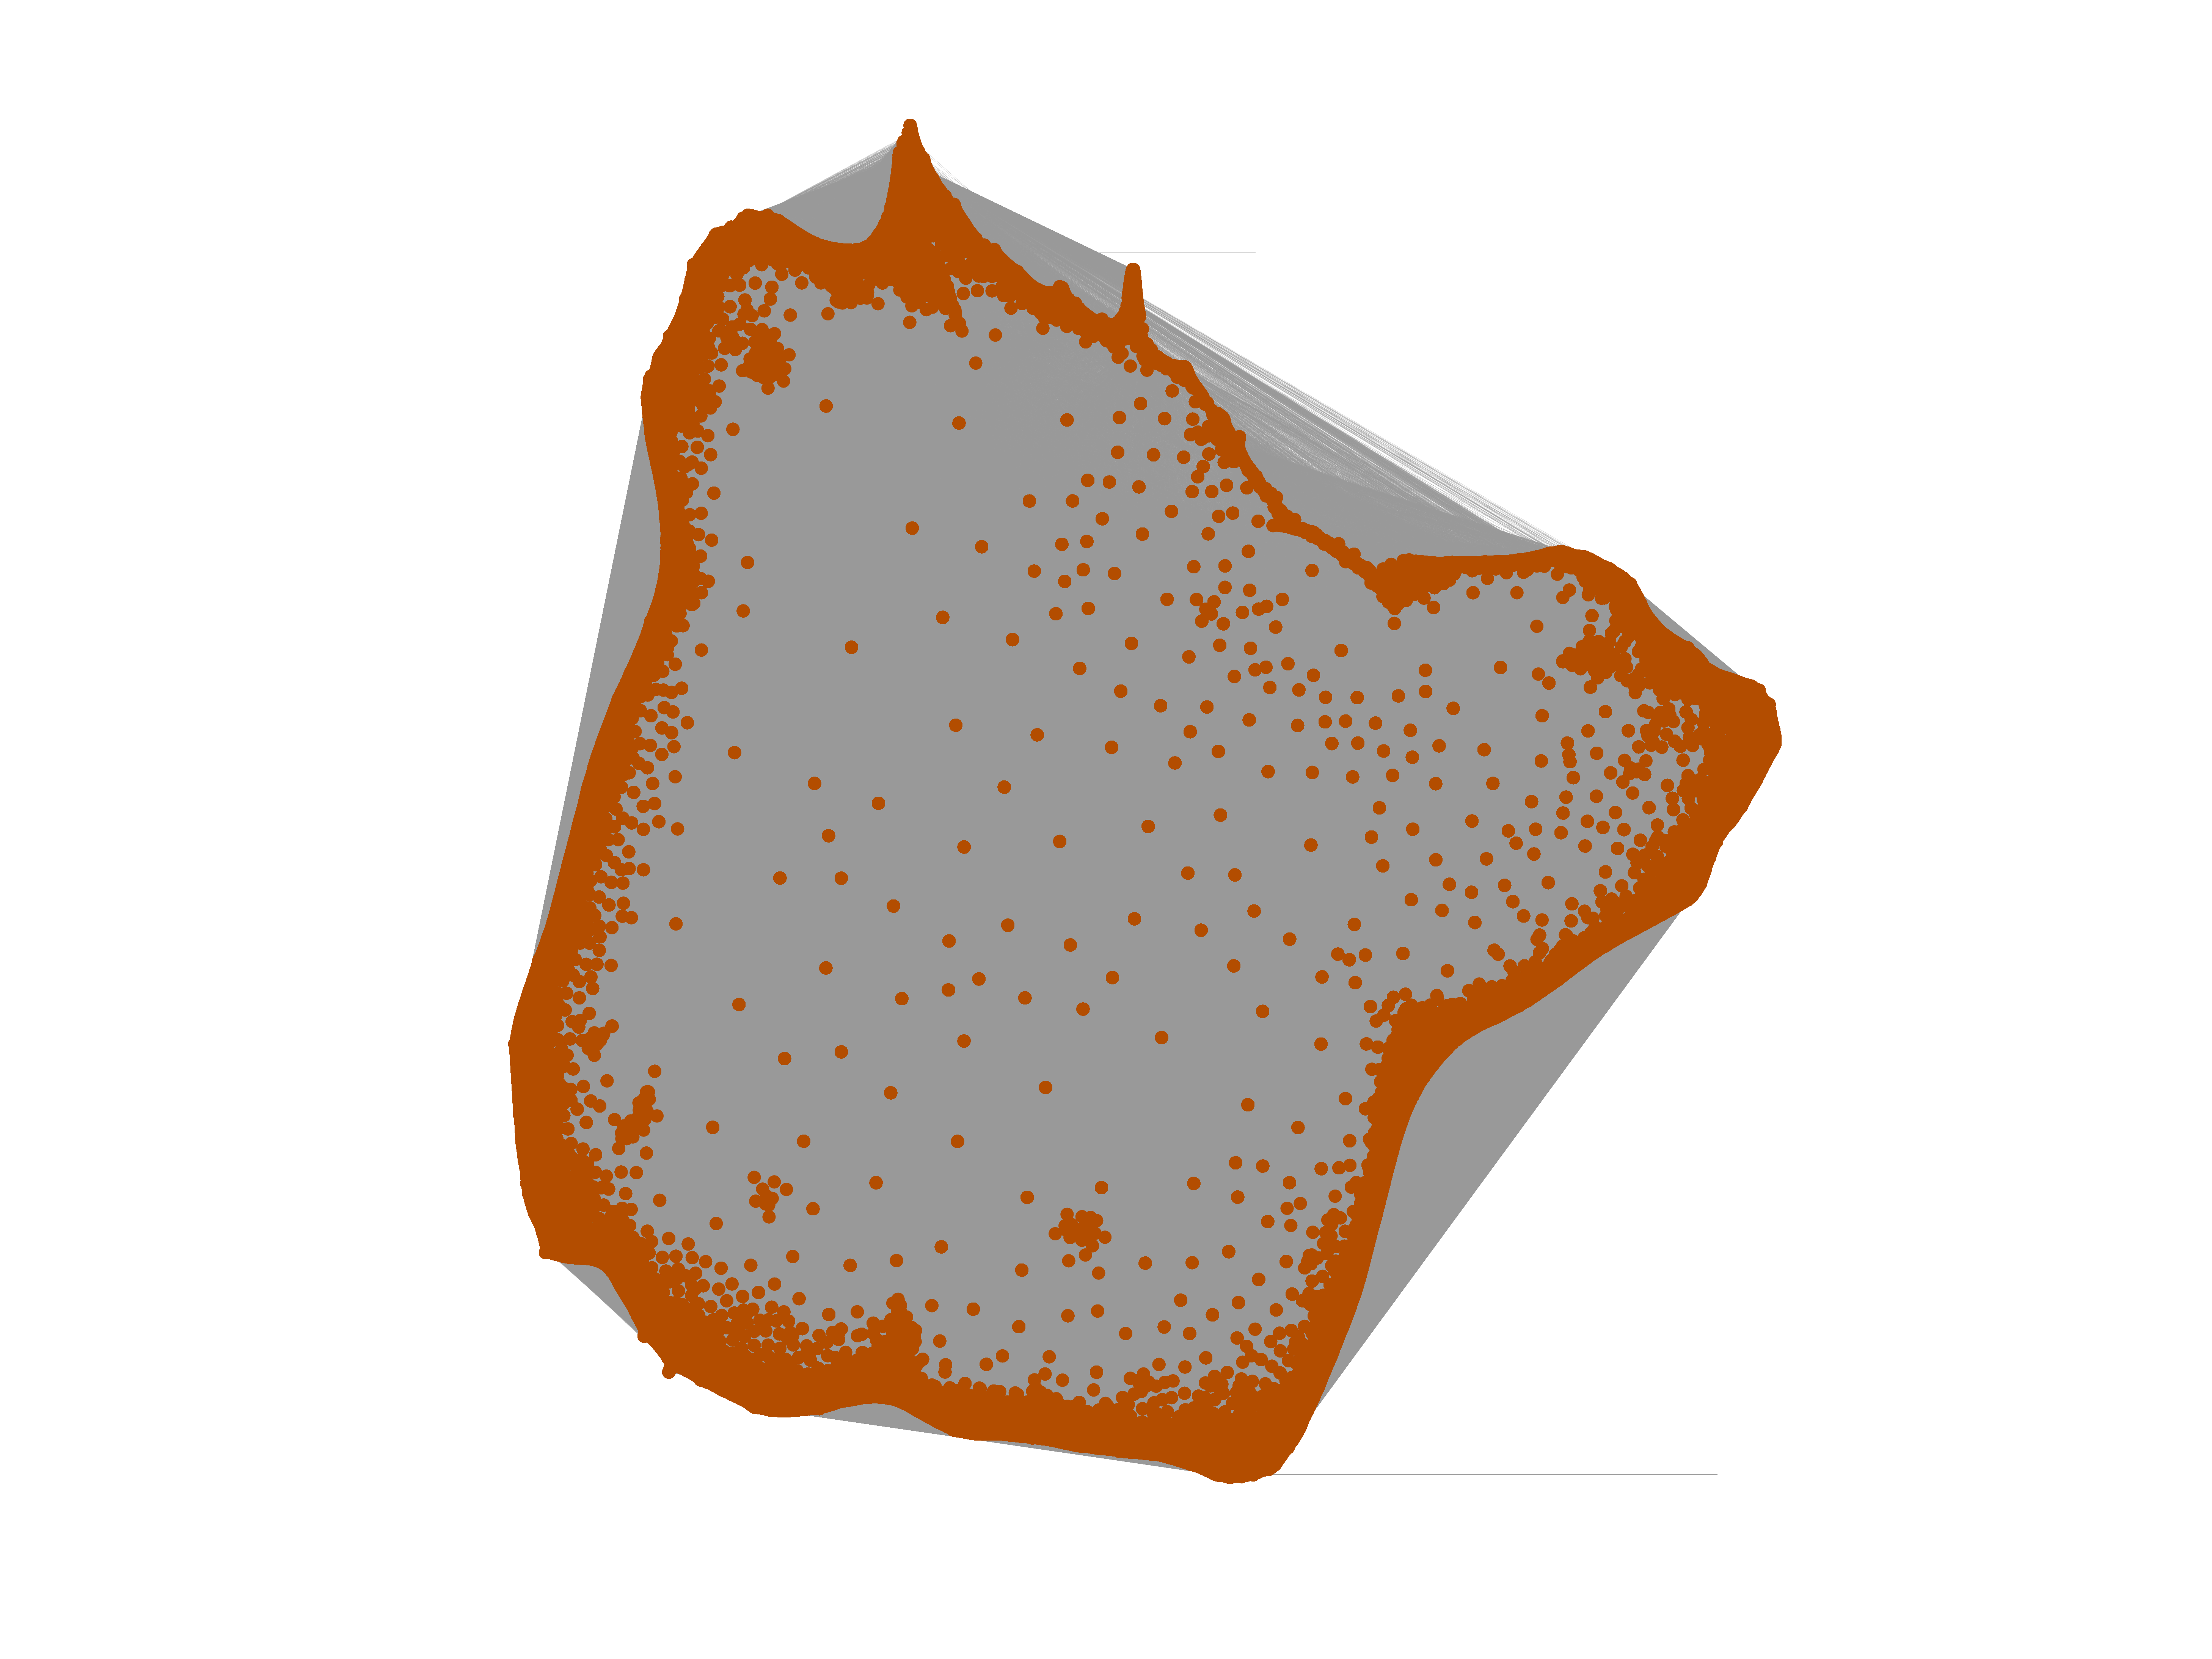
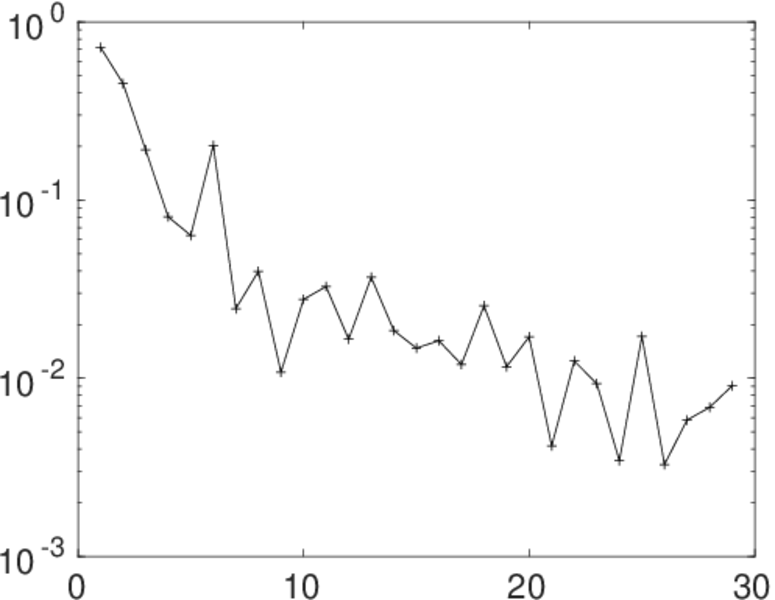
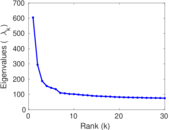
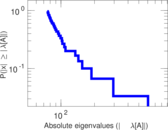
Matrix decompositions plots


Downloads
References
|
[1]
|
Jérôme Kunegis.
KONECT – The Koblenz Network Collection.
In Proc. Int. Conf. on World Wide Web Companion, pages
1343–1350, 2013.
[ http ]
|
|
[2]
|
T. Hogg and K. Lerman.
Social dynamics of Digg.
Eur. Phys. J. Data Sci., 1(5), 2012.
|
 KONECT ‣ Networks ‣
Buy Me a Coffee
KONECT ‣ Networks ‣
Buy Me a Coffee