Epinions
This is the bipartite rating network of Epinions, an online product rating
site. The nodes of the network are users and products, and each edge connects
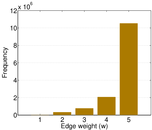
a user with a product and represents a rating. The weight of the edge is the
rating value.
Metadata
Statistics
| Size | n = | 876,252
|
| Left size | n1 = | 120,492
|
| Right size | n2 = | 755,760
|
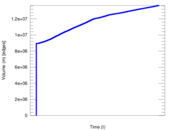
| Volume | m = | 13,668,320
|
| Wedge count | s = | 69,245,866,714
|
| Claw count | z = | 1,092,042,207,526,800
|
| Cross count | x = | 3.159 88 × 1019
|
| Square count | q = | 170,303,771,005
|
| 4-Tour count | T4 = | 1,639,442,650,152
|
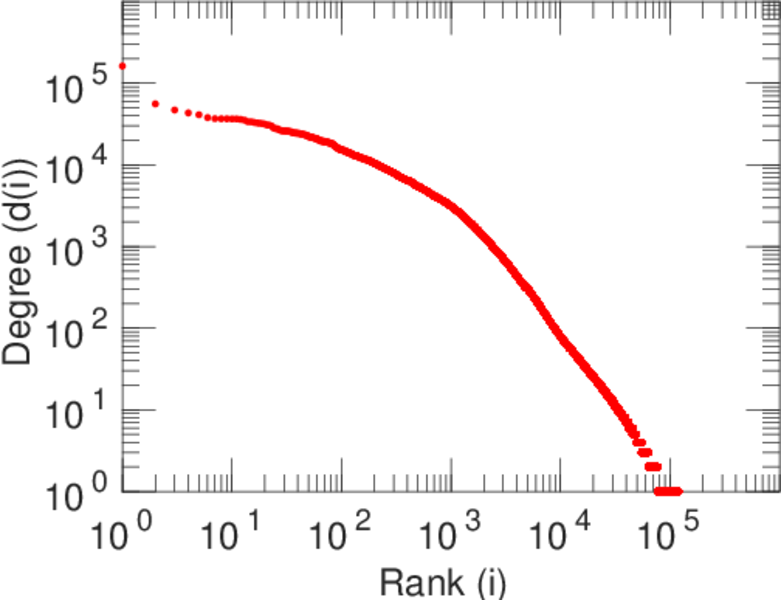
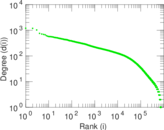
| Maximum degree | dmax = | 162,169
|
| Maximum left degree | d1max = | 162,169
|
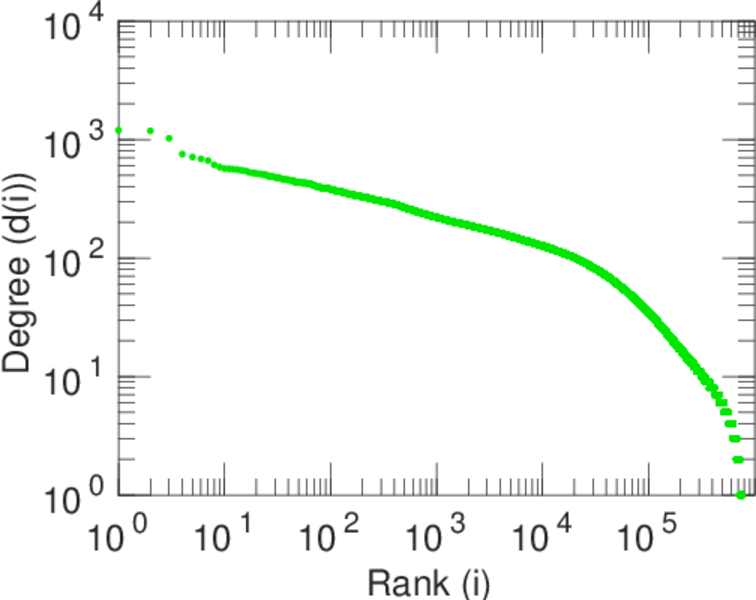
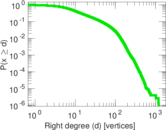
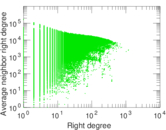
| Maximum right degree | d2max = | 1,195
|
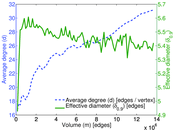
| Average degree | d = | 31.197 2
|
| Average left degree | d1 = | 113.438
|
| Average right degree | d2 = | 18.085 5
|
| Fill | p = | 0.000 150 097
|
| Size of LCC | N = | 875,502
|
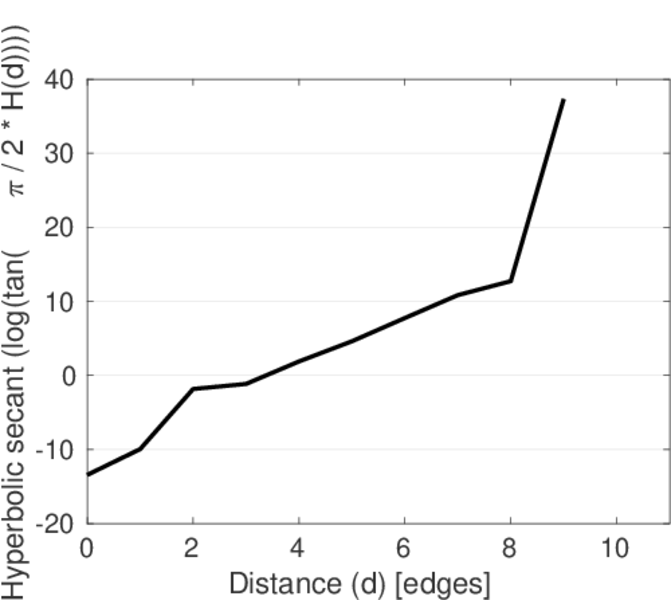
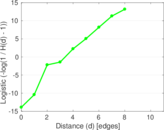
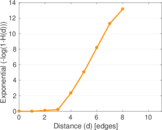
| Diameter | δ = | 12
|
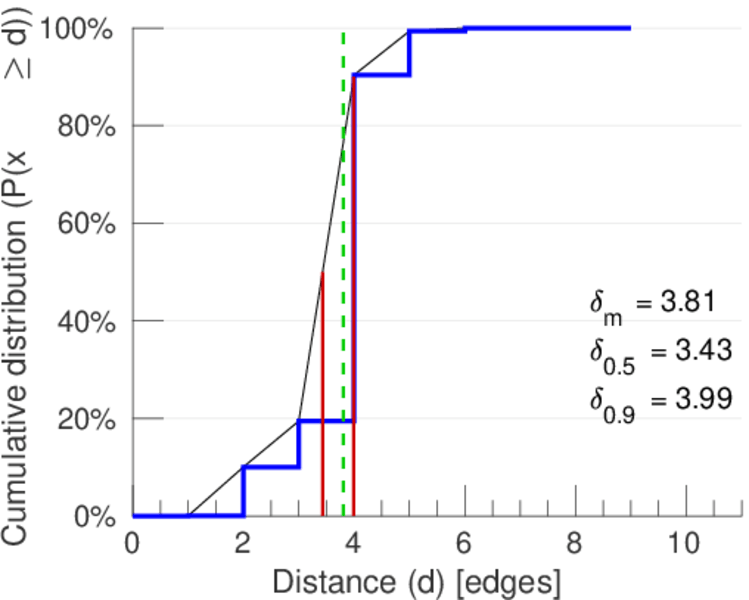
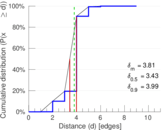
| 50-Percentile effective diameter | δ0.5 = | 3.430 78
|
| 90-Percentile effective diameter | δ0.9 = | 3.994 56
|
| Median distance | δM = | 4
|
| Mean distance | δm = | 3.808 04
|
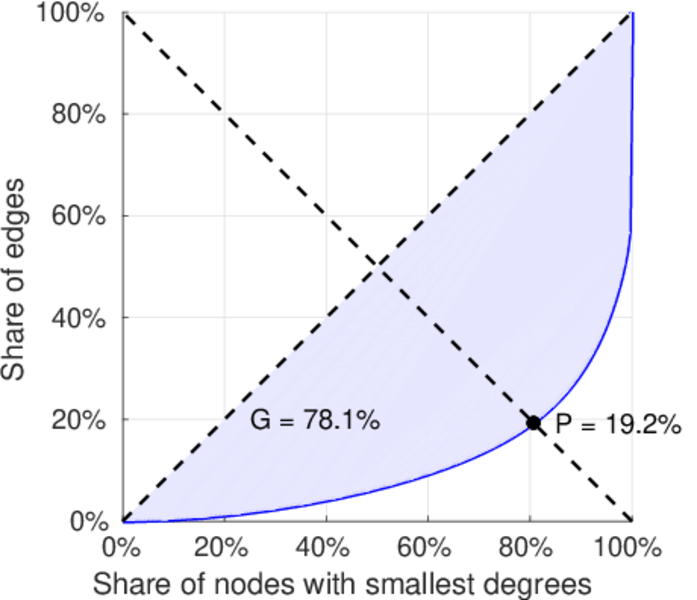
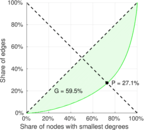
| Gini coefficient | G = | 0.769 429
|
| Balanced inequality ratio | P = | 0.197 498
|
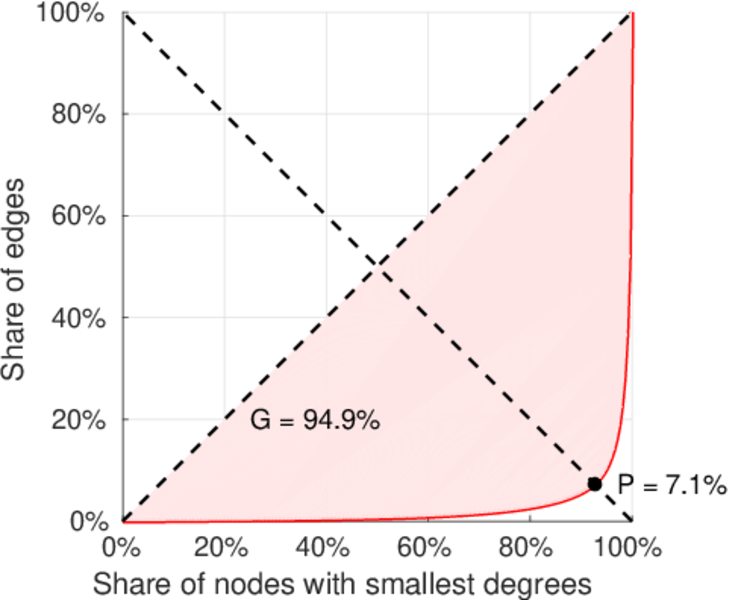
| Left balanced inequality ratio | P1 = | 0.071 153 4
|
| Right balanced inequality ratio | P2 = | 0.270 834
|
| Relative edge distribution entropy | Her = | 0.828 524
|
| Power law exponent | γ = | 1.465 77
|
| Tail power law exponent | γt = | 1.951 00
|
| Degree assortativity | ρ = | −0.042 132 4
|
| Degree assortativity p-value | pρ = | 0.000 00
|
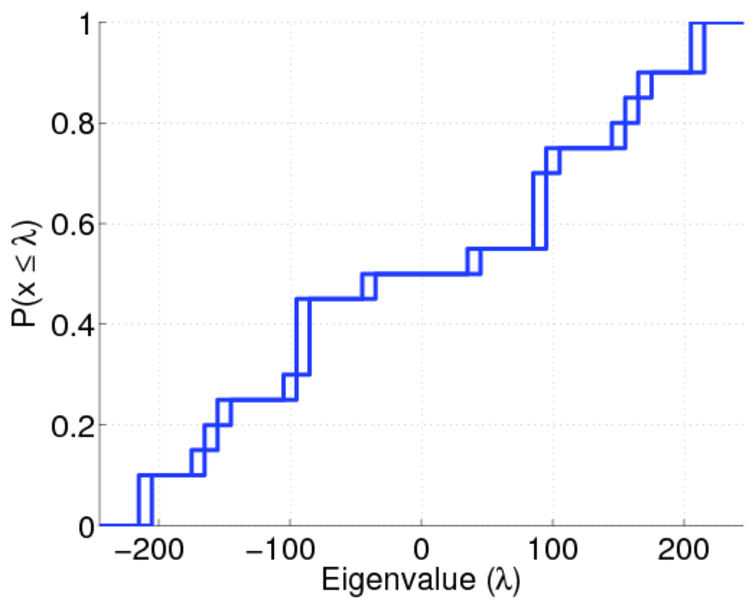
| Spectral norm | α = | 245.159
|
| Spectral separation | |λ1[A] / λ2[A]| = | 1.252 46
|
| Negativity | ζ = | 0.228 368
|
| Controllability | C = | 663,683
|
| Relative controllability | Cr = | 0.757 411
|
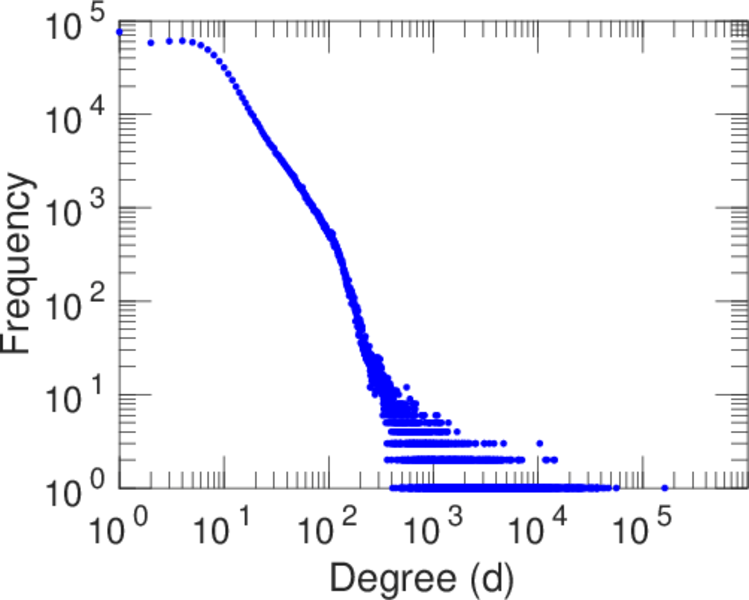
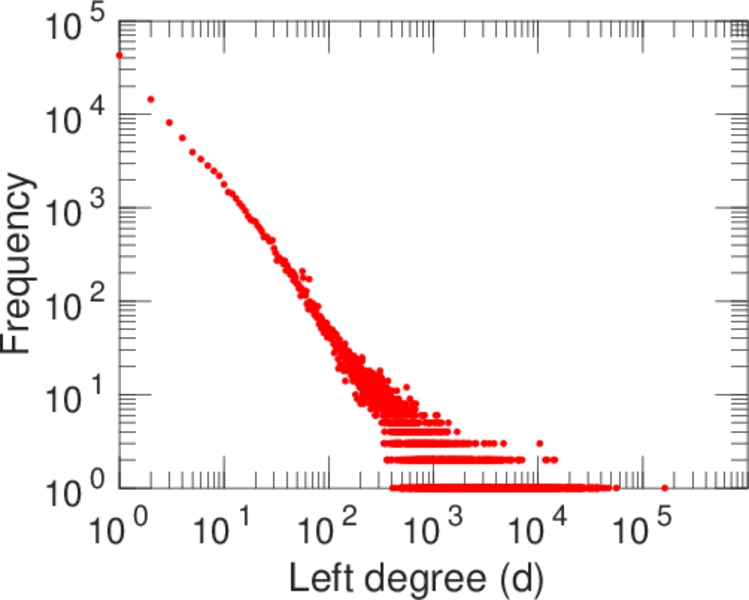
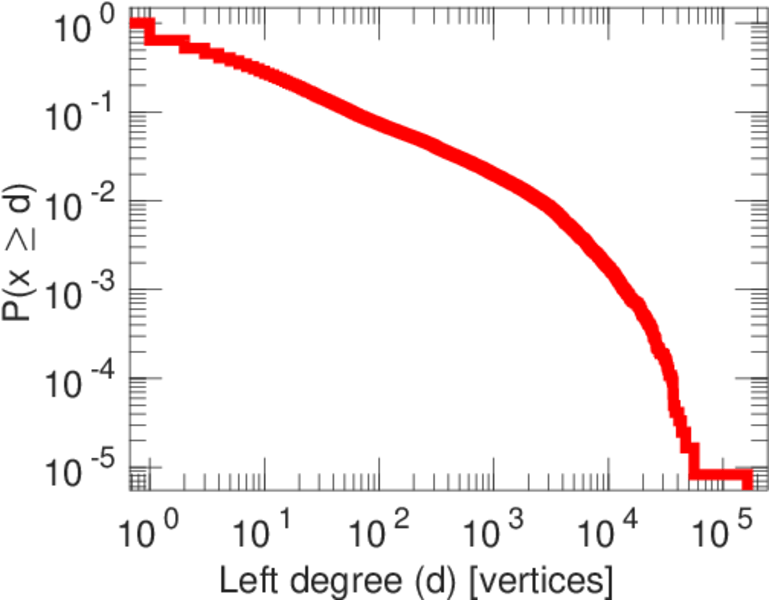
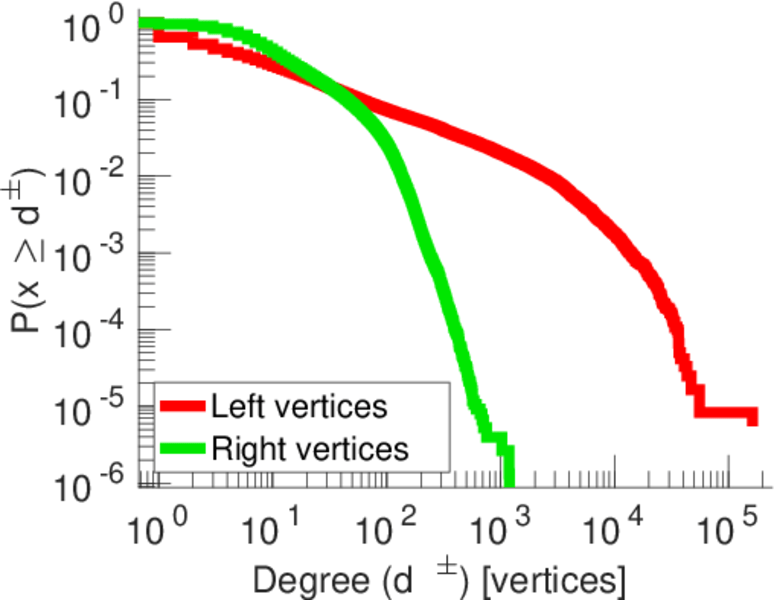
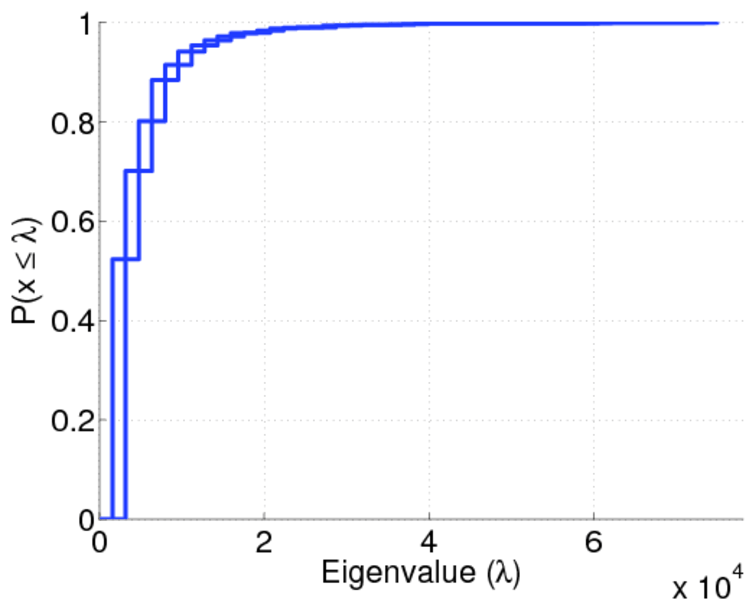
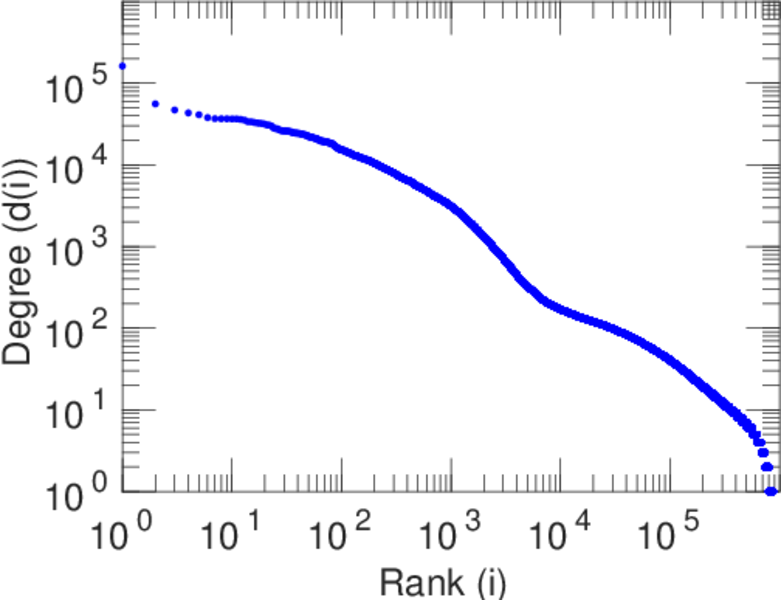
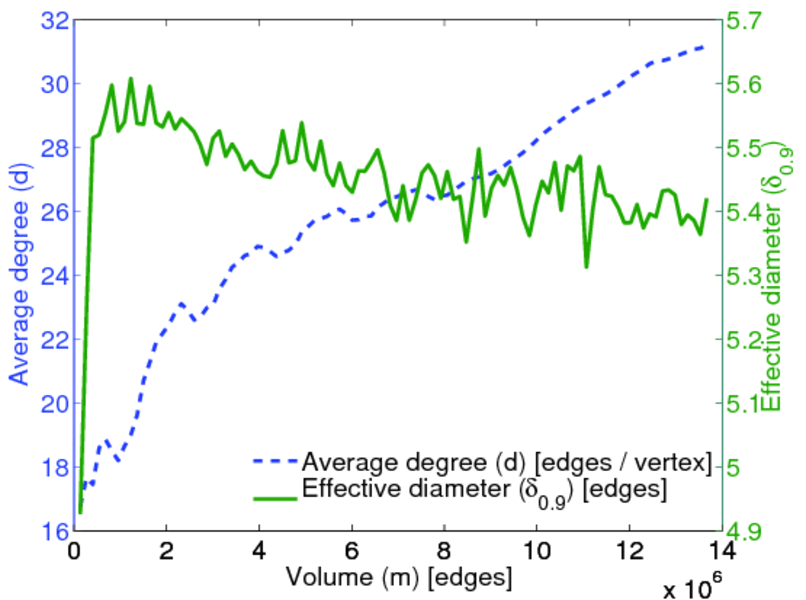
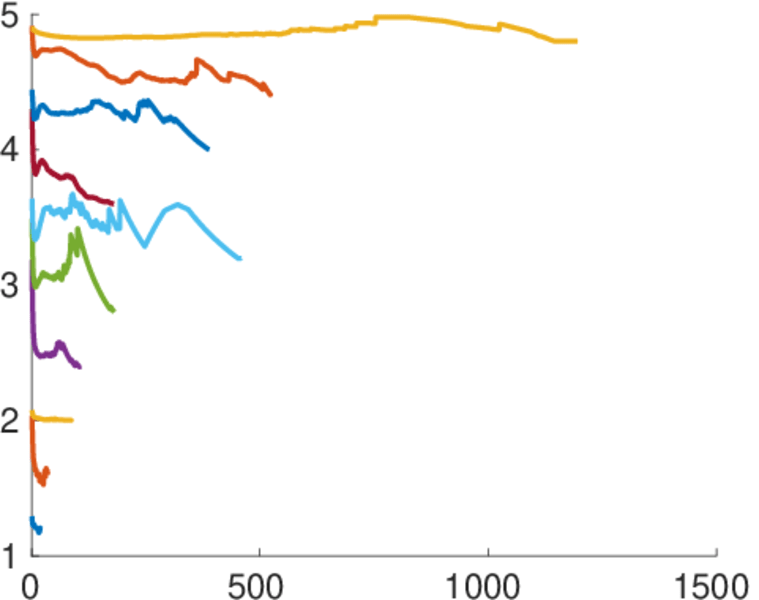
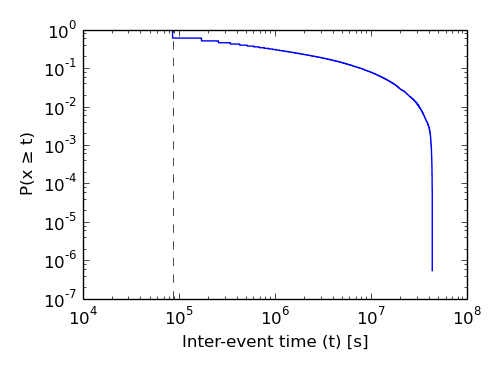
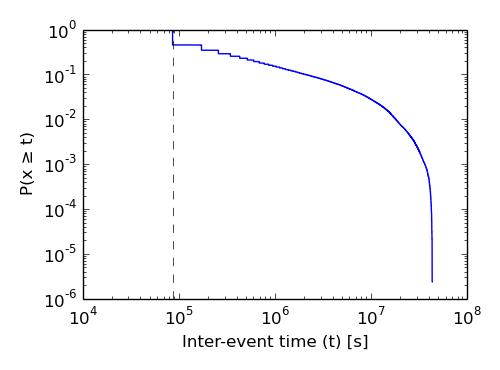
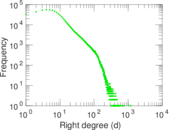
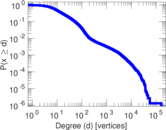
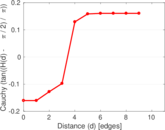
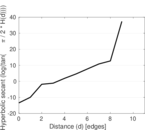
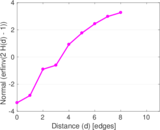
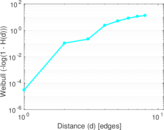
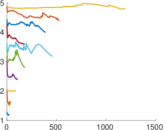
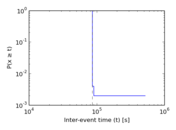
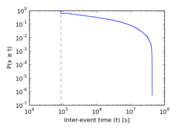
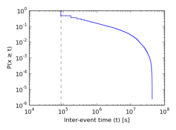
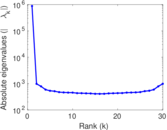
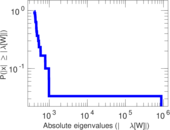
Plots


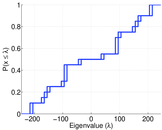

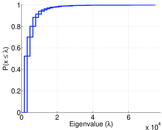


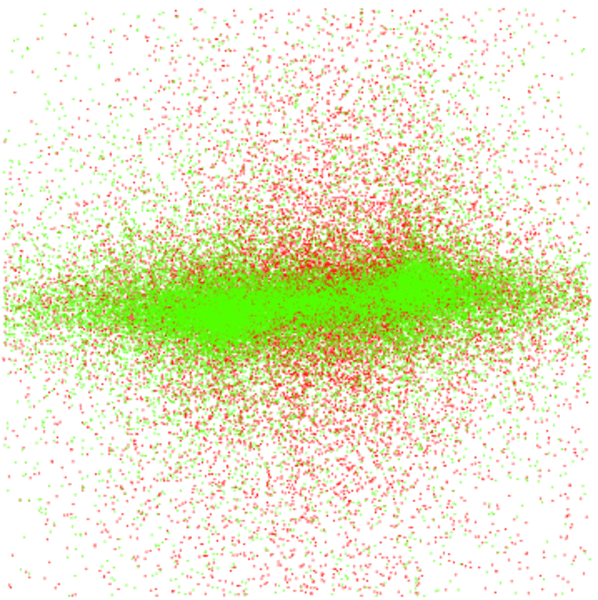
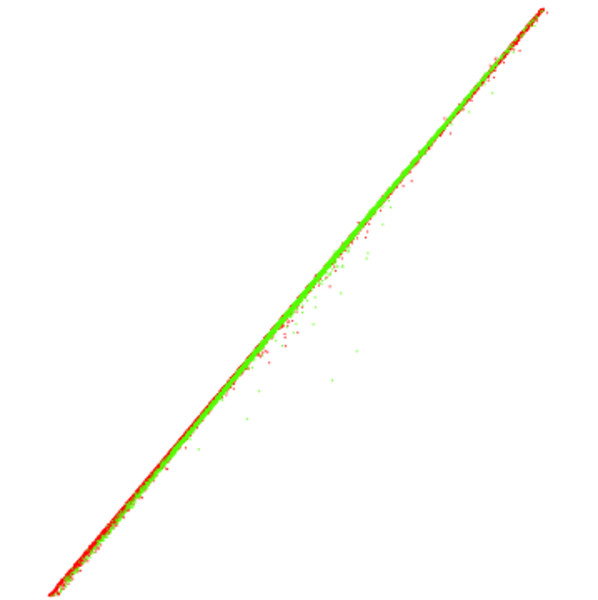
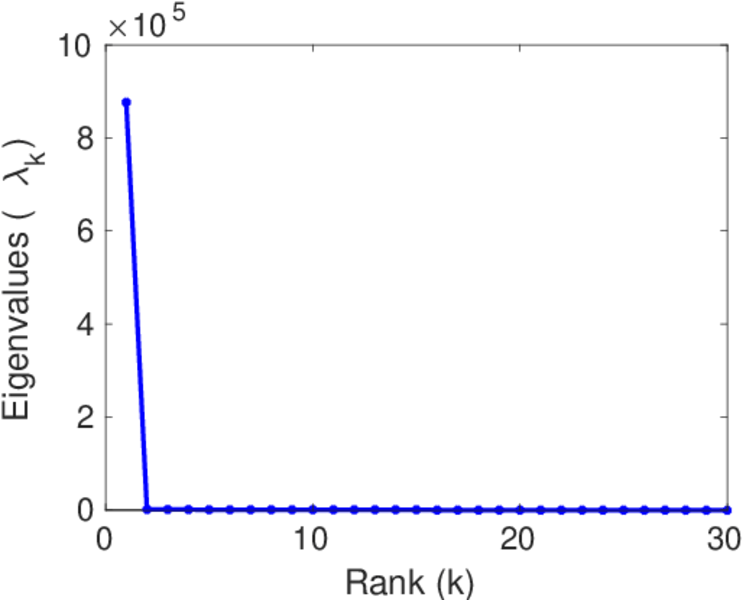
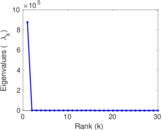
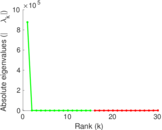
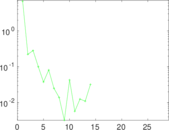
Matrix decompositions plots
Downloads
References
|
[1]
|
Jérôme Kunegis.
KONECT – The Koblenz Network Collection.
In Proc. Int. Conf. on World Wide Web Companion, pages
1343–1350, 2013.
[ http ]
|
|
[2]
|
Paolo Massa and Paolo Avesani.
Controversial users demand local trust metrics: an experimental study
on epinions.com community.
In Proc. American Association for Artif. Intell. Conf., pages
121–126, 2005.
|
 KONECT ‣ Networks ‣
Buy Me a Coffee
KONECT ‣ Networks ‣
Buy Me a Coffee