Epinions
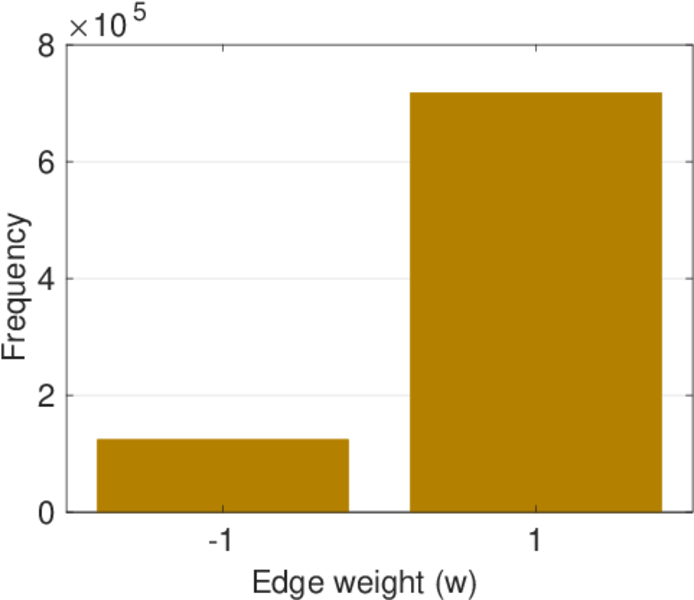
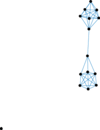
This is the trust and distrust network of Epinions, an online product rating
site. The network consist of individual users connected by directed trust and
distrust links. Edges have the weight +1 for trust and −1 for distrust. Note
that a user can trust or distrust himself, and therefore the network contains
loops.
Metadata
Statistics
| Size | n = | 131,828
|
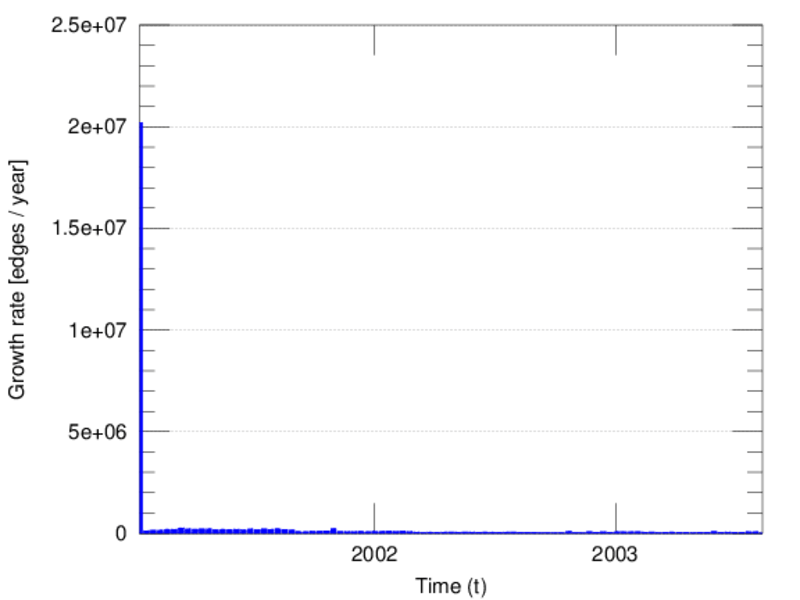
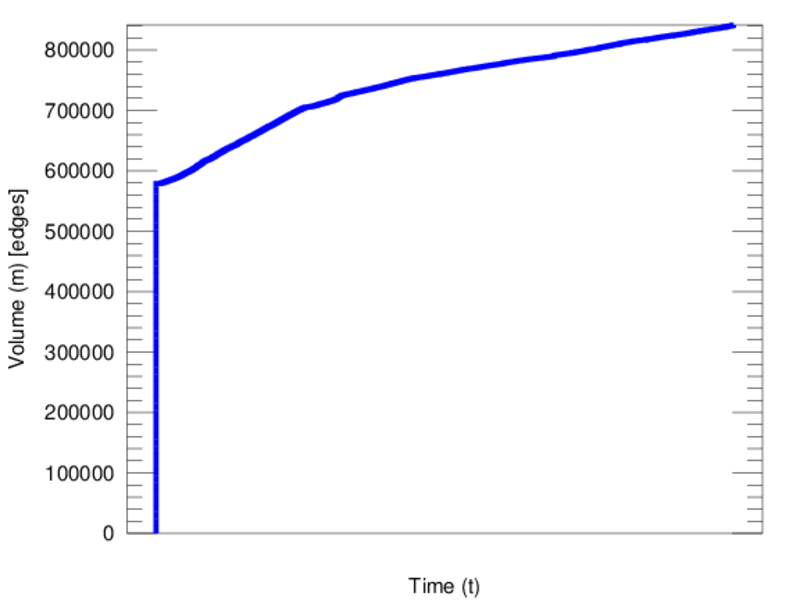
| Volume | m = | 841,372
|
| Loop count | l = | 573
|
| Wedge count | s = | 182,193,467
|
| Cross count | x = | 31,252,929,210,362
|
| Triangle count | t = | 4,910,076
|
| Square count | q = | 715,390,258
|
| 4-Tour count | T4 = | 6,453,318,352
|
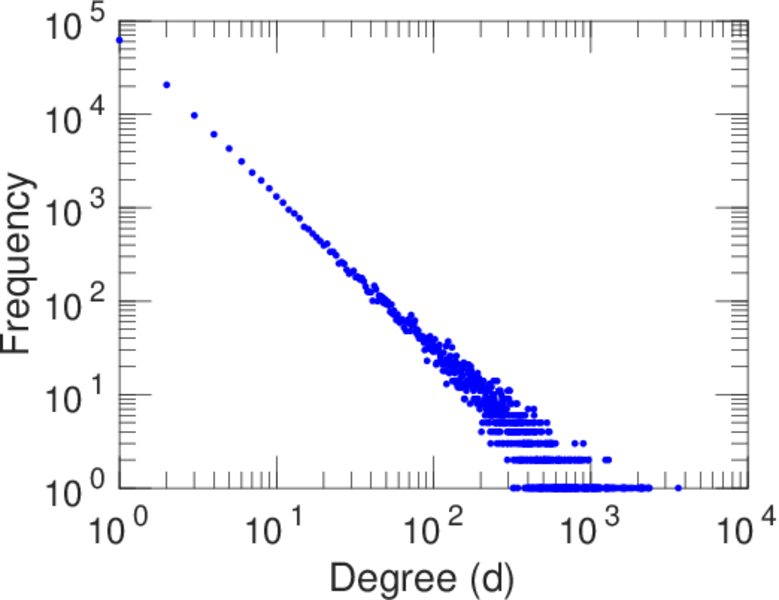
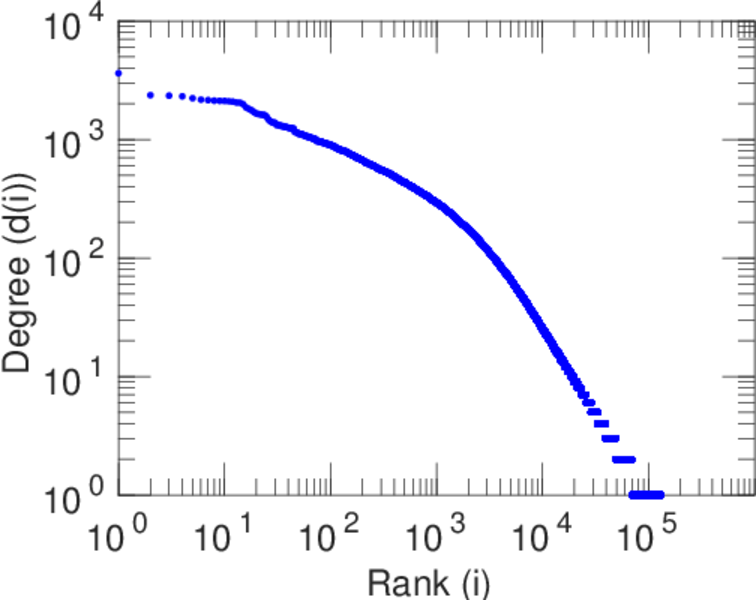
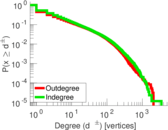
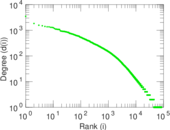
| Maximum degree | dmax = | 3,622
|
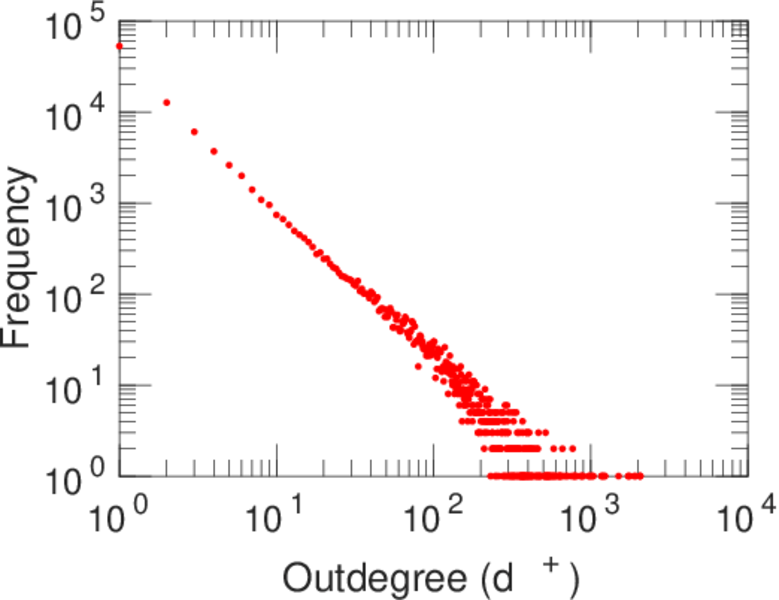
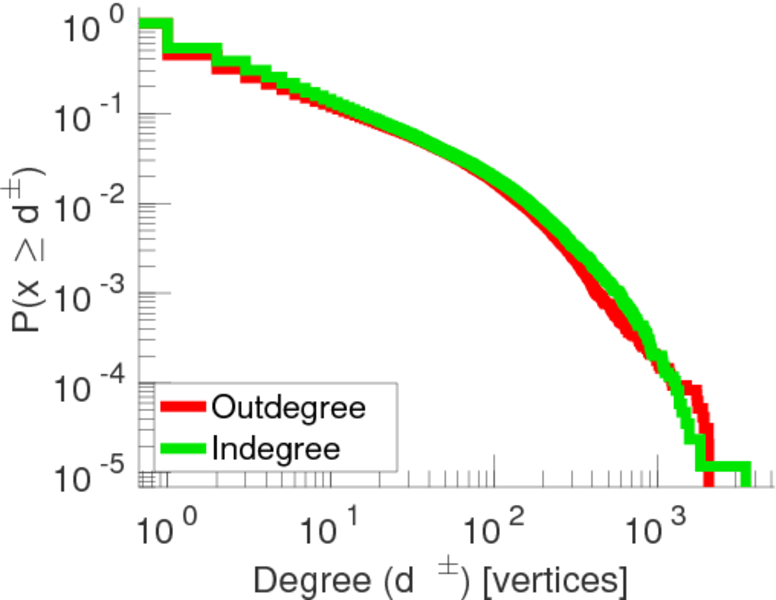
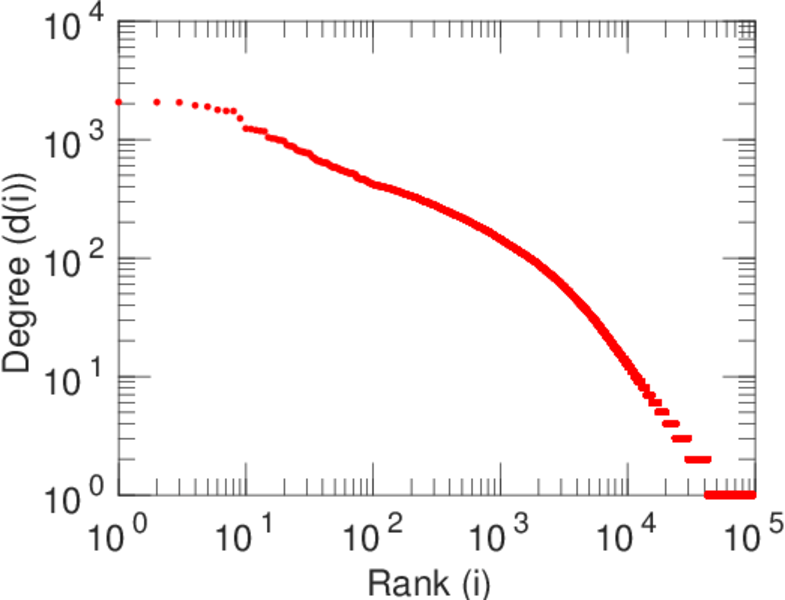
| Maximum outdegree | d+max = | 2,070
|
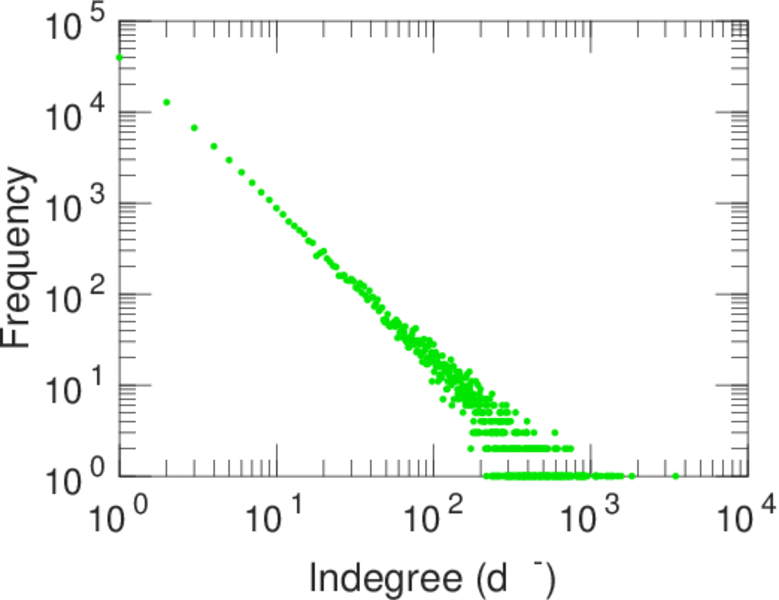
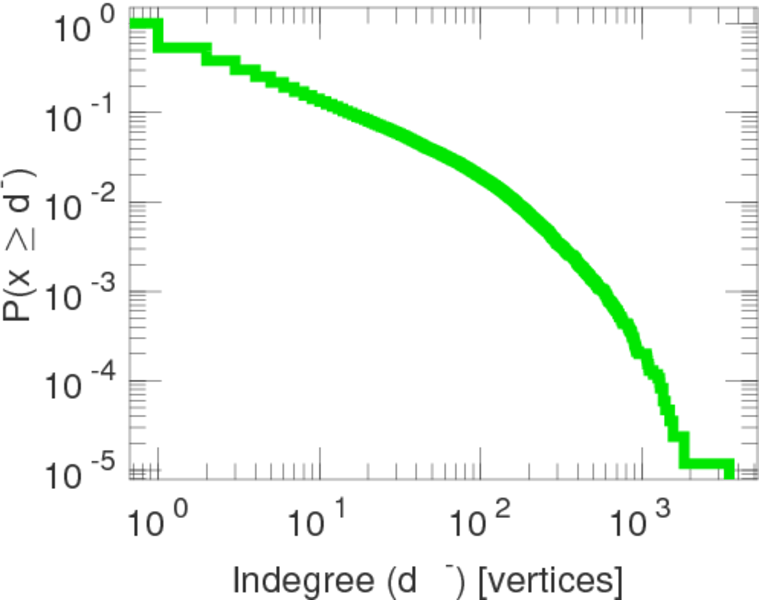
| Maximum indegree | d−max = | 3,478
|
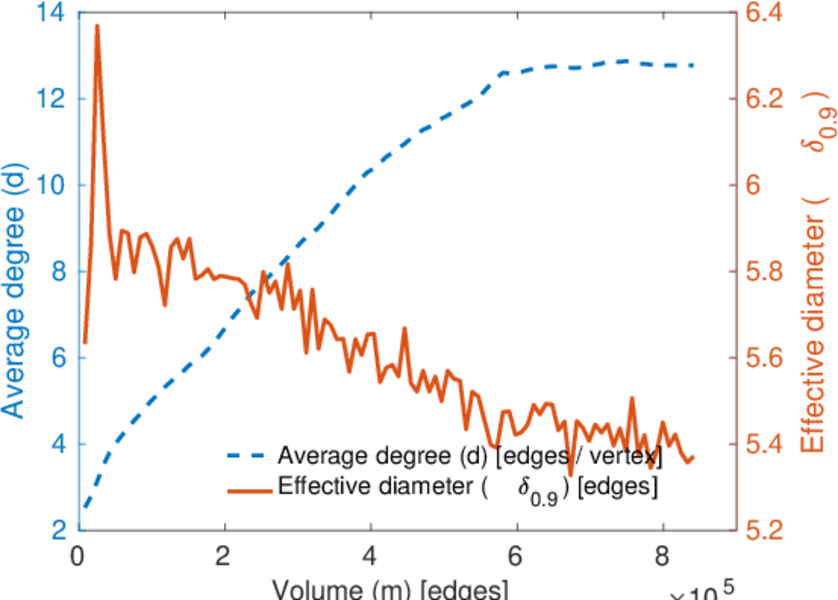
| Average degree | d = | 12.764 7
|
| Fill | p = | 4.841 42 × 10−5
|
| Size of LCC | N = | 119,130
|
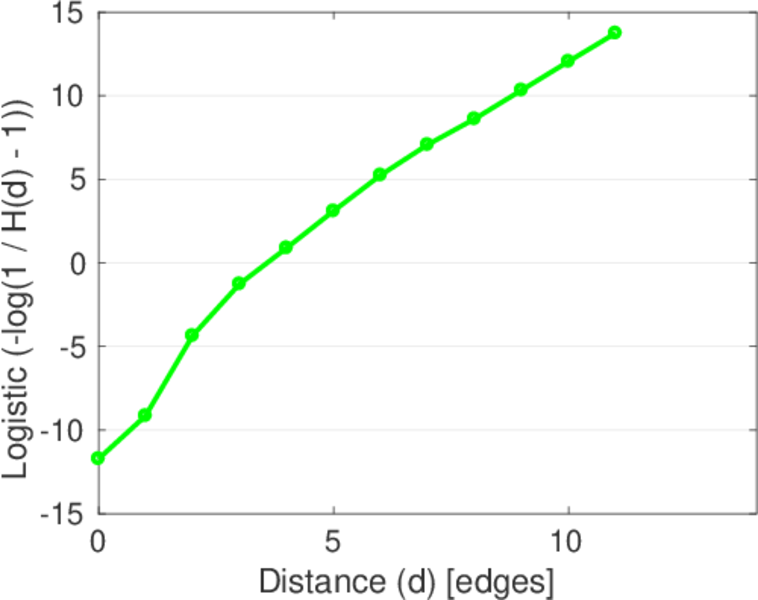
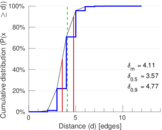
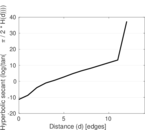
| Diameter | δ = | 16
|
| 50-Percentile effective diameter | δ0.5 = | 3.574 21
|
| 90-Percentile effective diameter | δ0.9 = | 4.771 62
|
| Median distance | δM = | 4
|
| Mean distance | δm = | 4.109 14
|
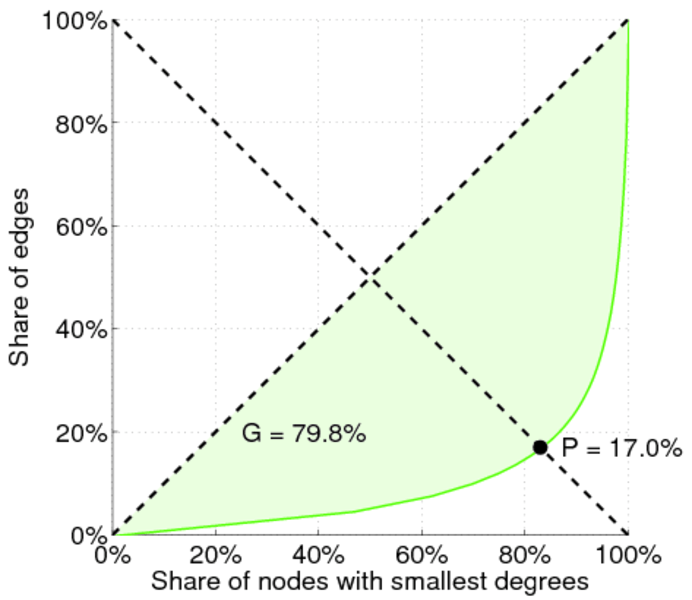
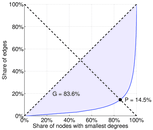
| Balanced inequality ratio | P = | 0.144 853
|
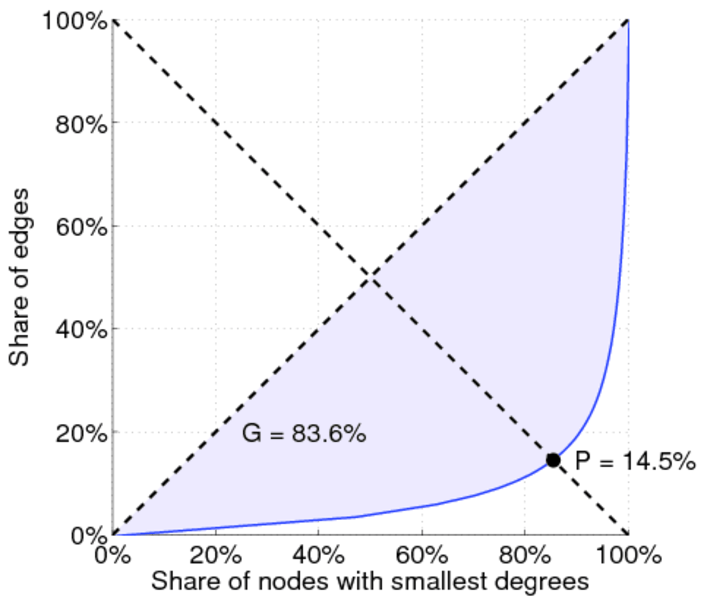
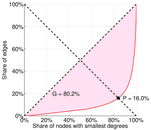
| Outdegree balanced inequality ratio | P+ = | 0.159 785
|
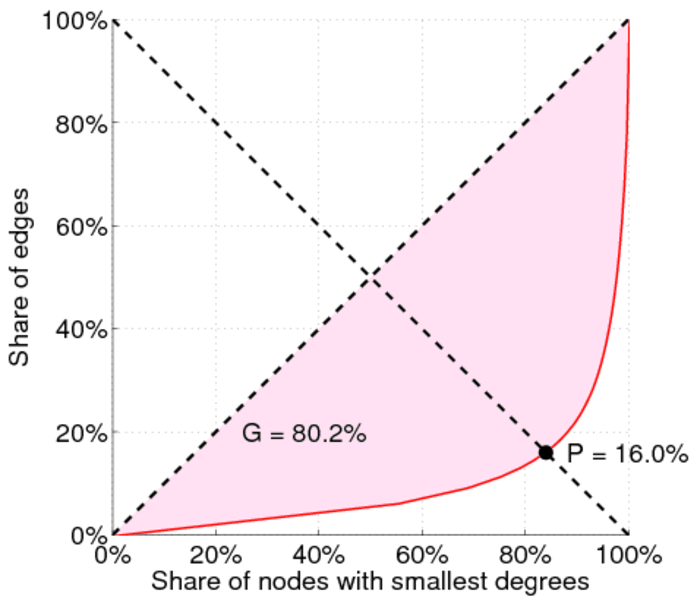
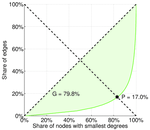
| Indegree balanced inequality ratio | P− = | 0.169 681
|
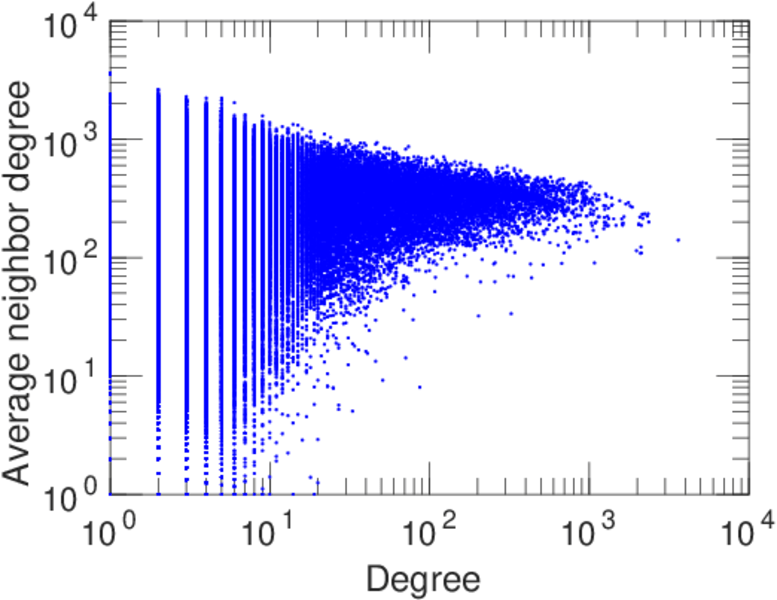
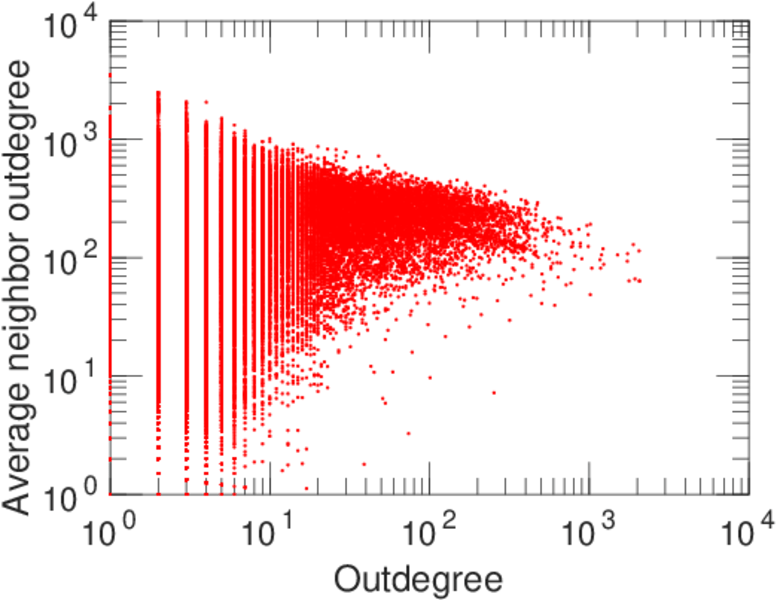
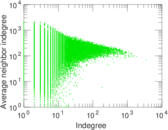
| Degree assortativity | ρ = | −0.069 571 4
|
| Degree assortativity p-value | pρ = | 0.000 00
|
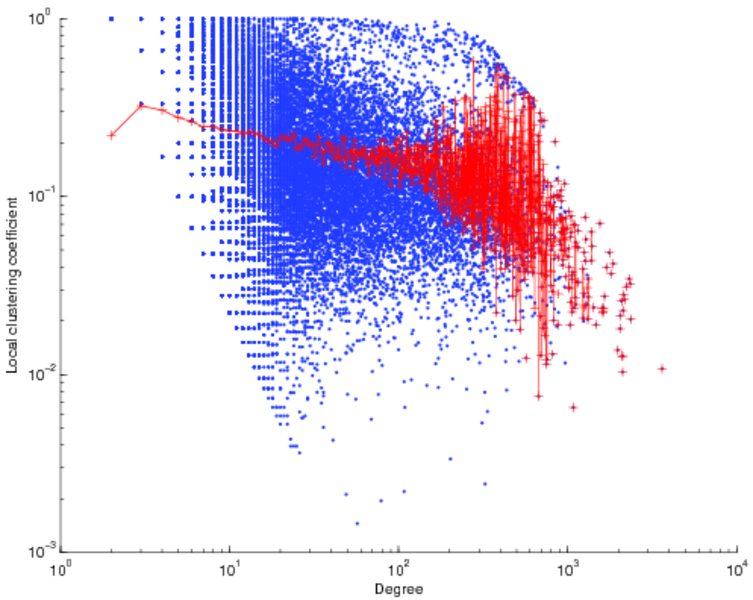
| Clustering coefficient | c = | 0.080 849 4
|
| Spectral norm | α = | 310.179
|
| Operator 2-norm | ν = | 167.764
|
| Cyclic eigenvalue | π = | 143.123
|
| Algebraic connectivity | a = | 0.002 810 82
|
| Spectral separation | |λ1[A] / λ2[A]| = | 1.138 86
|
| Reciprocity | y = | 0.308 723
|
| Non-bipartivity | bA = | 0.755 904
|
| Spectral bipartite frustration | bK = | 0.000 656 904
|
| Negativity | ζ = | 0.147 028
|
| Algebraic conflict | ξ = | 0.031 081 6
|
| Triadic conflict | τ = | 0.095 043 7
|
| Spectral signed frustration | φ = | 0.000 659 724
|
| Controllability | C = | 79,193
|
| Relative controllability | Cr = | 0.600 730
|
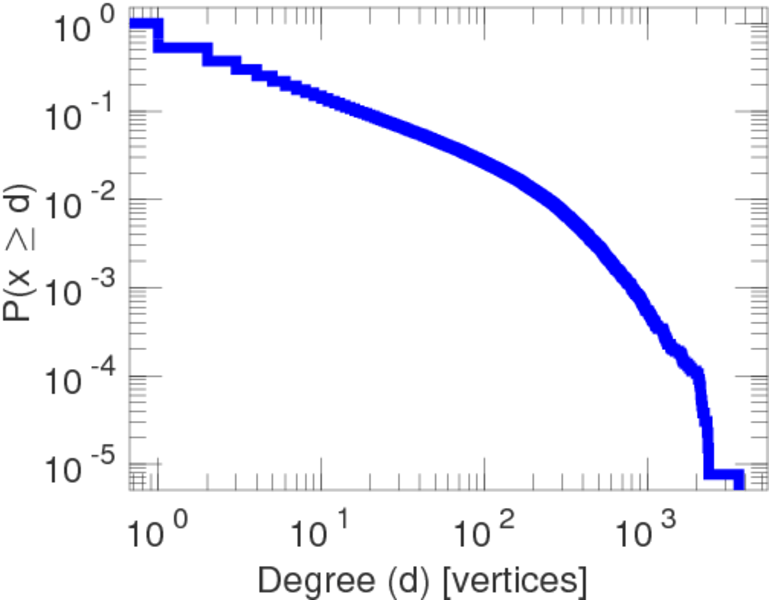
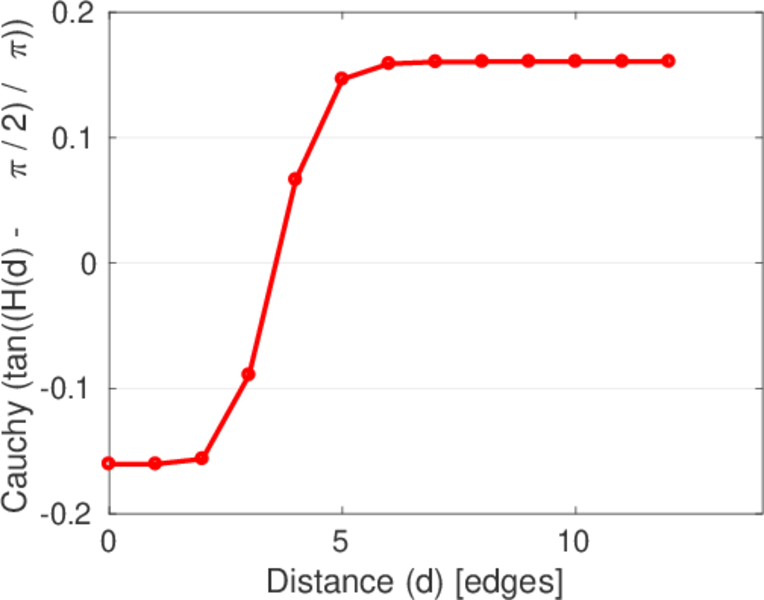
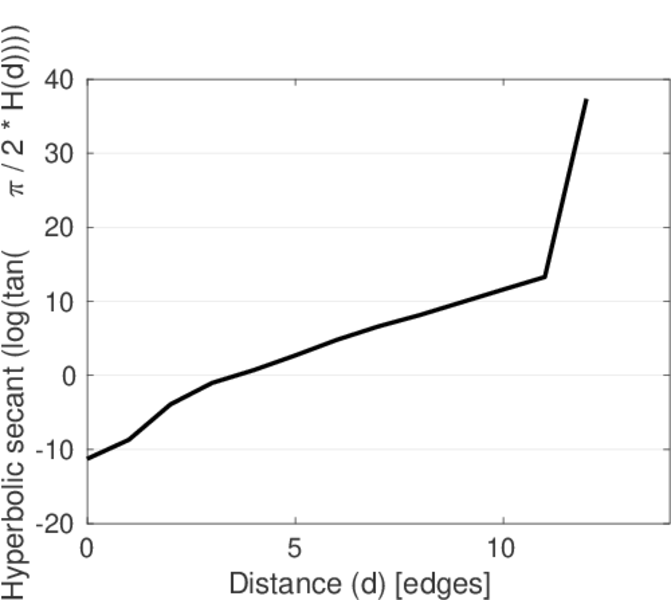
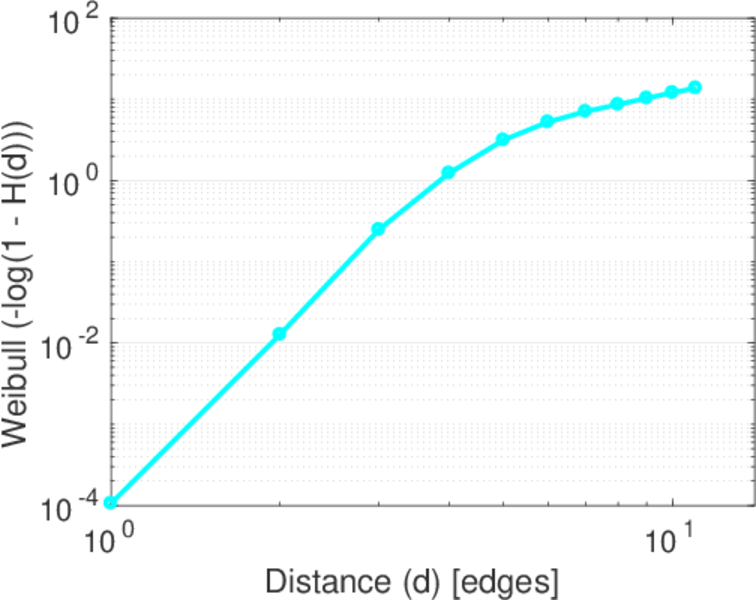
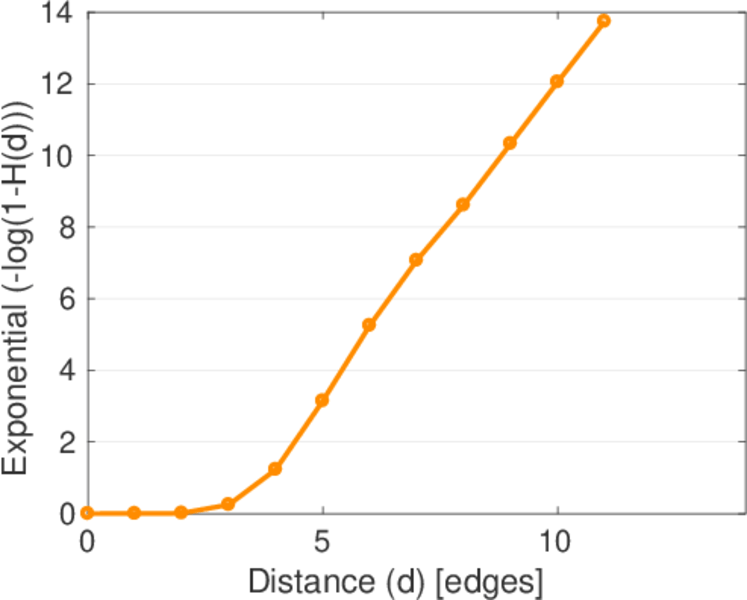
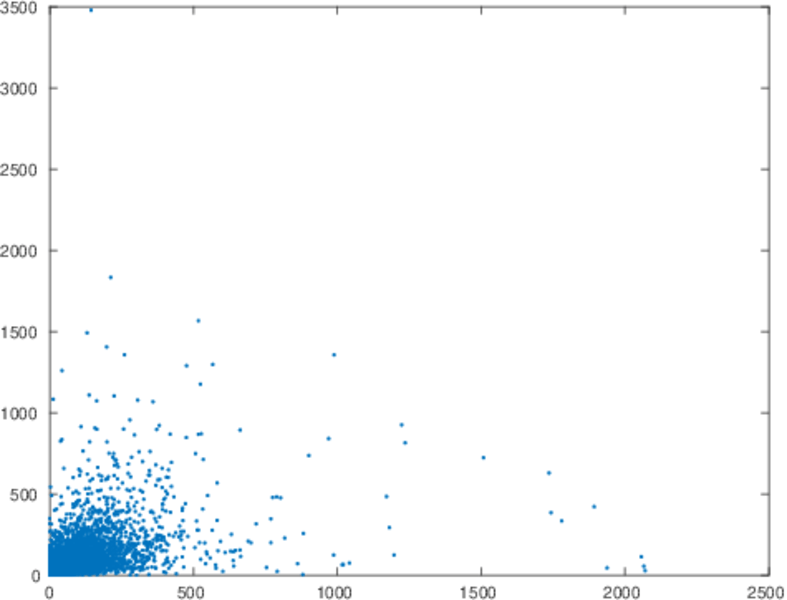
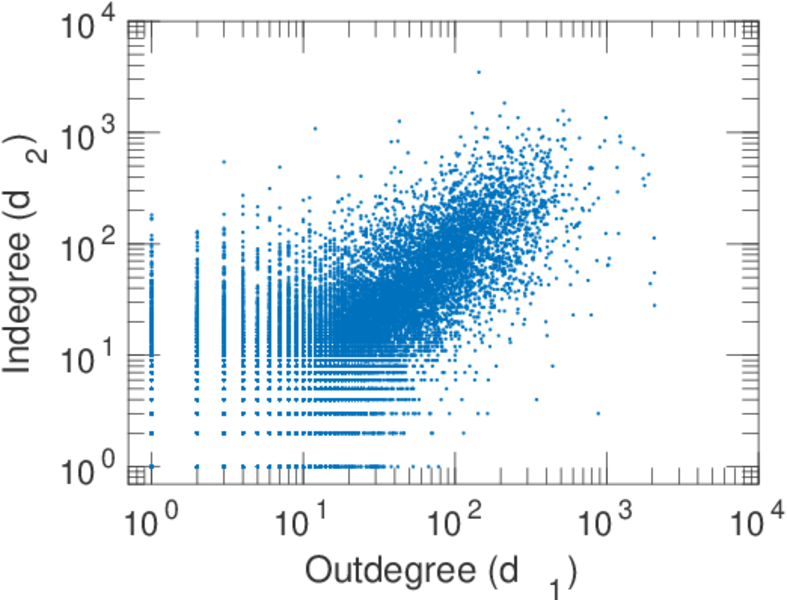
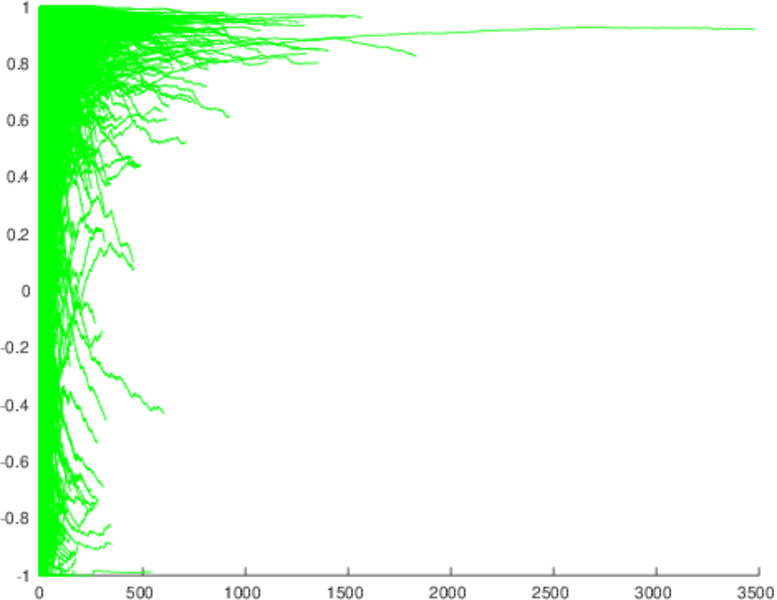
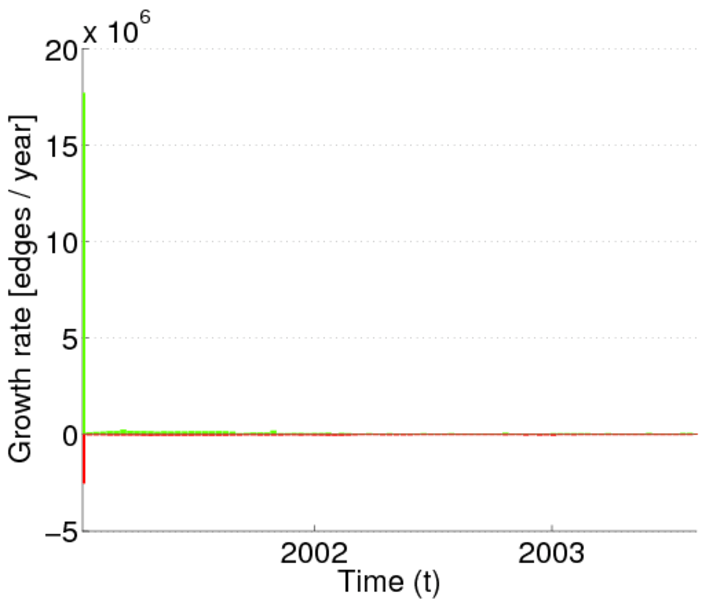
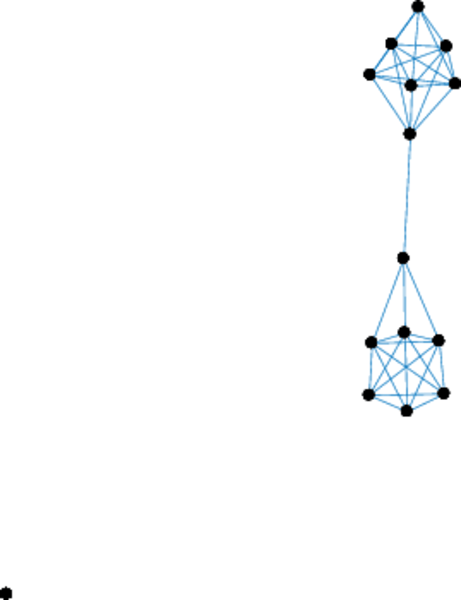
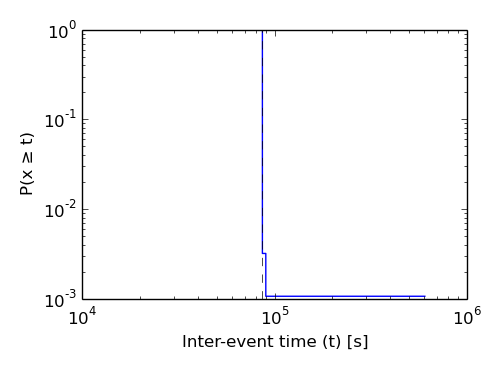
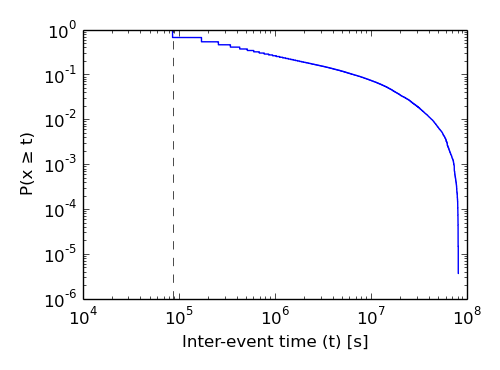
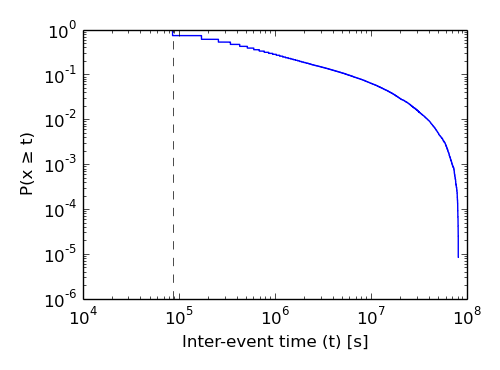
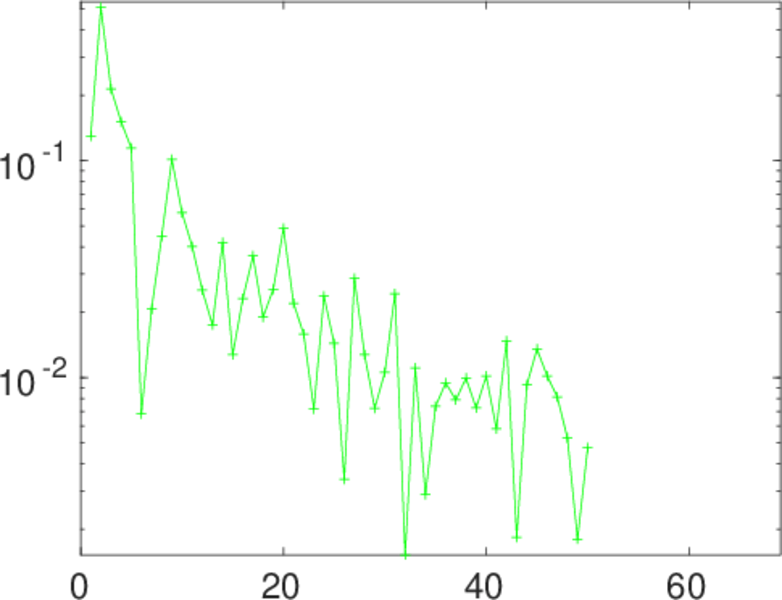
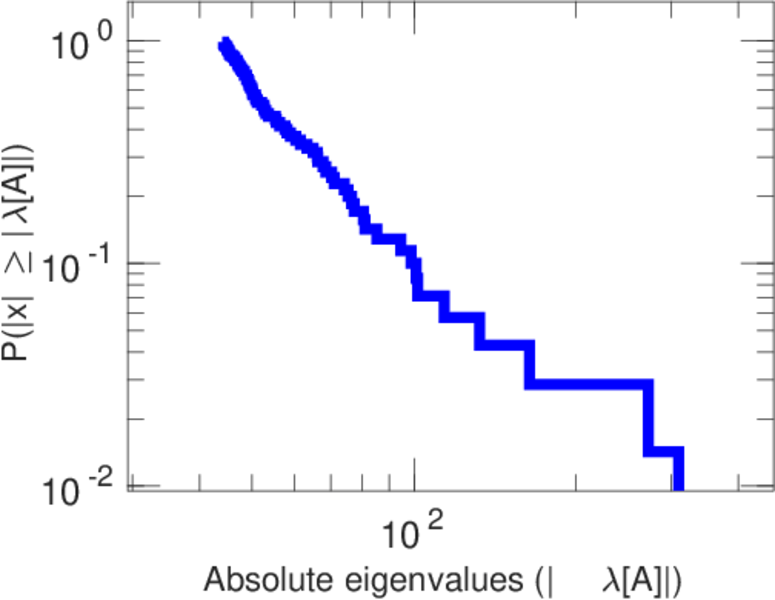
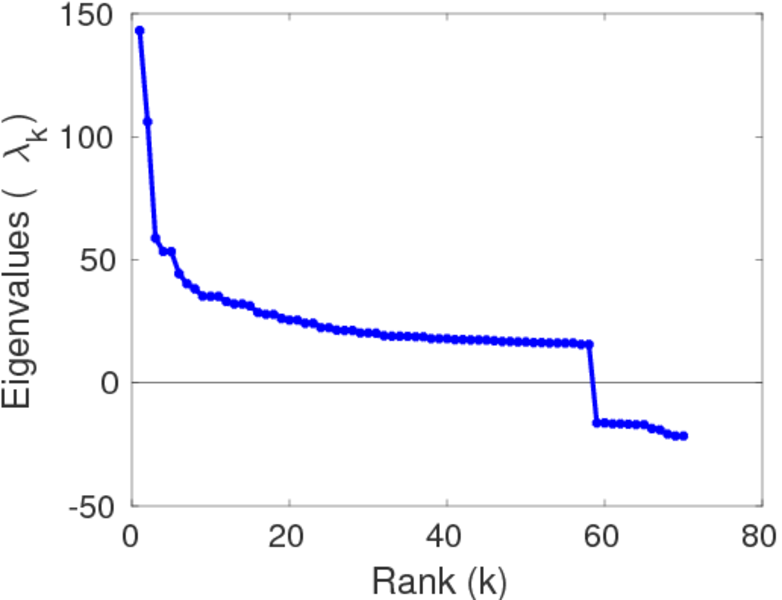
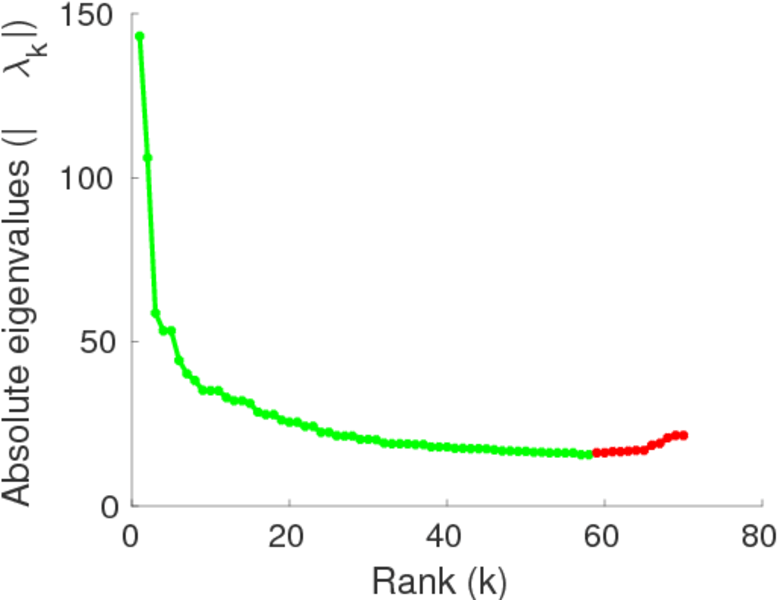
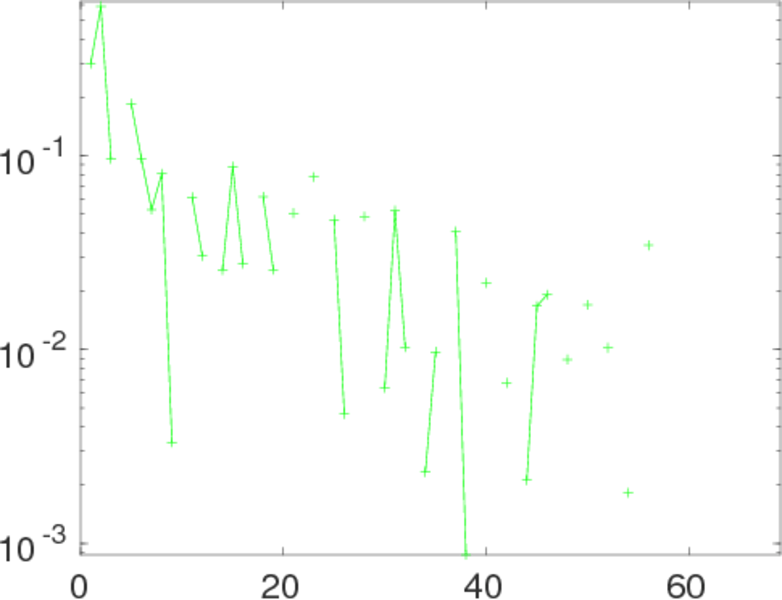
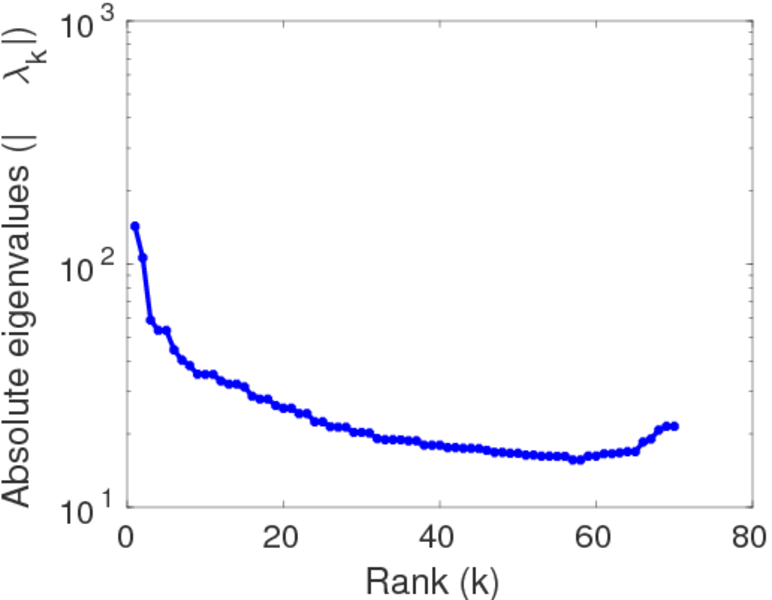
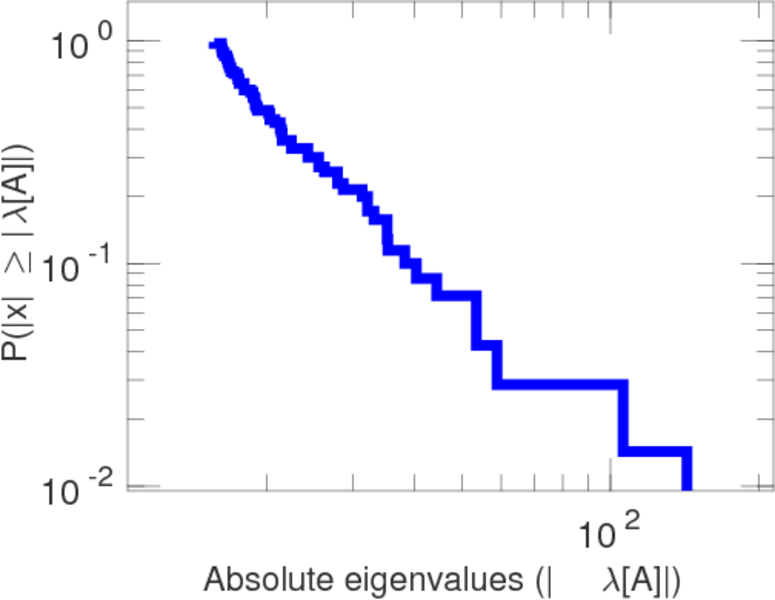
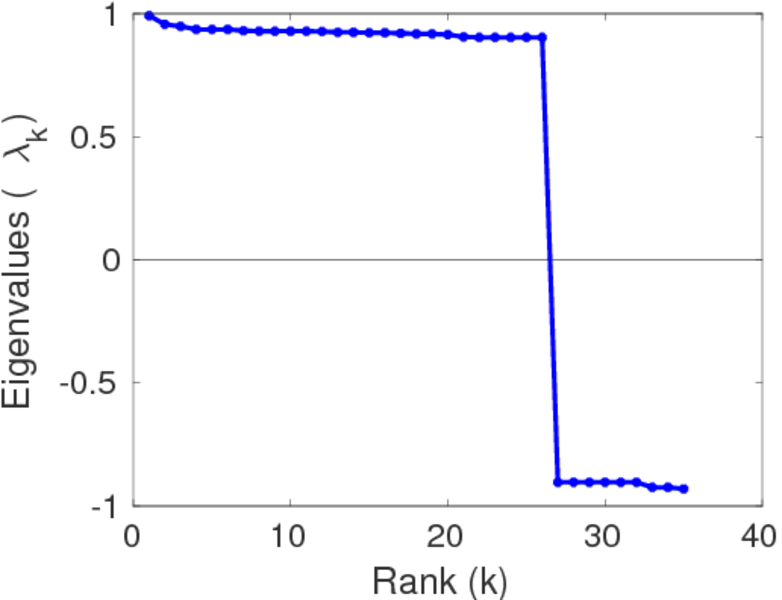
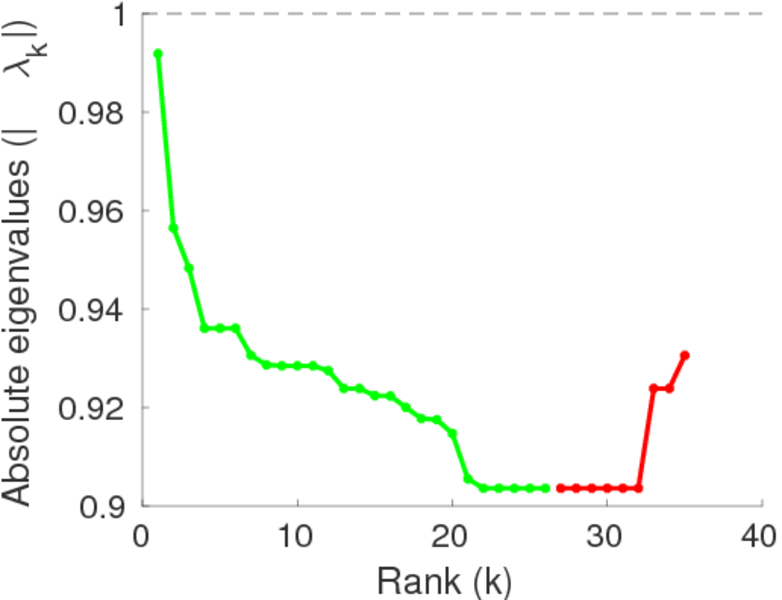
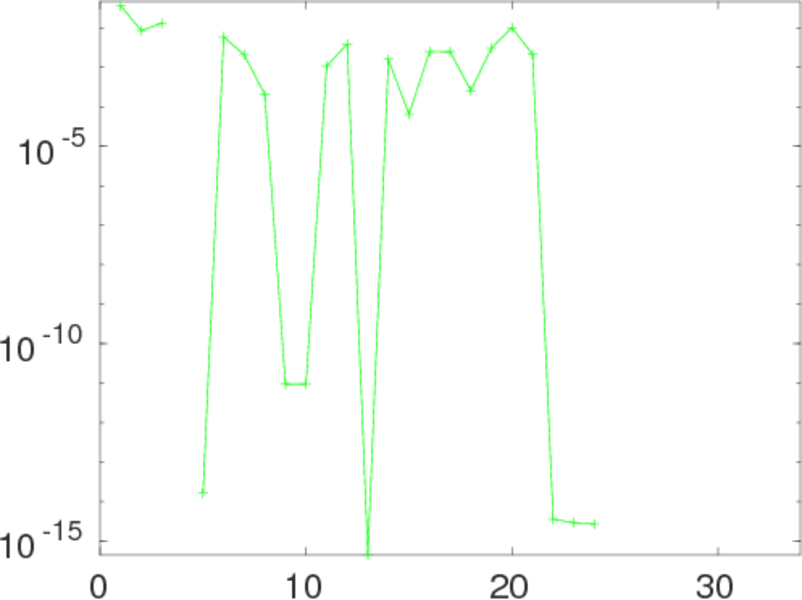
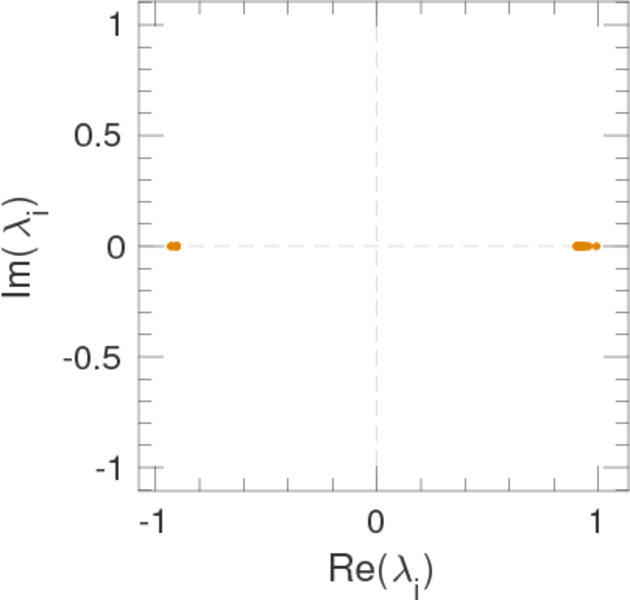
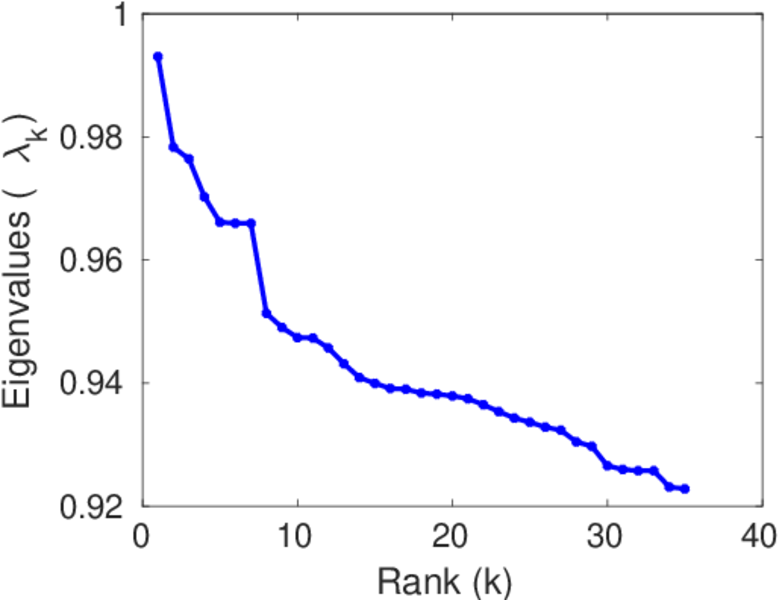
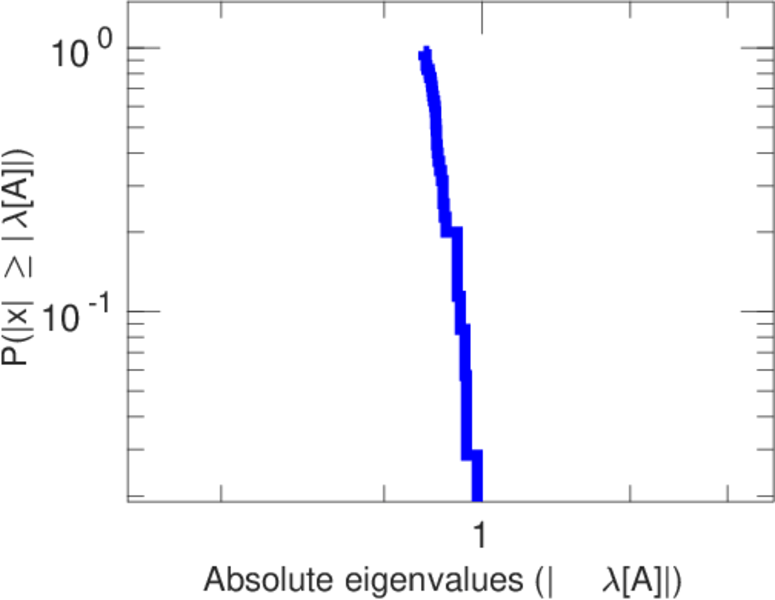
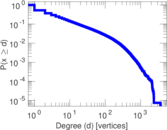
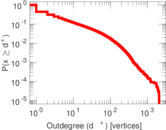
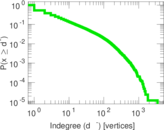
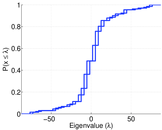
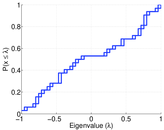
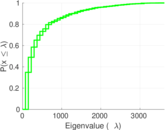
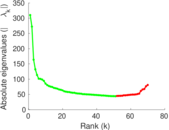
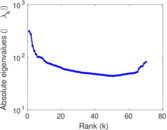
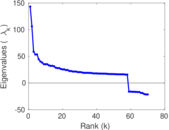
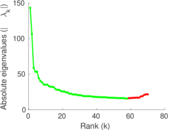
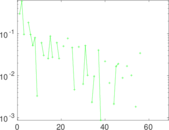
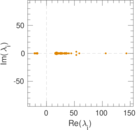
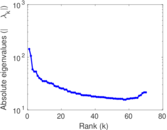
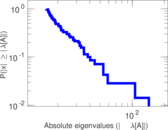
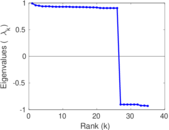
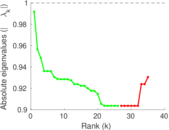
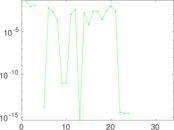
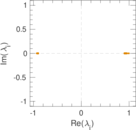
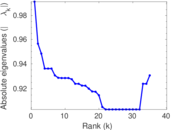
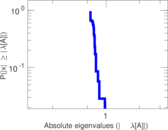
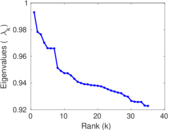
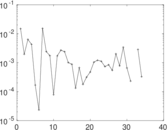
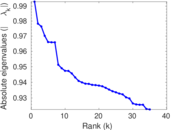
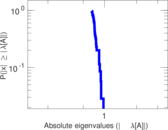
Plots


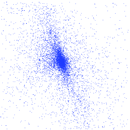


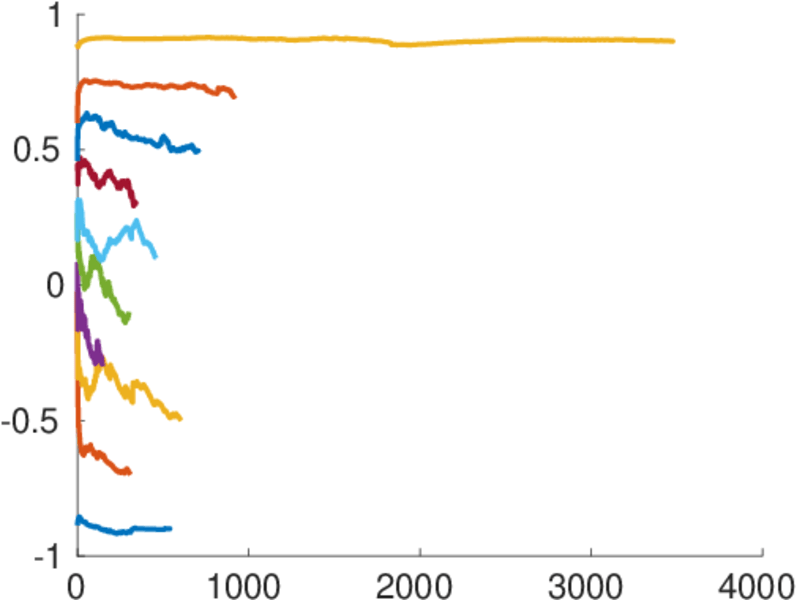
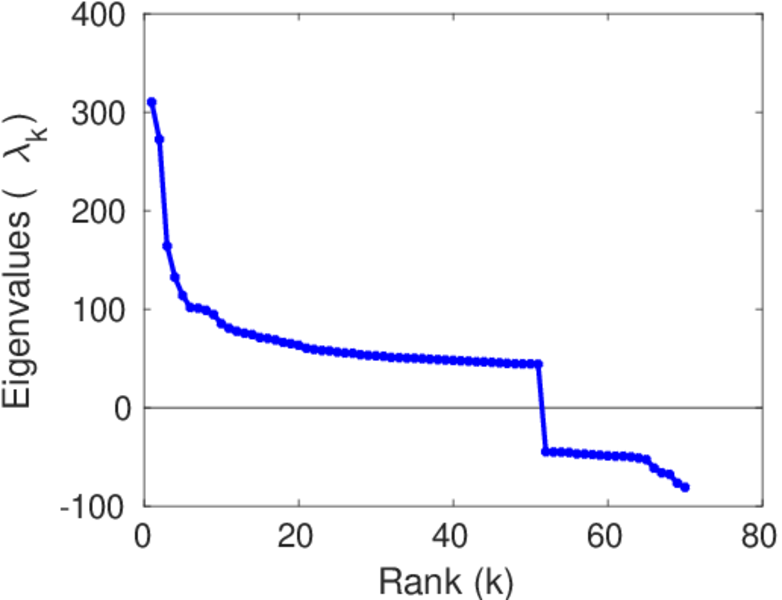
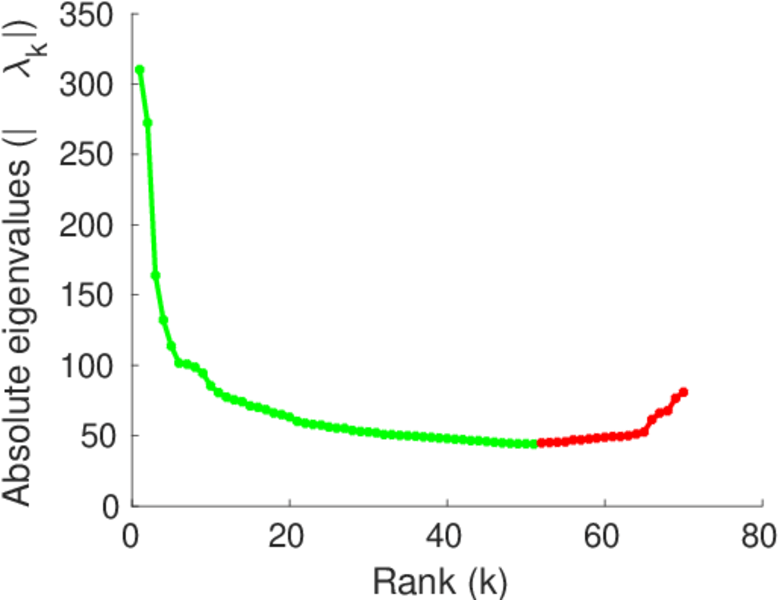
Matrix decompositions plots


Downloads
References
|
[1]
|
Jérôme Kunegis.
KONECT – The Koblenz Network Collection.
In Proc. Int. Conf. on World Wide Web Companion, pages
1343–1350, 2013.
[ http ]
|
|
[2]
|
Paolo Massa and Paolo Avesani.
Controversial users demand local trust metrics: an experimental study
on epinions.com community.
In Proc. American Association for Artif. Intell. Conf., pages
121–126, 2005.
|
 KONECT ‣ Networks ‣
Buy Me a Coffee
KONECT ‣ Networks ‣
Buy Me a Coffee