Sexual escorts
This is the bipartite network of sex buyers and their escorts. Nodes are buyers
and escorts. An edge denotes sexual intercourse between a male sex-buyer and a
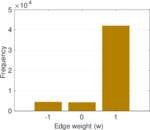
female escort. Edges are weighted with the rating of the escort given by the
buyer. Three ratings are possible: bad (−1), neutral (0), good (+1).
Metadata
Statistics
| Size | n = | 16,730
|
| Left size | n1 = | 10,106
|
| Right size | n2 = | 6,624
|
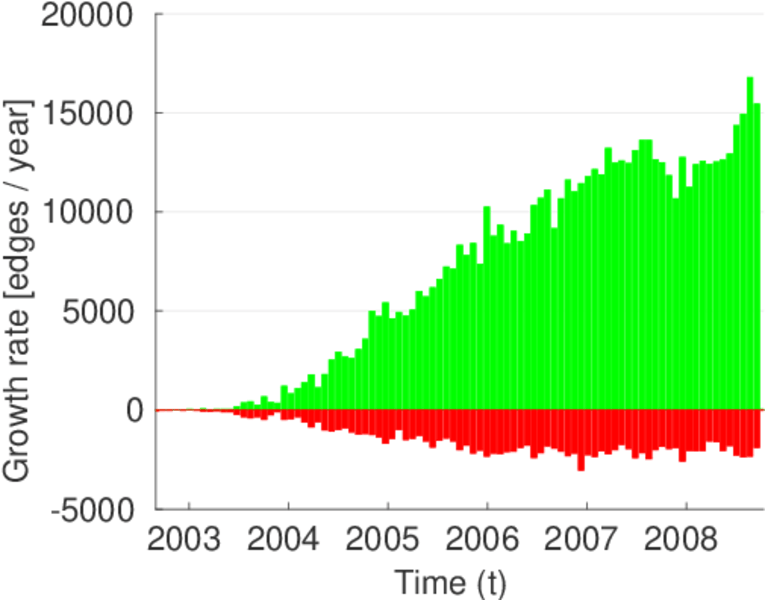
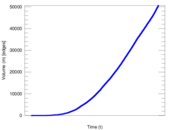
| Volume | m = | 50,632
|
| Unique edge count | m̿ = | 39,044
|
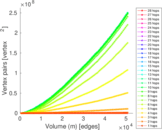
| Wedge count | s = | 1,055,915
|
| Claw count | z = | 37,782,314
|
| Cross count | x = | 1,791,899,404
|
| Square count | q = | 231,440
|
| 4-Tour count | T4 = | 6,155,912
|
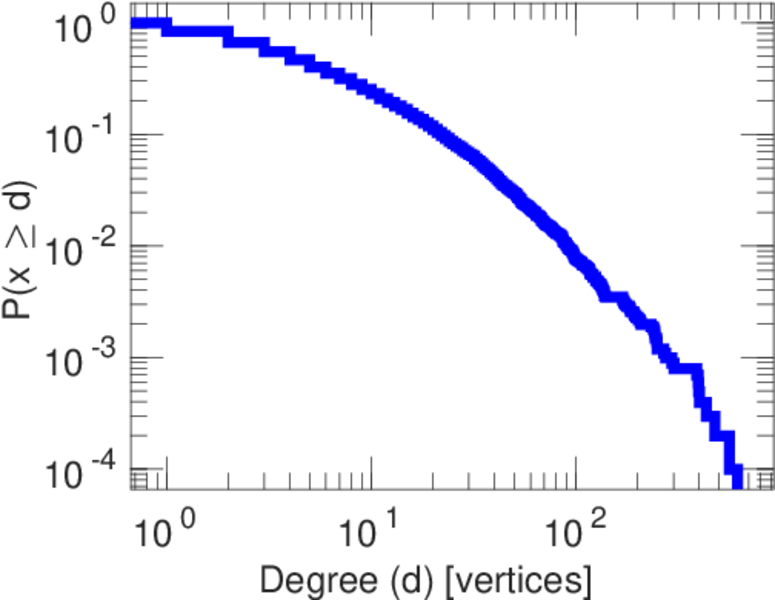
| Maximum degree | dmax = | 615
|
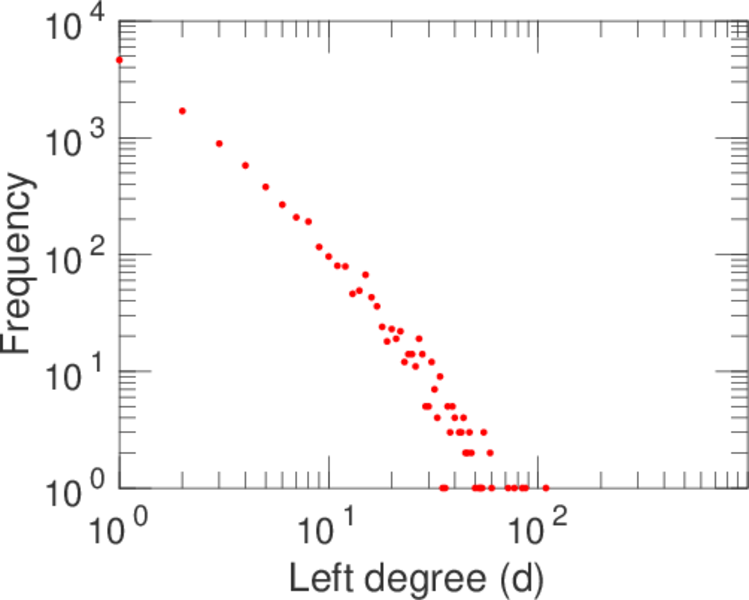
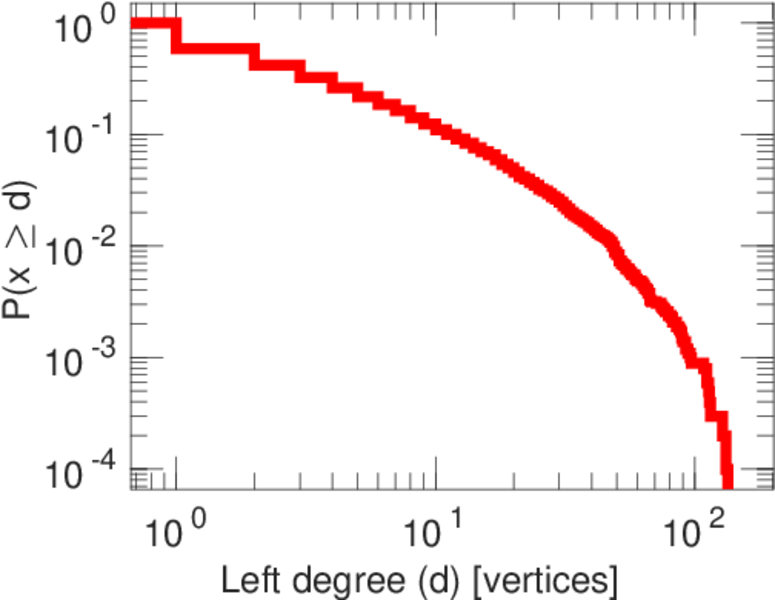
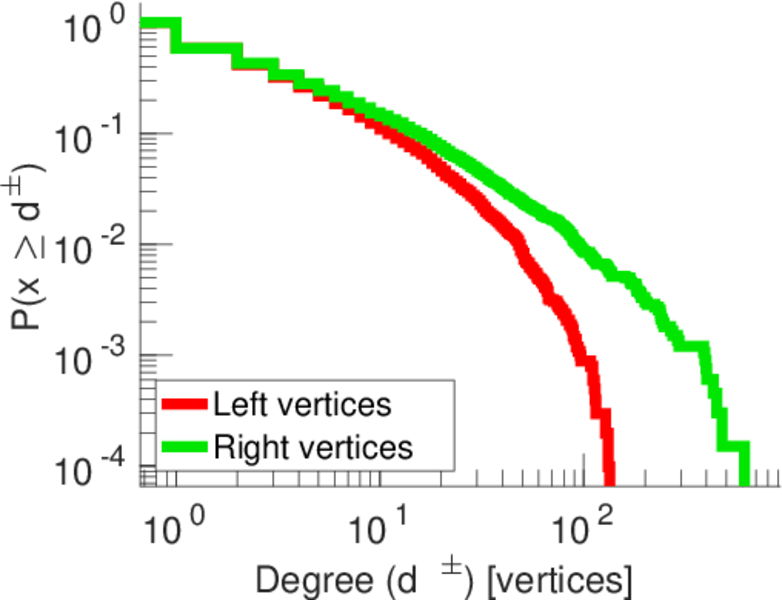
| Maximum left degree | d1max = | 134
|
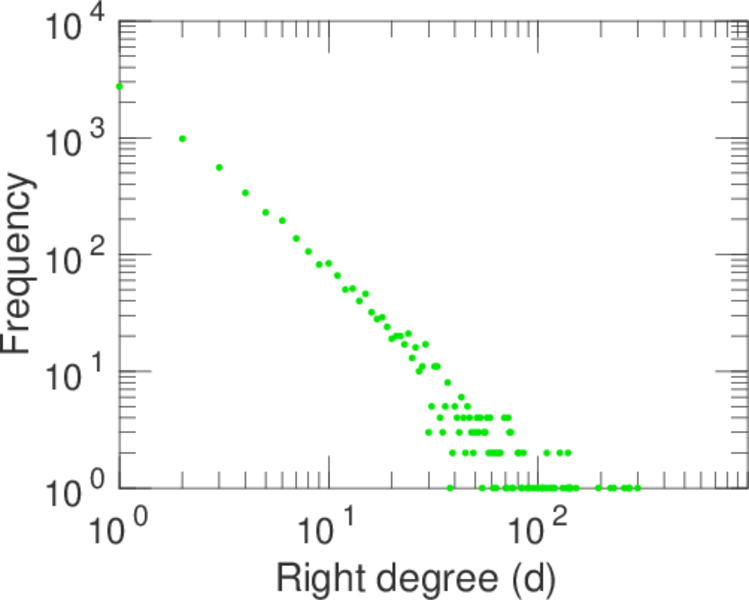
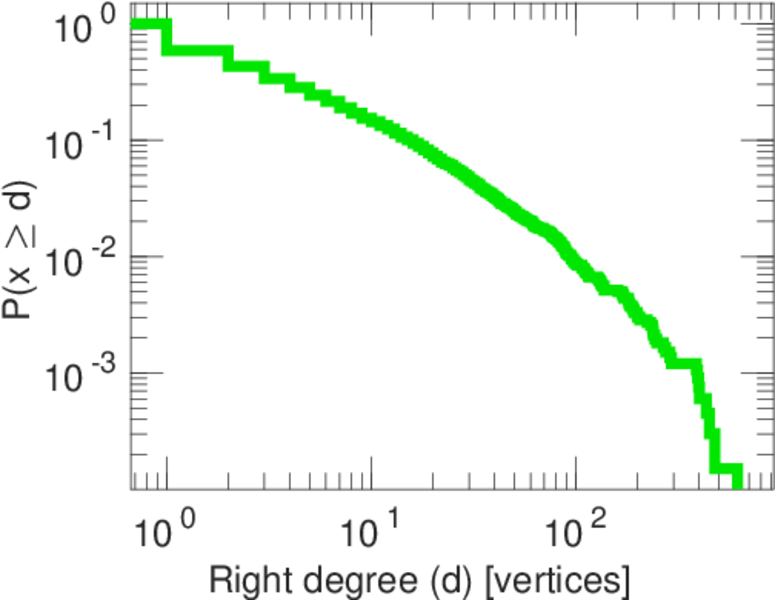
| Maximum right degree | d2max = | 615
|
| Average degree | d = | 6.052 84
|
| Average left degree | d1 = | 5.010 09
|
| Average right degree | d2 = | 7.643 72
|
| Fill | p = | 0.000 583 250
|
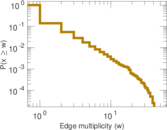
| Average edge multiplicity | m̃ = | 1.296 79
|
| Size of LCC | N = | 15,809
|
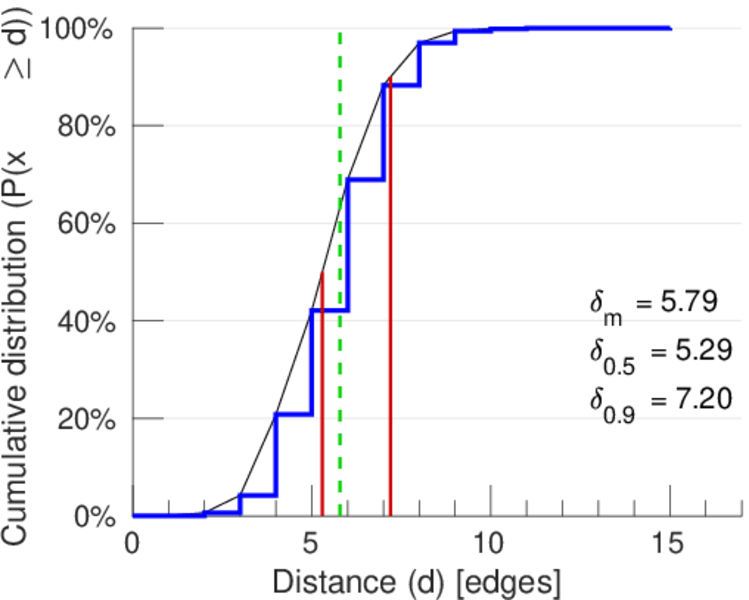
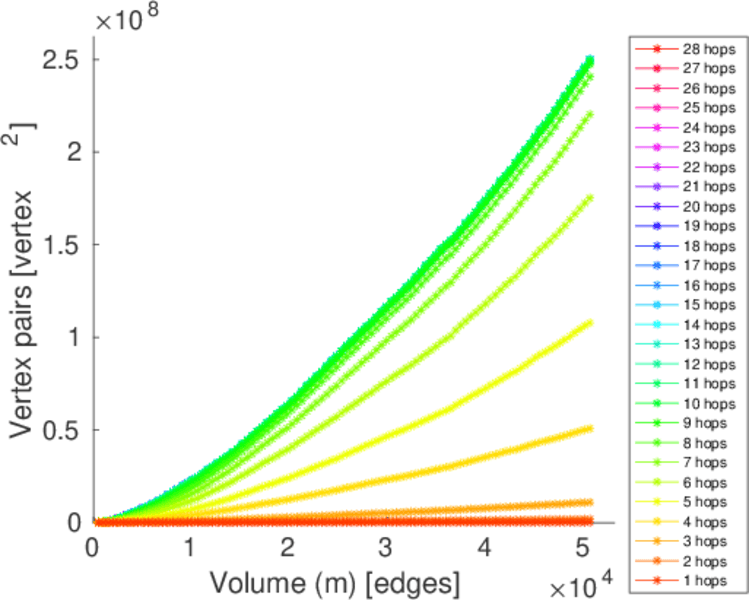
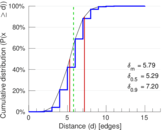
| Diameter | δ = | 17
|
| 50-Percentile effective diameter | δ0.5 = | 5.294 13
|
| 90-Percentile effective diameter | δ0.9 = | 7.201 57
|
| Median distance | δM = | 6
|
| Mean distance | δm = | 5.790 05
|
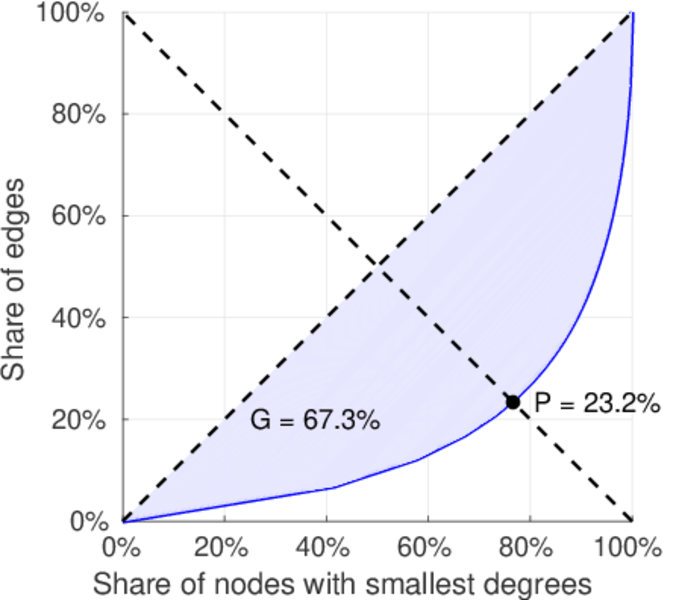
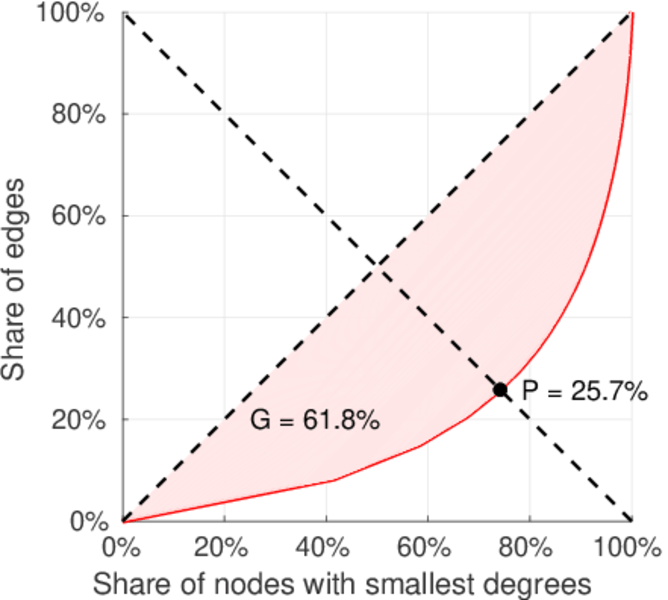
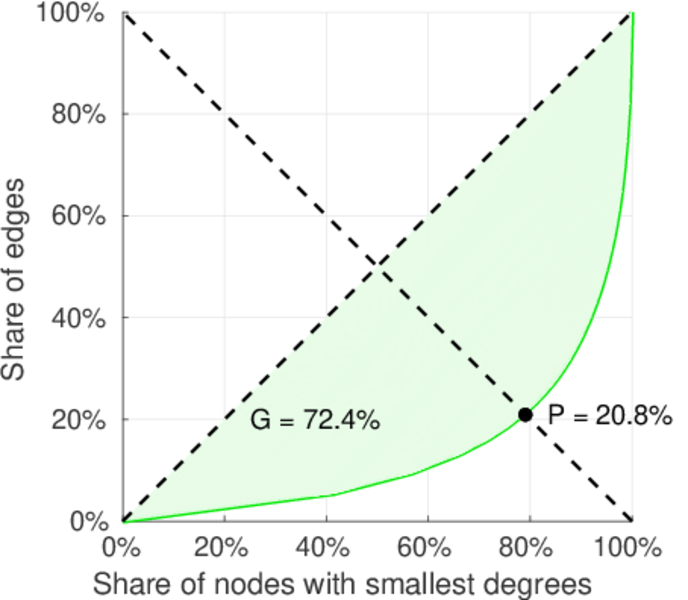
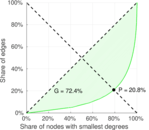
| Gini coefficient | G = | 0.595 016
|
| Balanced inequality ratio | P = | 0.274 370
|
| Left balanced inequality ratio | P1 = | 0.275 996
|
| Right balanced inequality ratio | P2 = | 0.234 428
|
| Relative edge distribution entropy | Her = | 0.910 952
|
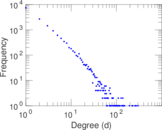
| Power law exponent | γ = | 2.179 36
|
| Tail power law exponent | γt = | 2.871 00
|
| Tail power law exponent with p | γ3 = | 2.871 00
|
| p-value | p = | 0.336 000
|
| Left tail power law exponent with p | γ3,1 = | 4.401 00
|
| Left p-value | p1 = | 0.403 000
|
| Right tail power law exponent with p | γ3,2 = | 2.481 00
|
| Right p-value | p2 = | 0.002 000 00
|
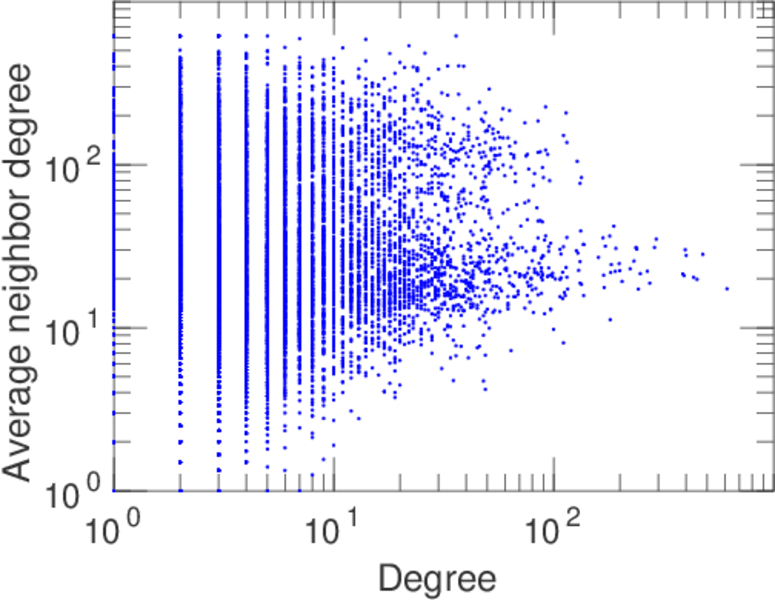
| Degree assortativity | ρ = | −0.043 192 1
|
| Degree assortativity p-value | pρ = | 1.362 27 × 10−17
|
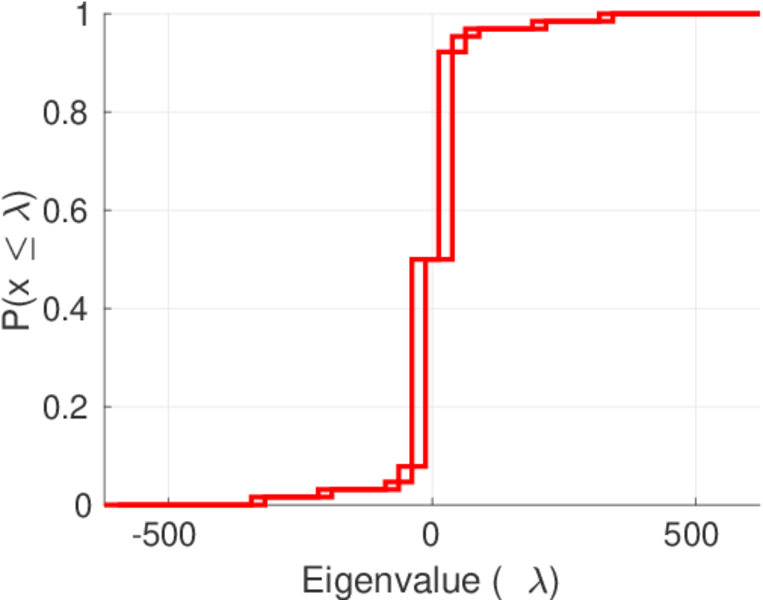
| Spectral norm | α = | 622.383
|
| Algebraic connectivity | a = | 0.000 151 319
|
| Spectral separation | |λ1[A] / λ2[A]| = | 1.192 47
|
| Negativity | ζ = | 0.676 596
|
| Algebraic conflict | ξ = | 0.012 682 0
|
| Spectral signed frustration | φ = | 0.000 650 304
|
| Controllability | C = | 6,813
|
| Relative controllability | Cr = | 0.407 233
|
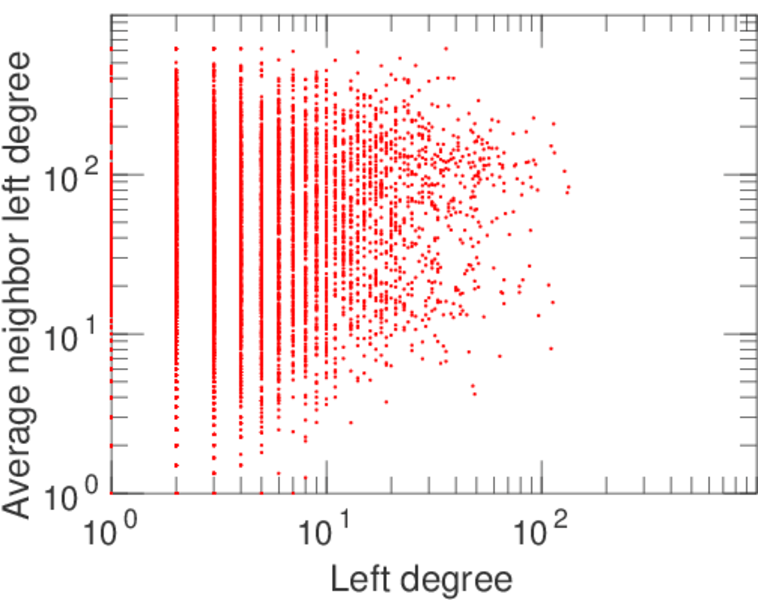
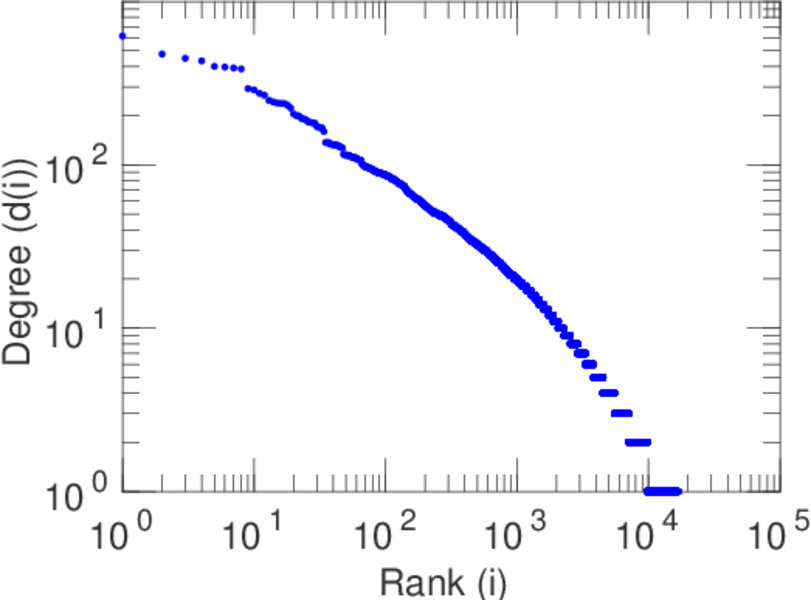
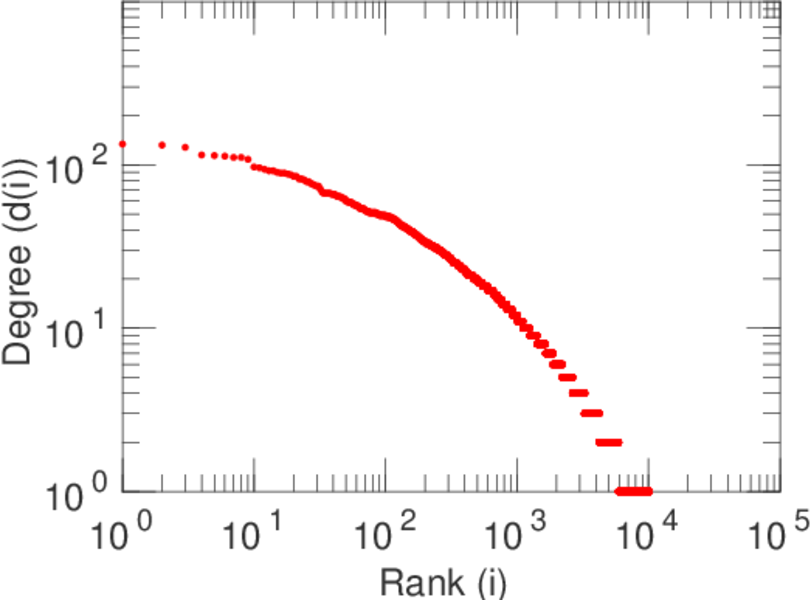
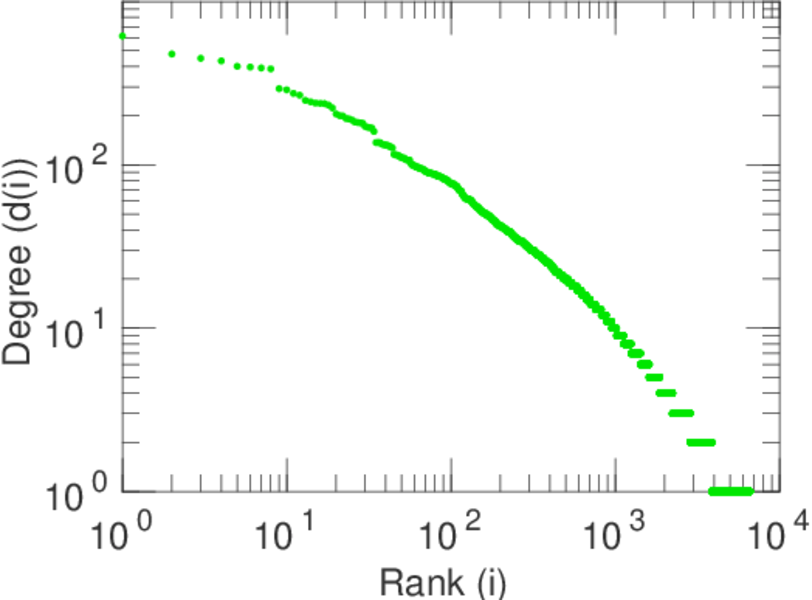
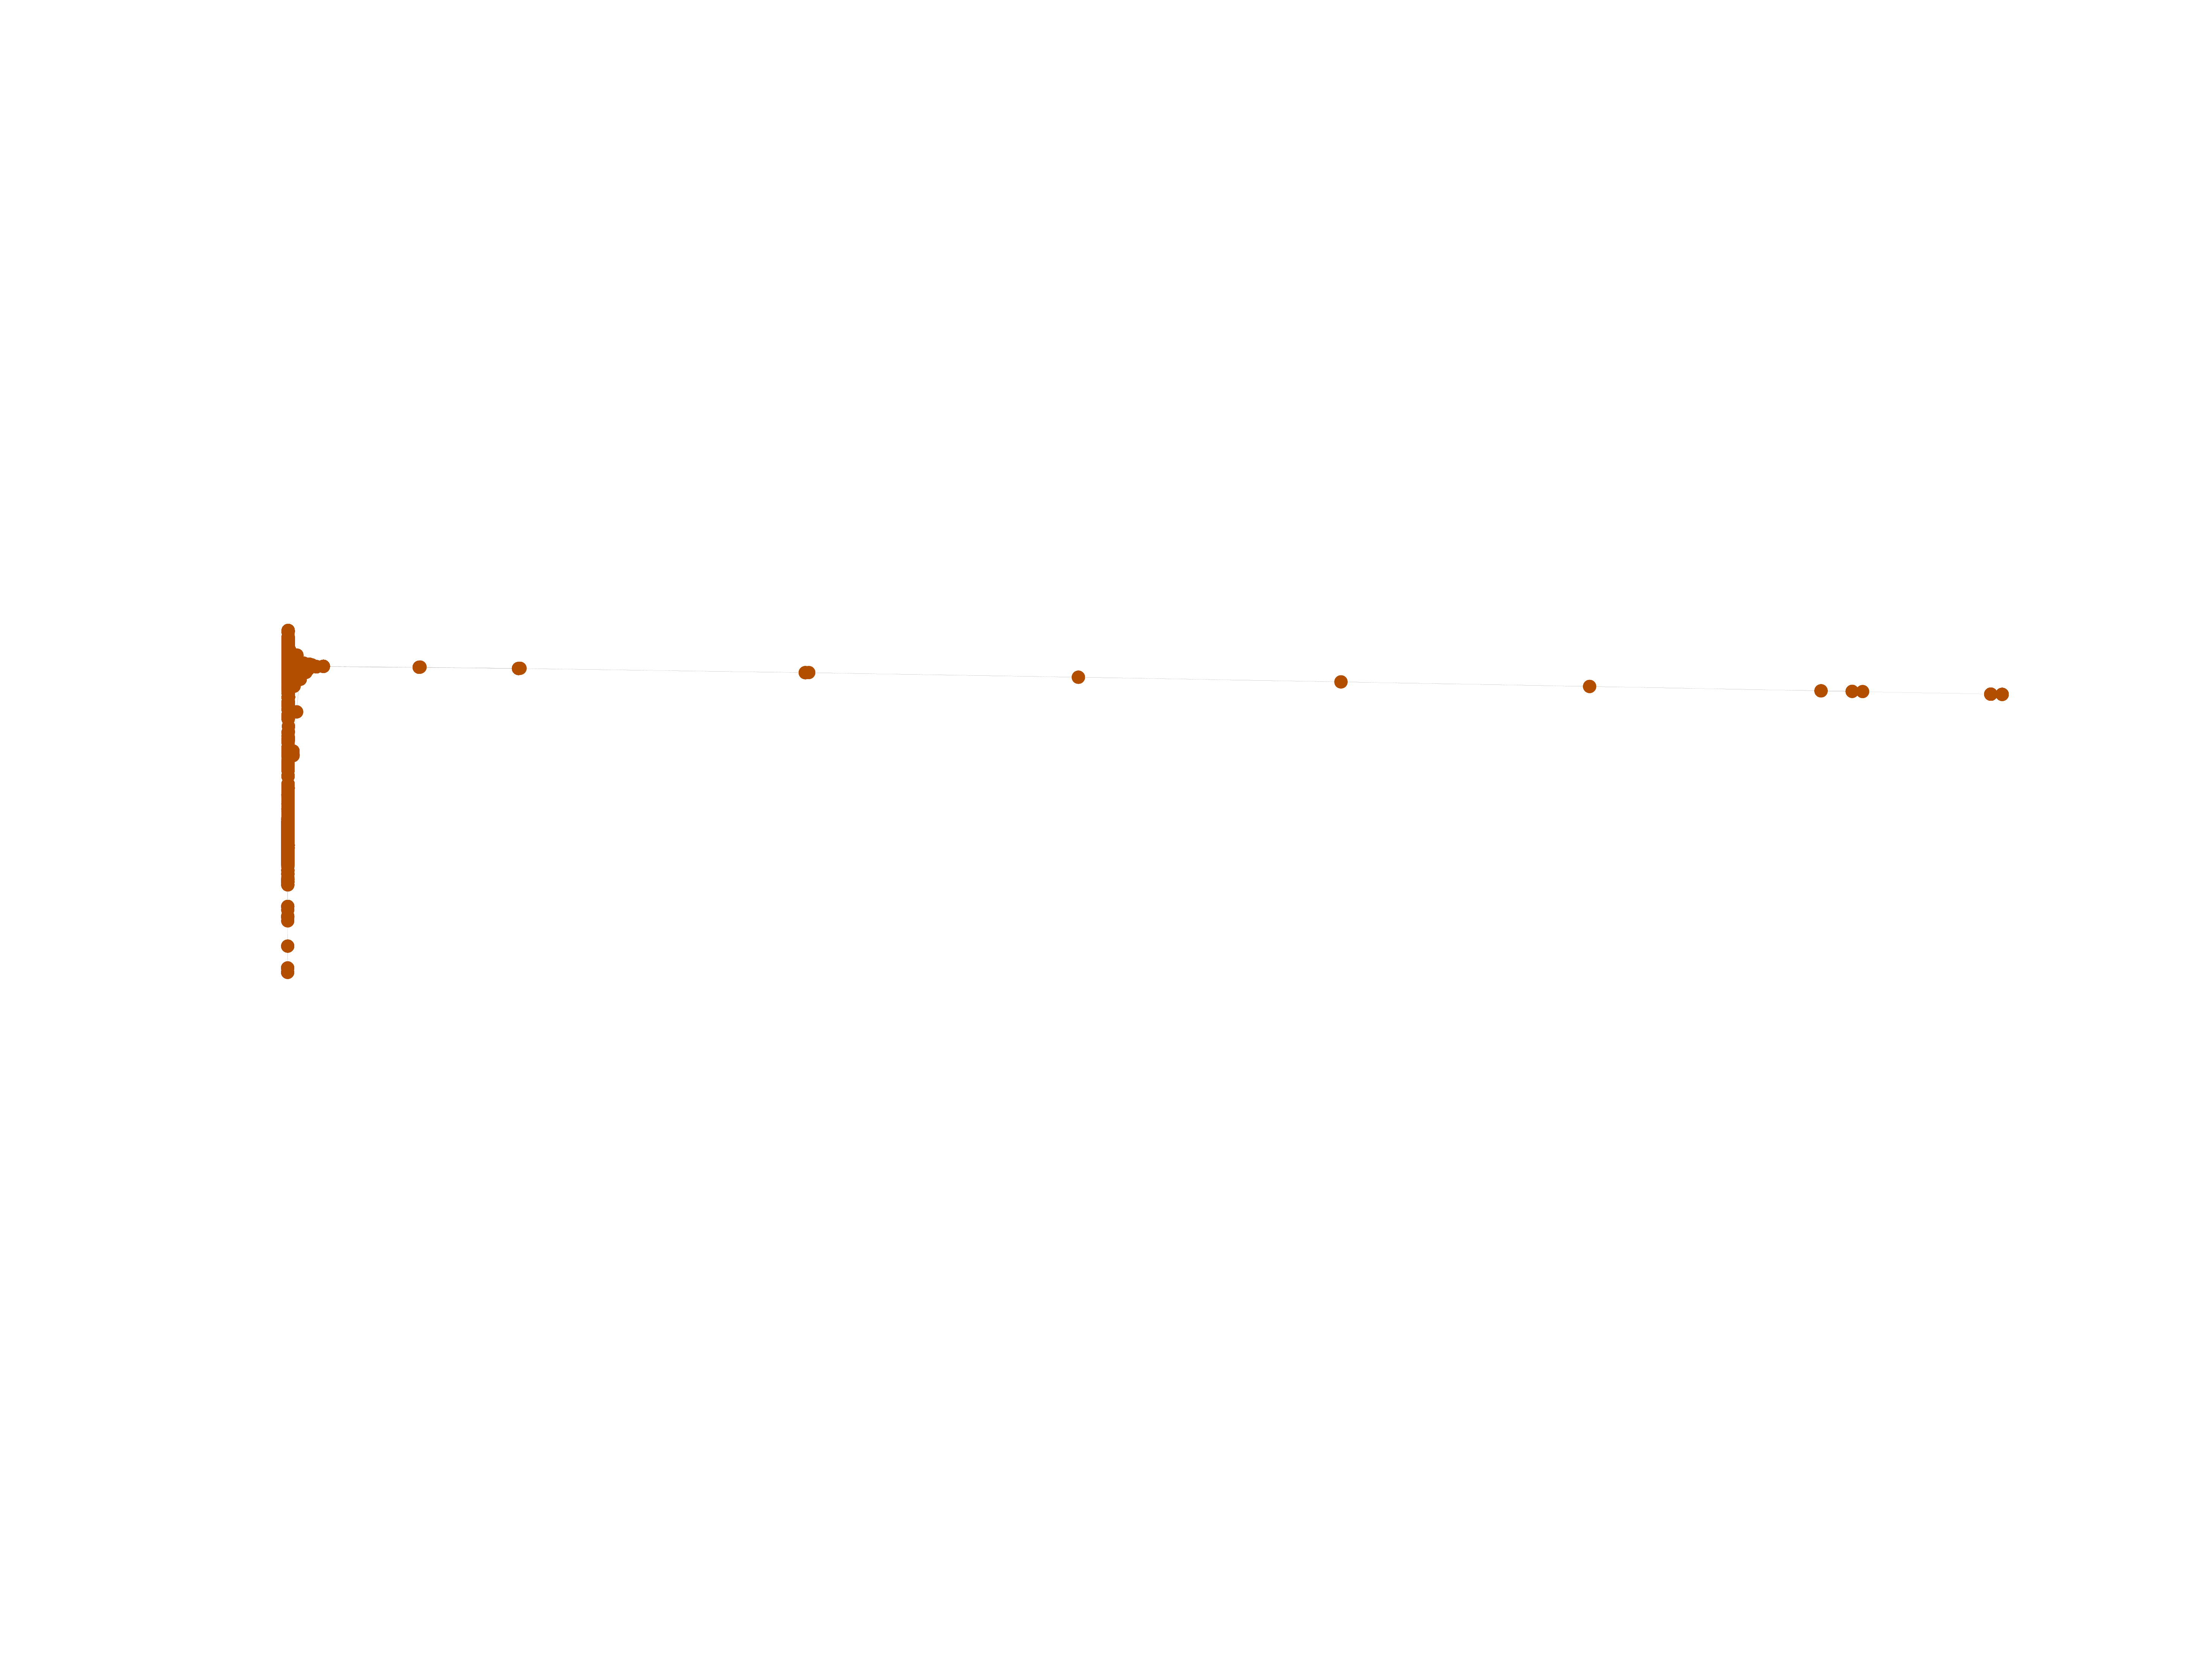
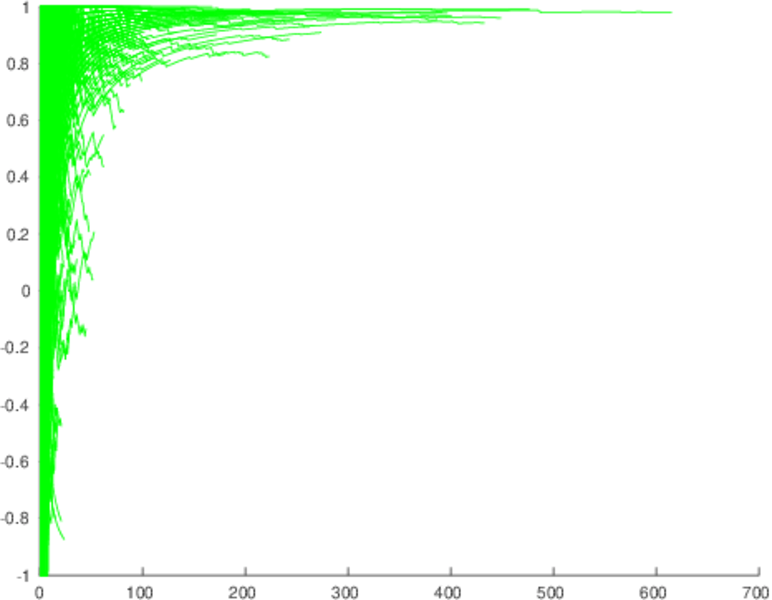
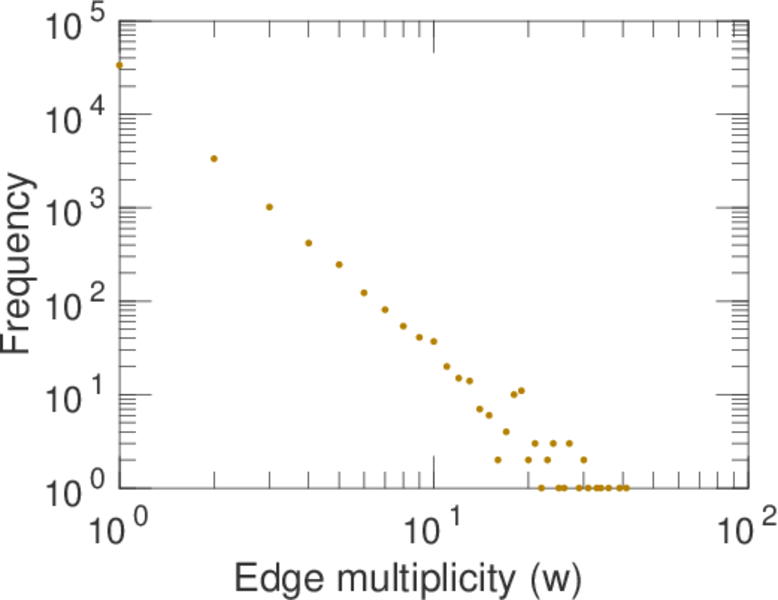
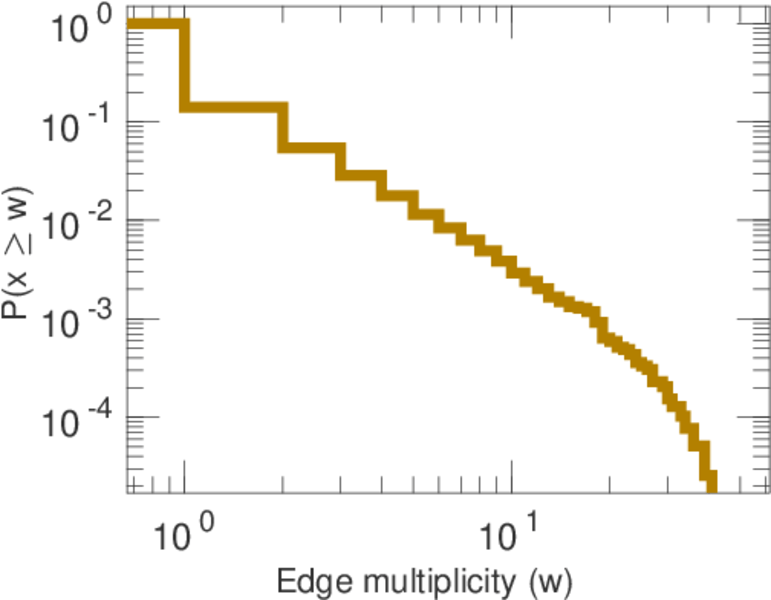
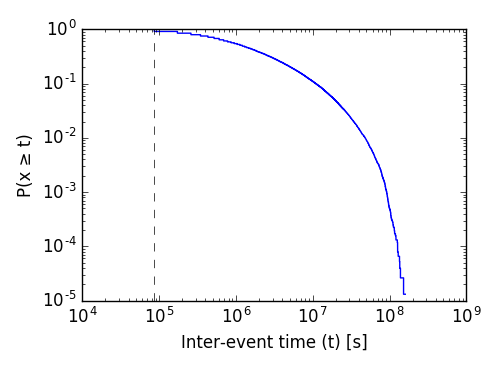
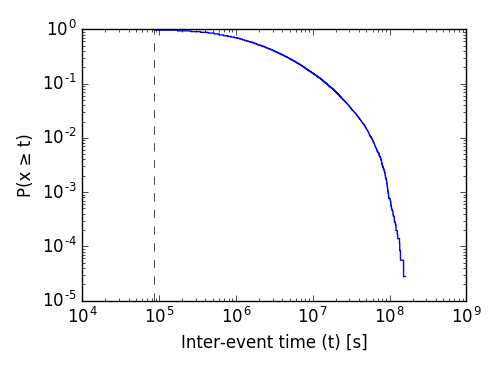
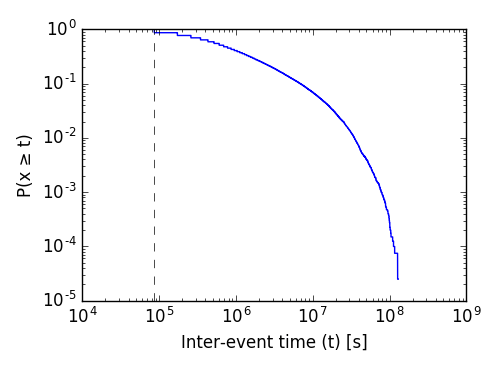
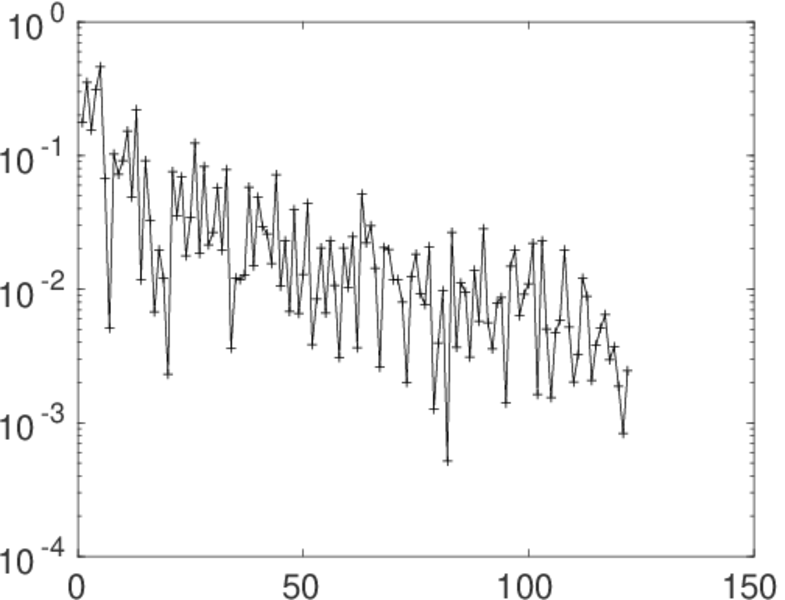
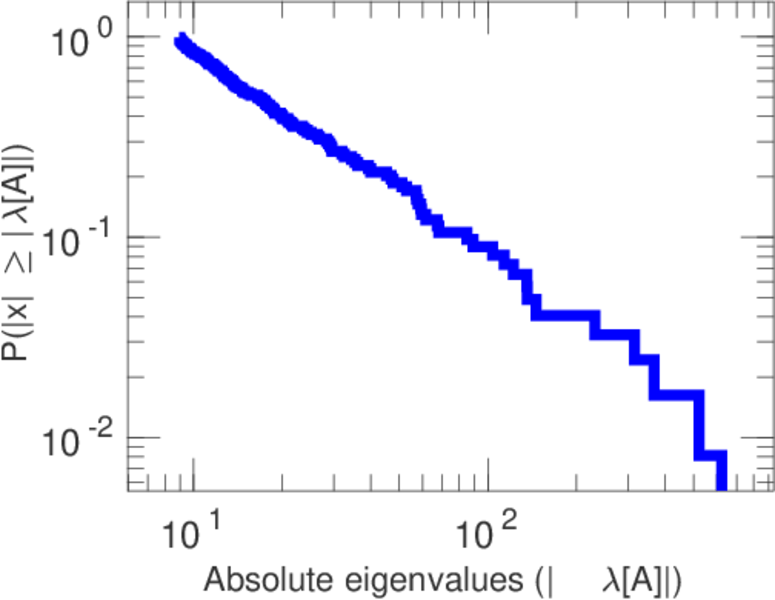
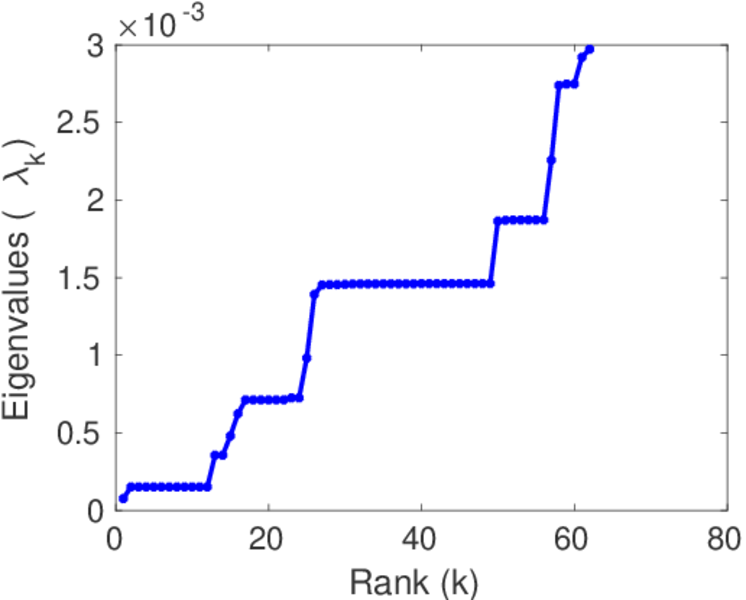
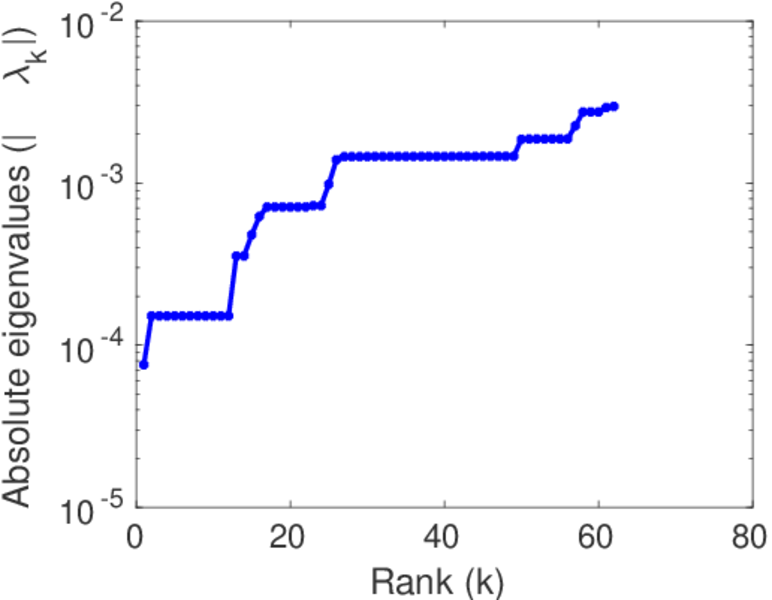
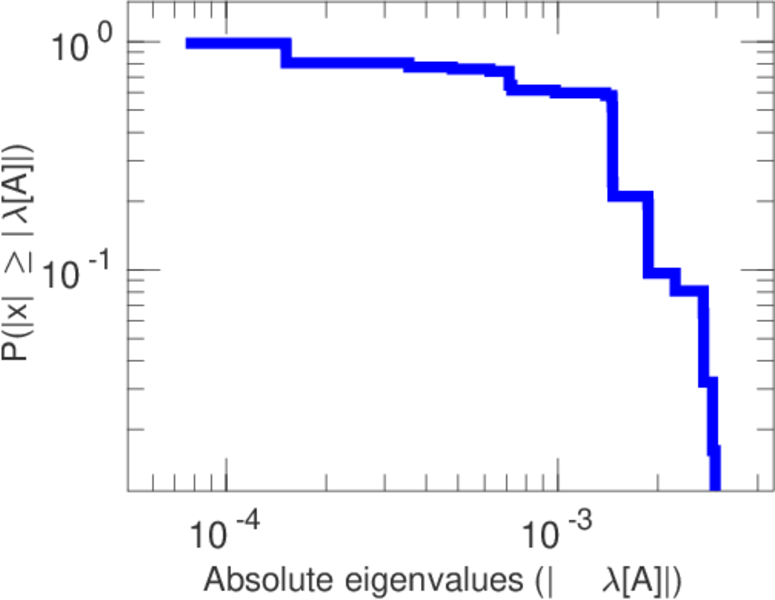
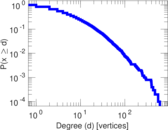
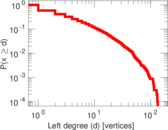
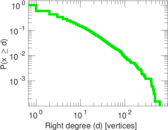
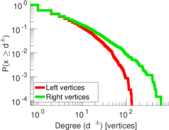
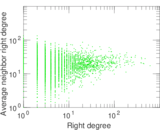
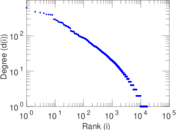
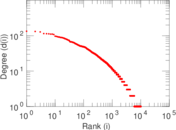
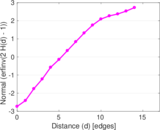
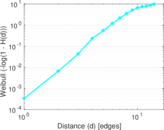
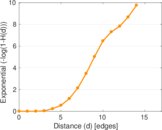
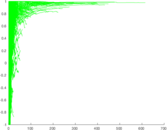
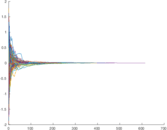
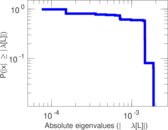
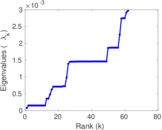
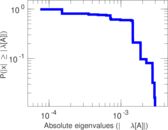
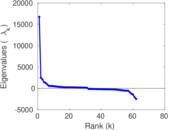
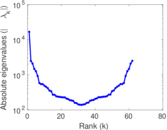
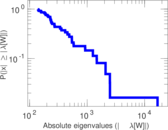
Plots


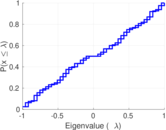
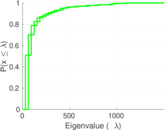
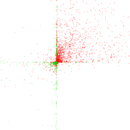


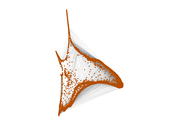
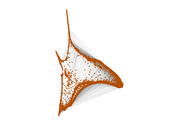


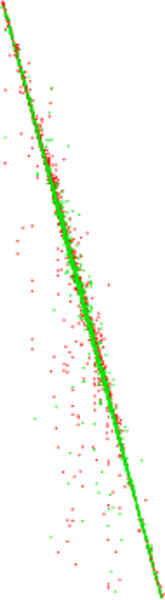
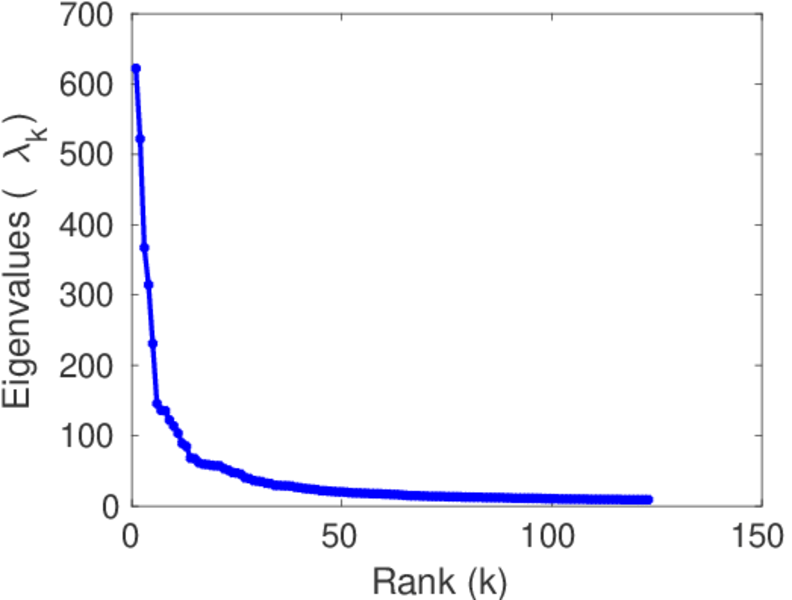
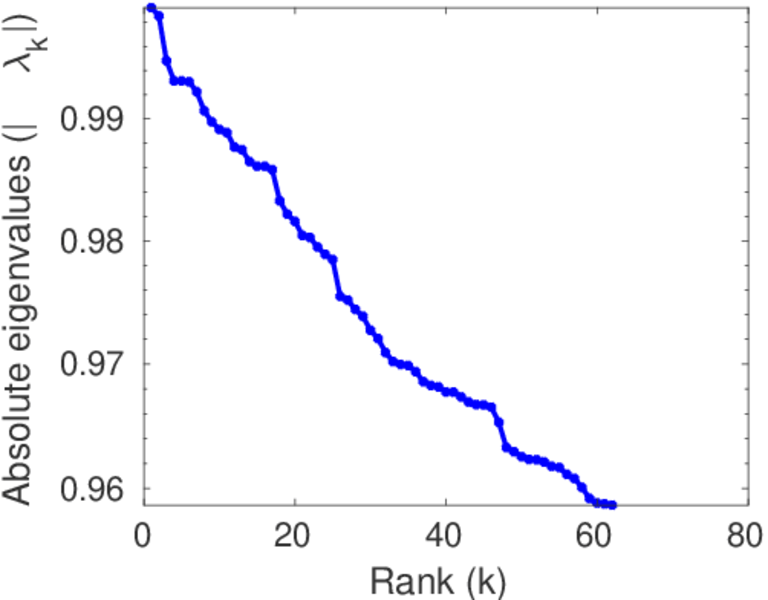
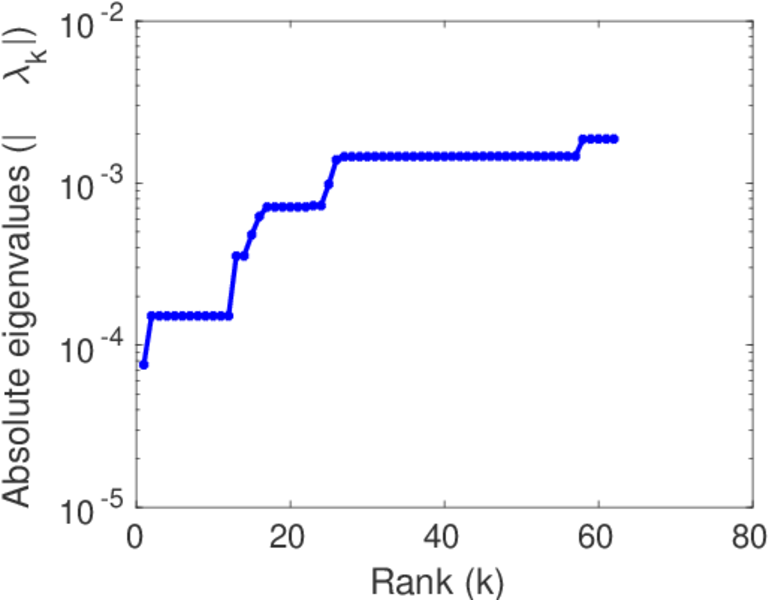
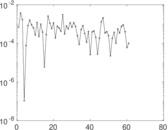
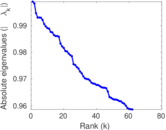
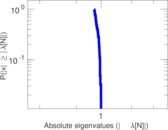
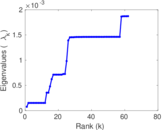
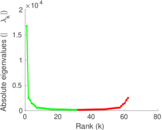
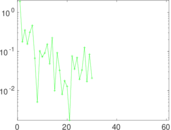
Matrix decompositions plots


Downloads
References
|
[1]
|
Jérôme Kunegis.
KONECT – The Koblenz Network Collection.
In Proc. Int. Conf. on World Wide Web Companion, pages
1343–1350, 2013.
[ http ]
|
|
[2]
|
Luis E. C. Rocha, Fredrik Liljeros, and Petter Holme.
Information dynamics shape the sexual networks of Internet-mediated
prostitution.
Proc. Natl. Acad. Sci. U.S.A., 107(13):5706–5711, 2010.
|
 KONECT ‣ Networks ‣
Buy Me a Coffee
KONECT ‣ Networks ‣
Buy Me a Coffee