Filmtipset ratings
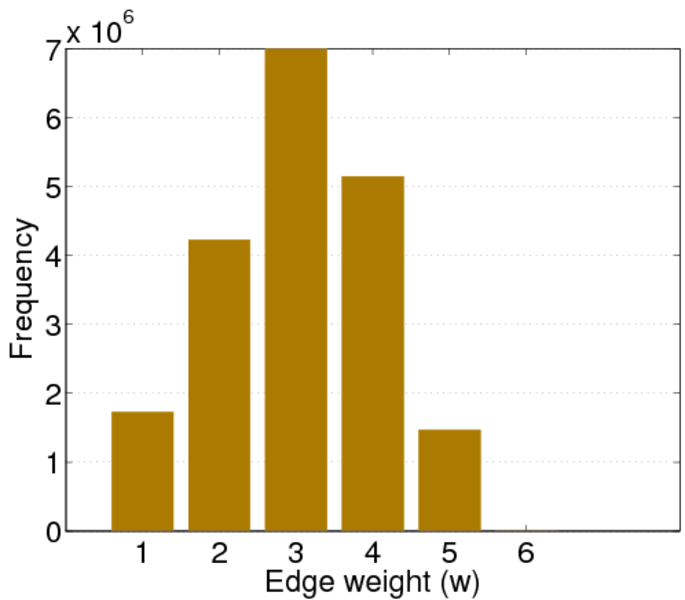
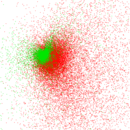
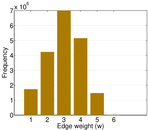
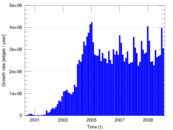
This is the bipartite rating graph of Filmtipset.se, a Swedish movie rating
website. Nodes of the network are users and movie, and edges denote individual
ratings by a user of a movie. The weight of an edge is the rating on a scale
from 1 (bad movie) to 5 (good movie).
Metadata
Statistics
| Size | n = | 144,671
|
| Left size | n1 = | 80,482
|
| Right size | n2 = | 64,189
|
| Volume | m = | 19,554,219
|
| Unique edge count | m̿ = | 19,553,591
|
| Wedge count | s = | 113,150,077,280
|
| Claw count | z = | 823,402,527,757,975
|
| Cross count | x = | 7,047,301,388,153,398,272
|
| Square count | q = | 8,728,909,858,170
|
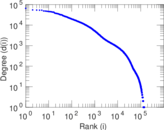
| Maximum degree | dmax = | 65,245
|
| Maximum left degree | d1max = | 13,651
|
| Maximum right degree | d2max = | 65,245
|
| Average degree | d = | 270.327
|
| Average left degree | d1 = | 242.964
|
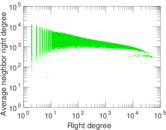
| Average right degree | d2 = | 304.635
|
| Fill | p = | 0.003 785 01
|
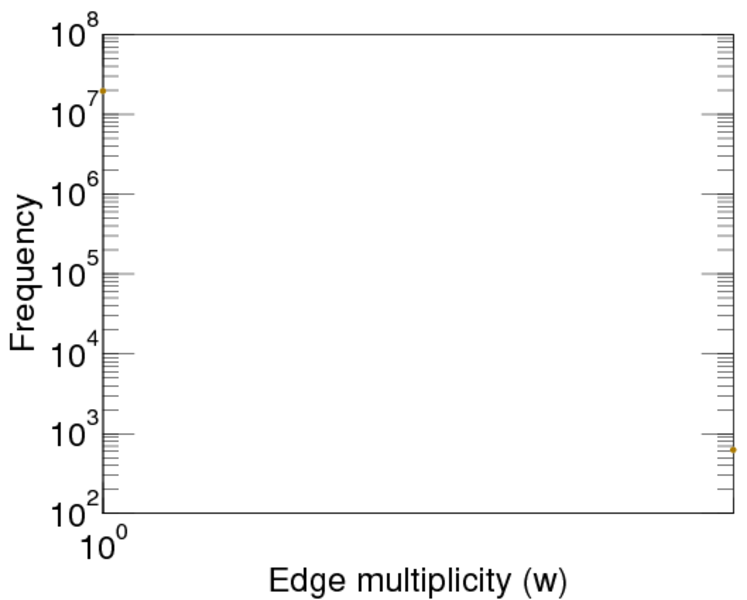
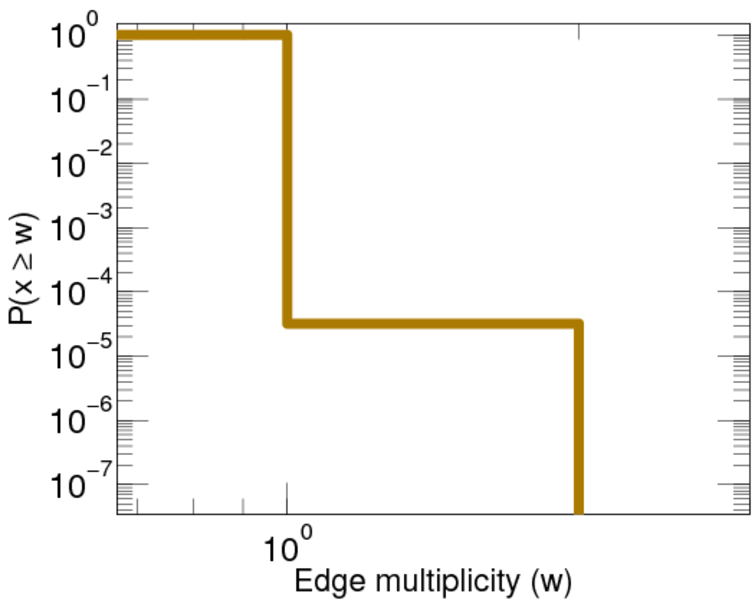
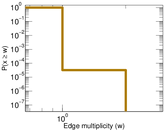
| Average edge multiplicity | m̃ = | 1.000 03
|
| Size of LCC | N = | 144,653
|
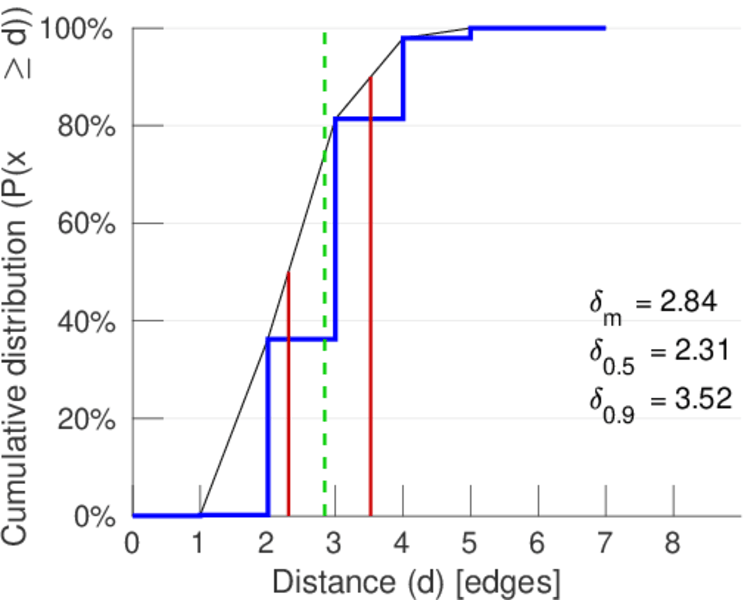
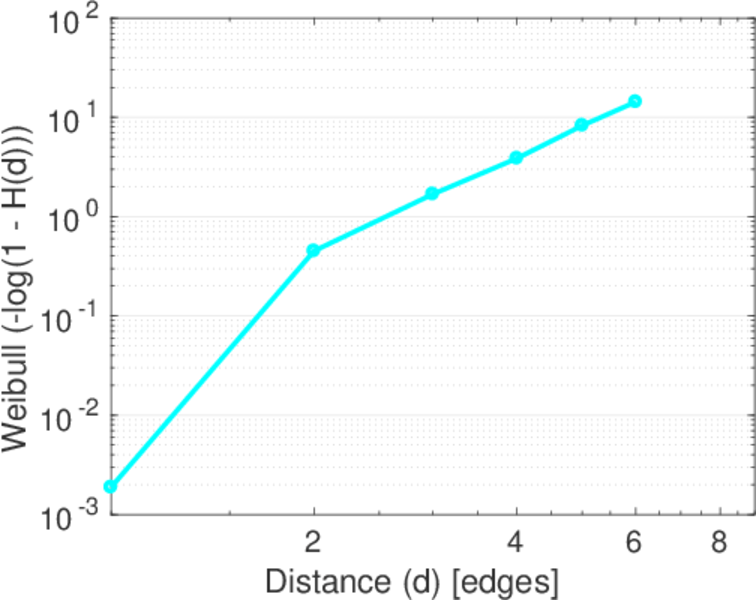
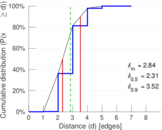
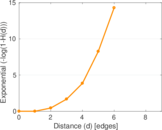
| Diameter | δ = | 7
|
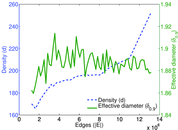
| 50-Percentile effective diameter | δ0.5 = | 2.305 10
|
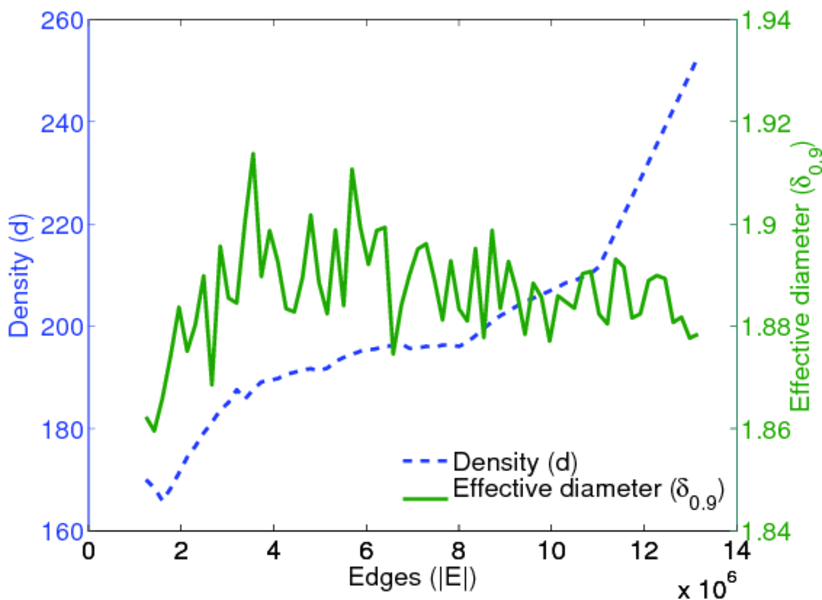
| 90-Percentile effective diameter | δ0.9 = | 3.522 78
|
| Median distance | δM = | 3
|
| Mean distance | δm = | 2.843 58
|
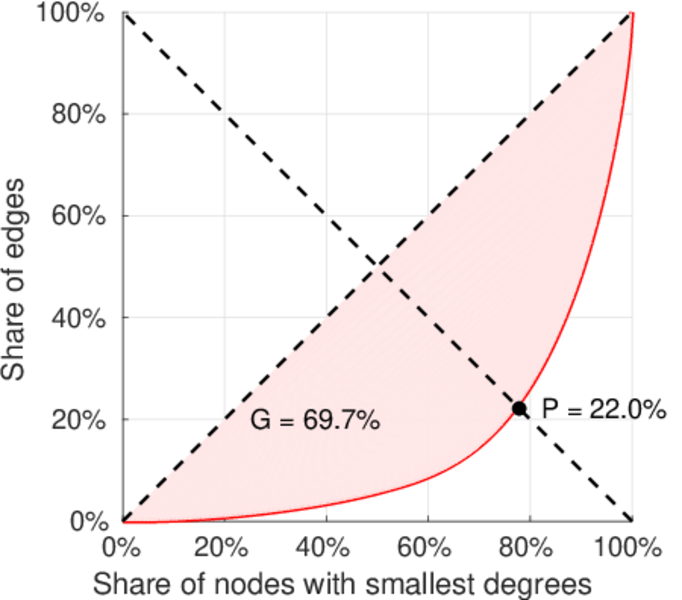
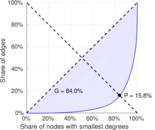
| Gini coefficient | G = | 0.766 918
|
| Balanced inequality ratio | P = | 0.197 423
|
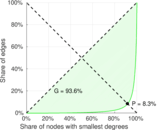
| Left balanced inequality ratio | P1 = | 0.219 938
|
| Right balanced inequality ratio | P2 = | 0.083 228 2
|
| Relative edge distribution entropy | Her = | 0.846 060
|
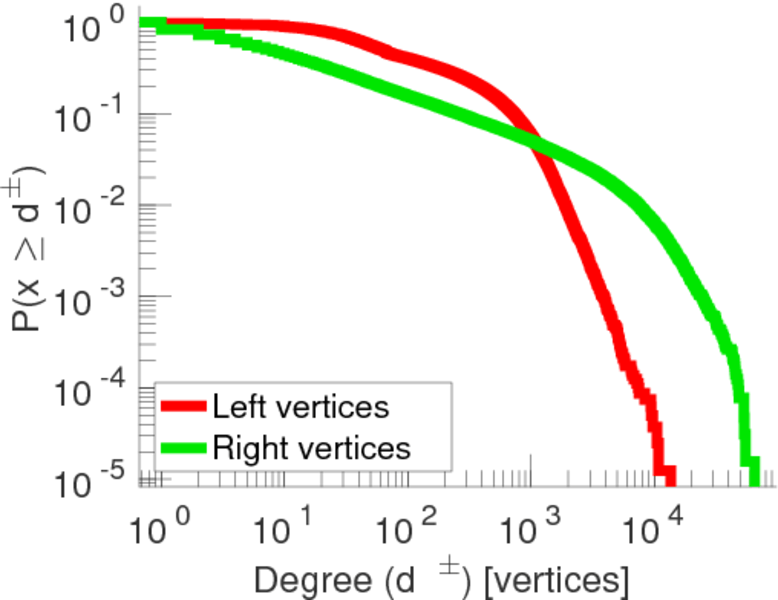
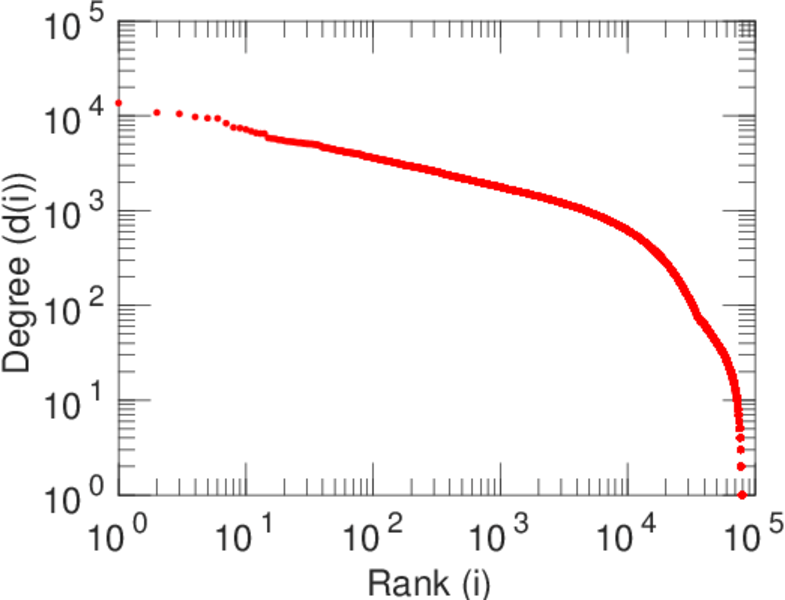
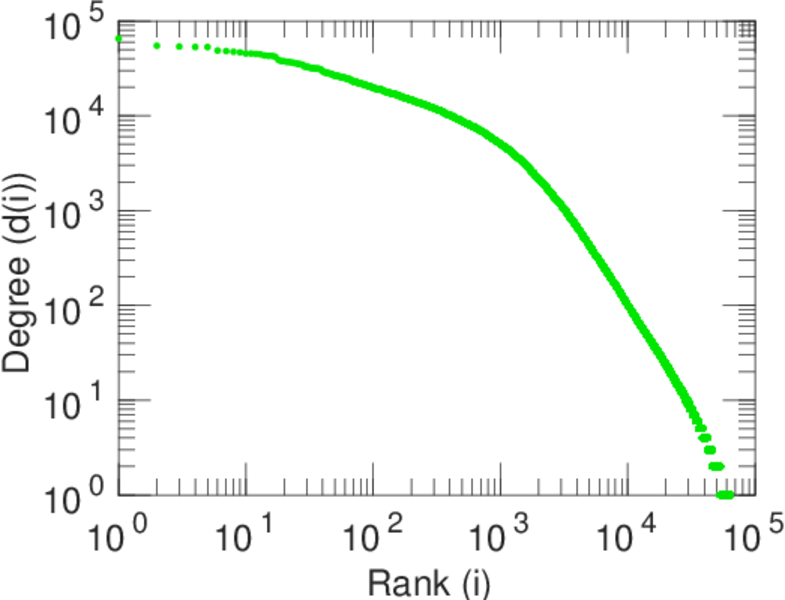
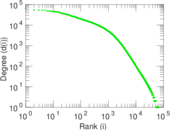
| Power law exponent | γ = | 1.286 53
|
| Tail power law exponent | γt = | 1.531 00
|
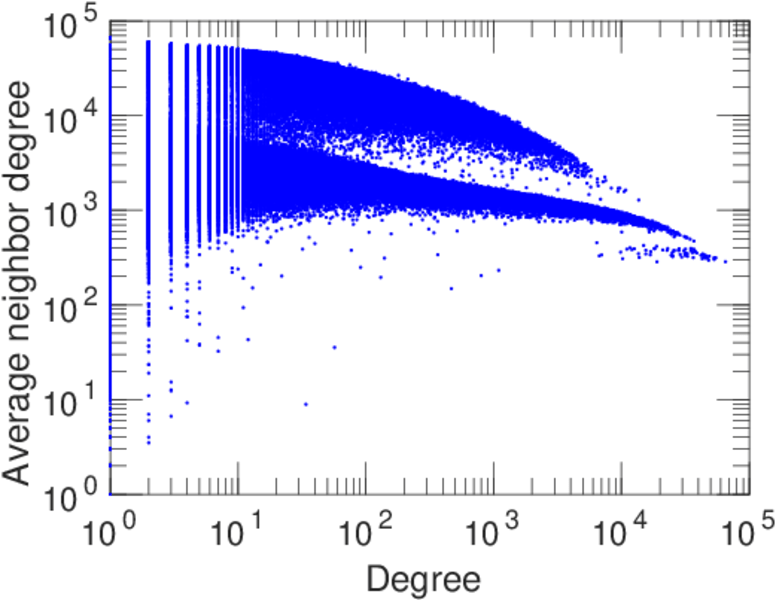
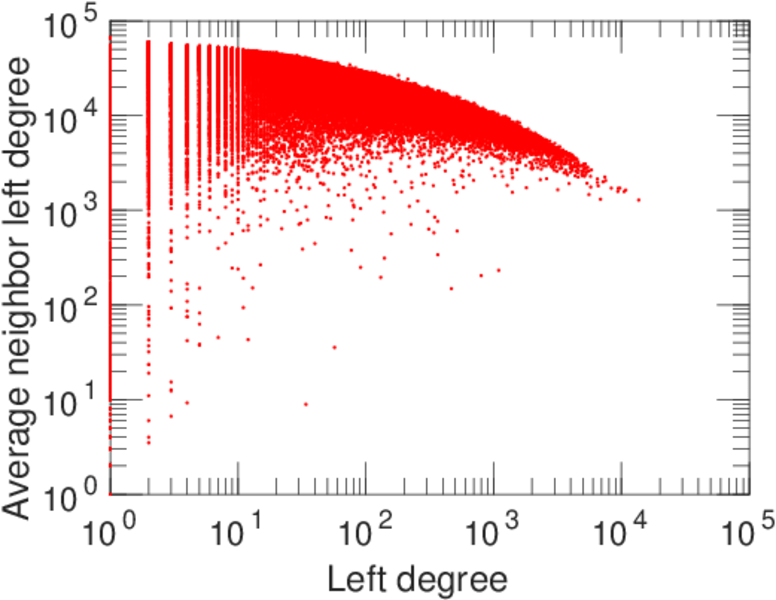
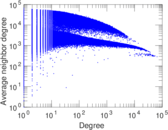
| Degree assortativity | ρ = | −0.303 551
|
| Degree assortativity p-value | pρ = | 0.000 00
|
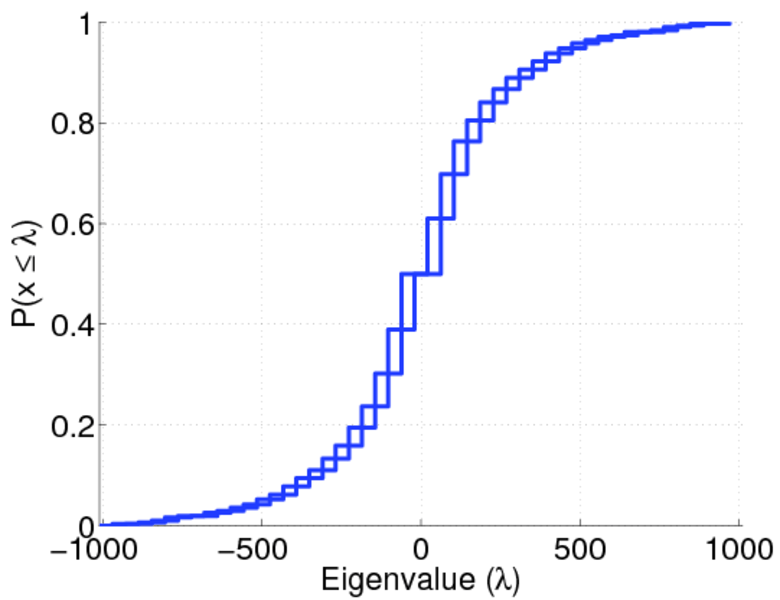
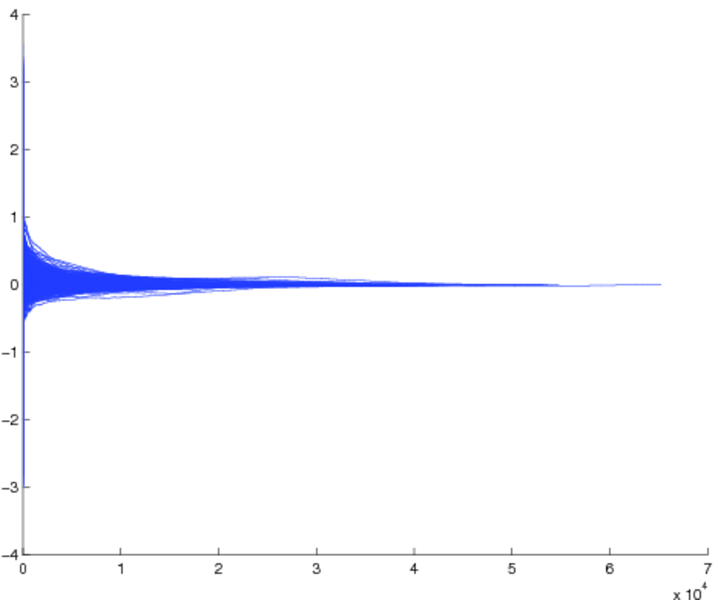
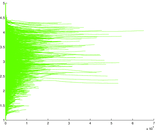
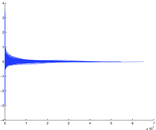
| Spectral norm | α = | 1,011.39
|
| Spectral separation | |λ1[A] / λ2[A]| = | 1.568 98
|
| Negativity | ζ = | 0.487 063
|
| Controllability | C = | 82,631
|
| Relative controllability | Cr = | 0.571 165
|
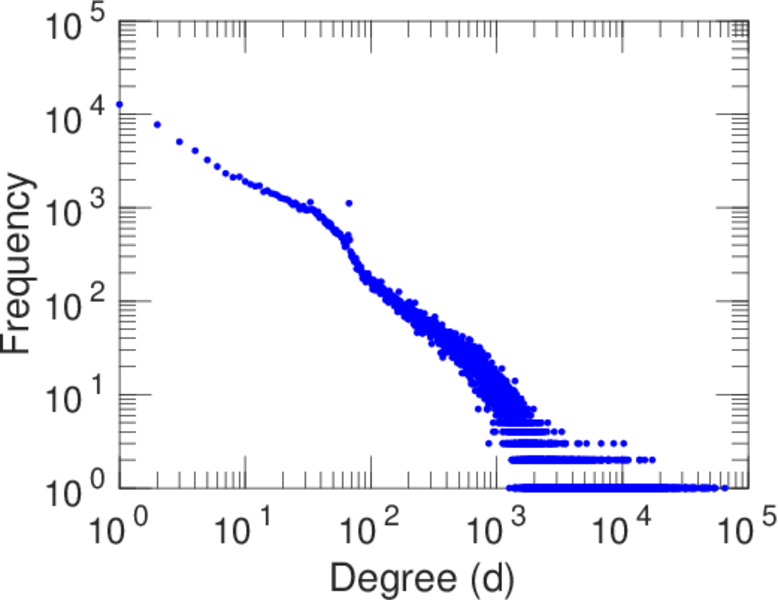
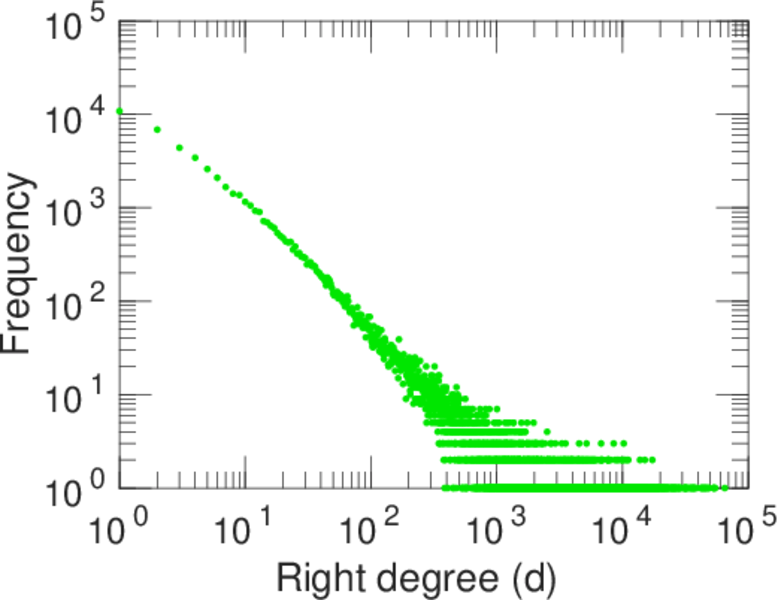
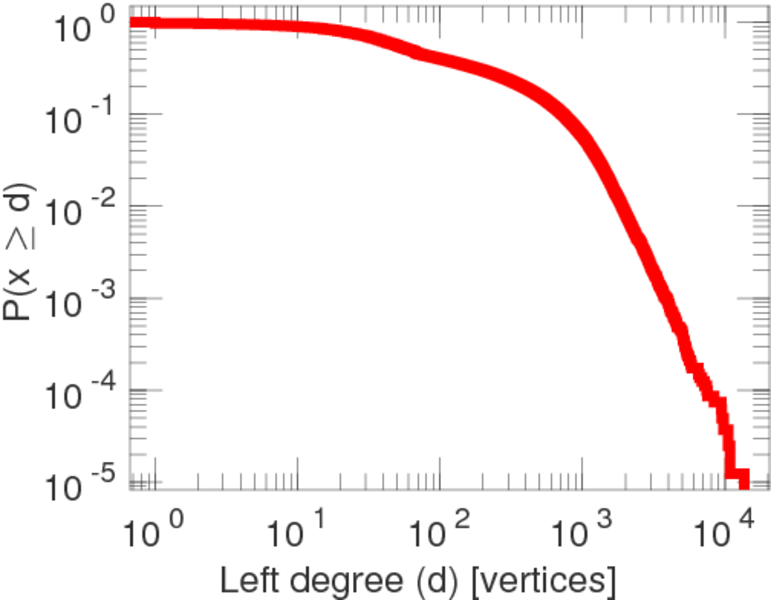
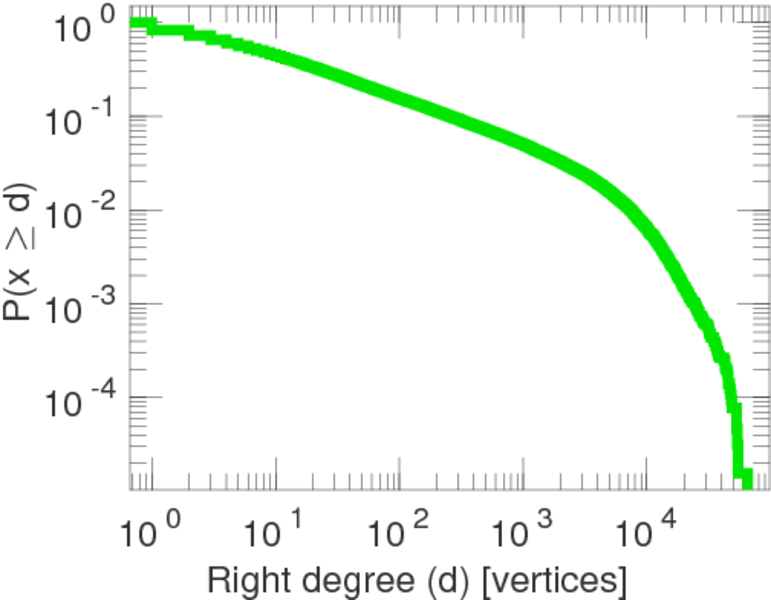
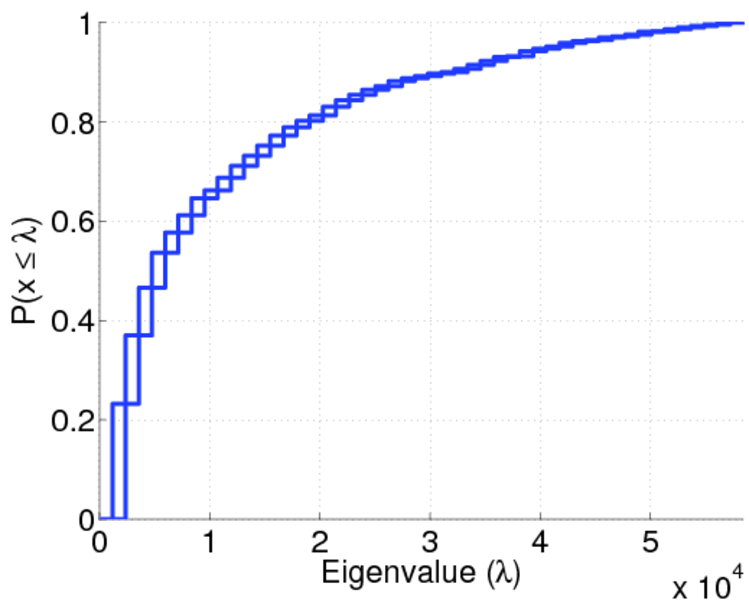
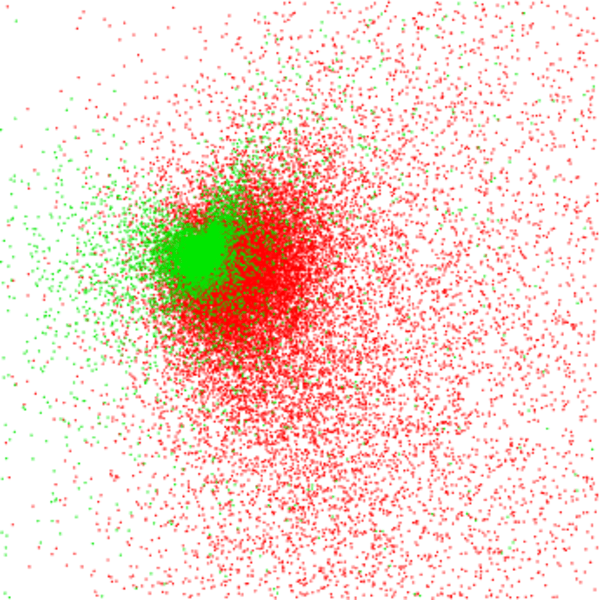
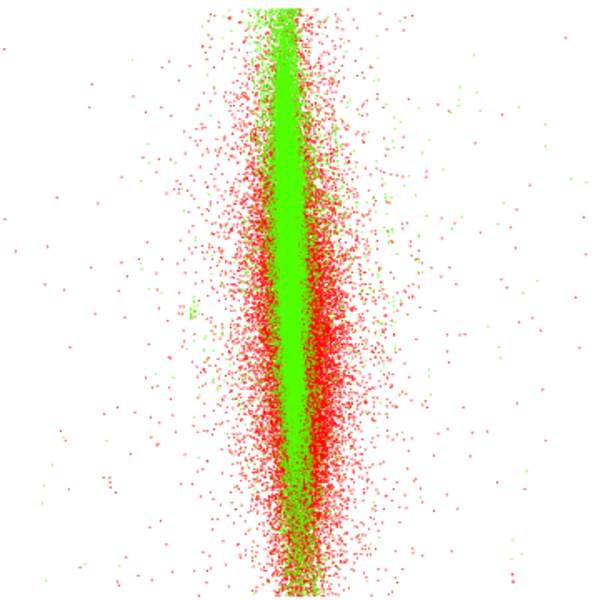
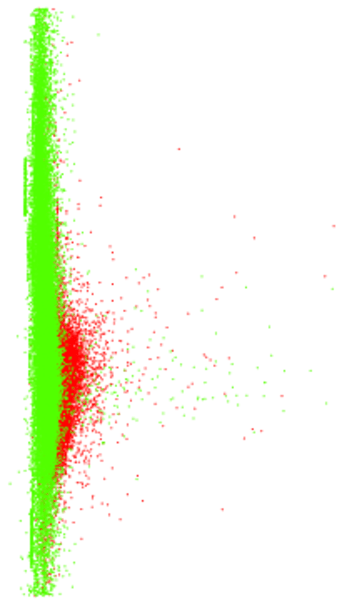
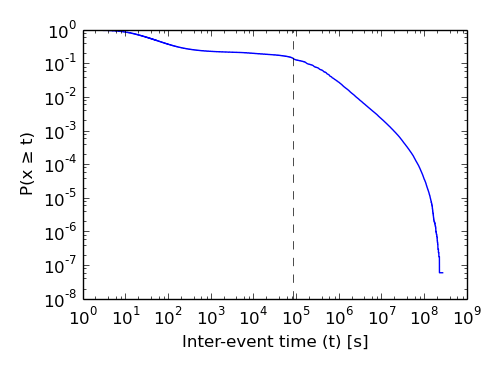
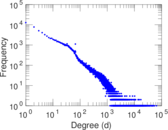
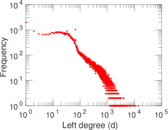
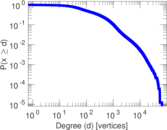
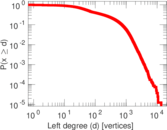
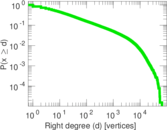
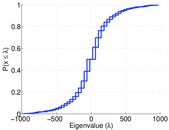
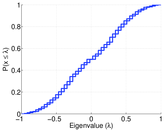
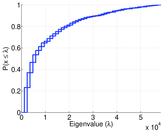
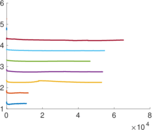
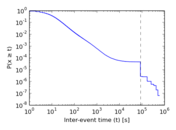
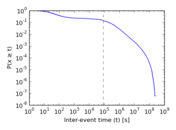
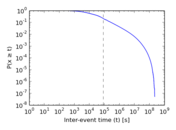
Plots


Downloads
References
|
[1]
|
Jérôme Kunegis.
KONECT – The Koblenz Network Collection.
In Proc. Int. Conf. on World Wide Web Companion, pages
1343–1350, 2013.
[ http ]
|
|
[2]
|
Alan Said, Ernesto W. De Luca, and Sahin Albayrak.
How social relationships affect user similarities.
In Proc. IUI Workshop on Soc. Recomm. Syst., 2010.
|
 KONECT ‣ Networks ‣
Buy Me a Coffee
KONECT ‣ Networks ‣
Buy Me a Coffee