Last.fm bands
This bipartite network contains user–band listening events from the music
website last.fm. An edge shows that a user listened to a song of a band.
Metadata
Statistics
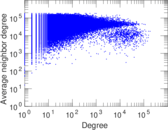
| Size | n = | 175,069
|
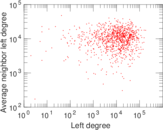
| Left size | n1 = | 992
|
| Right size | n2 = | 174,077
|
| Volume | m = | 19,150,868
|
| Unique edge count | m̿ = | 898,062
|
| Wedge count | s = | 889,895,853
|
| Claw count | z = | 890,736,635,531
|
| Cross count | x = | 976,152,225,850,783
|
| Square count | q = | 4,419,565,780
|
| 4-Tour count | T4 = | 38,918,474,416
|
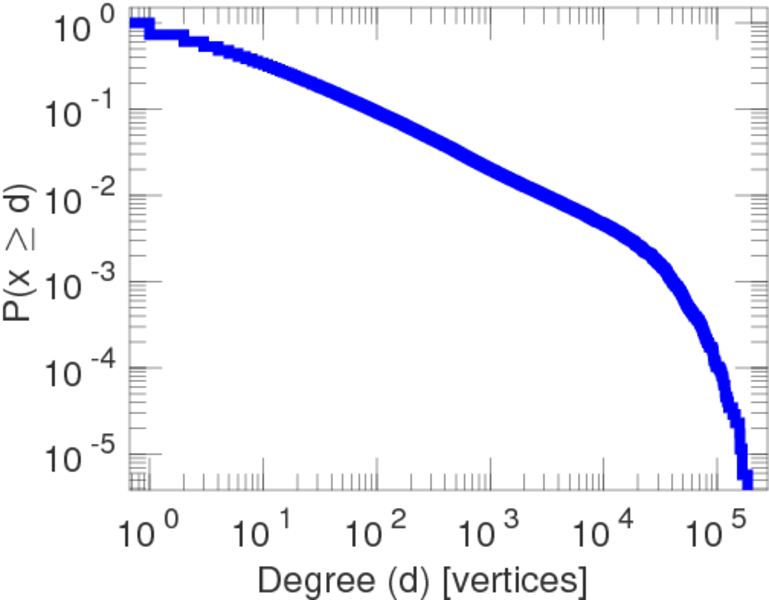
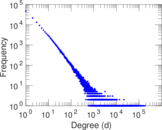
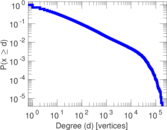
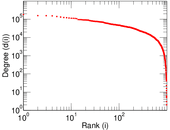
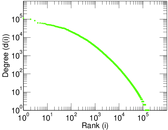
| Maximum degree | dmax = | 183,103
|
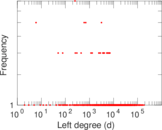
| Maximum left degree | d1max = | 183,103
|
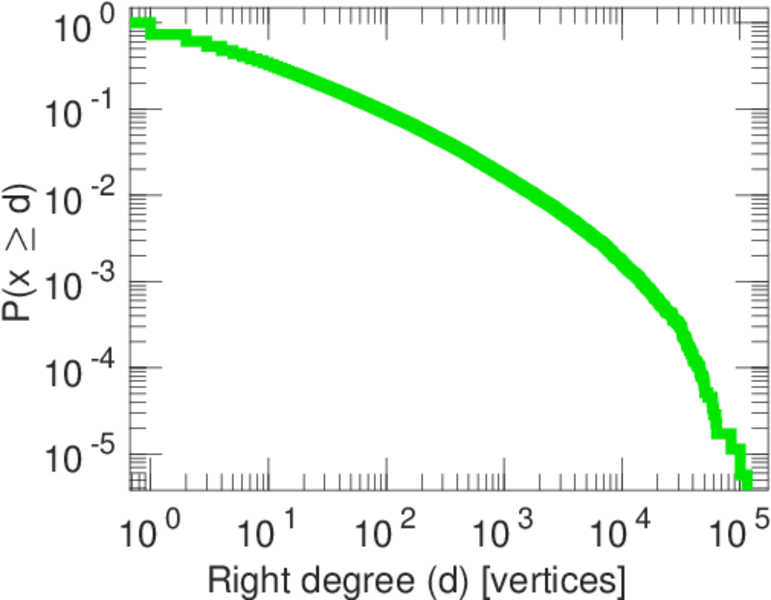
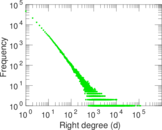
| Maximum right degree | d2max = | 115,209
|
| Average degree | d = | 218.781
|
| Average left degree | d1 = | 19,305.3
|
| Average right degree | d2 = | 110.014
|
| Fill | p = | 0.005 200 60
|
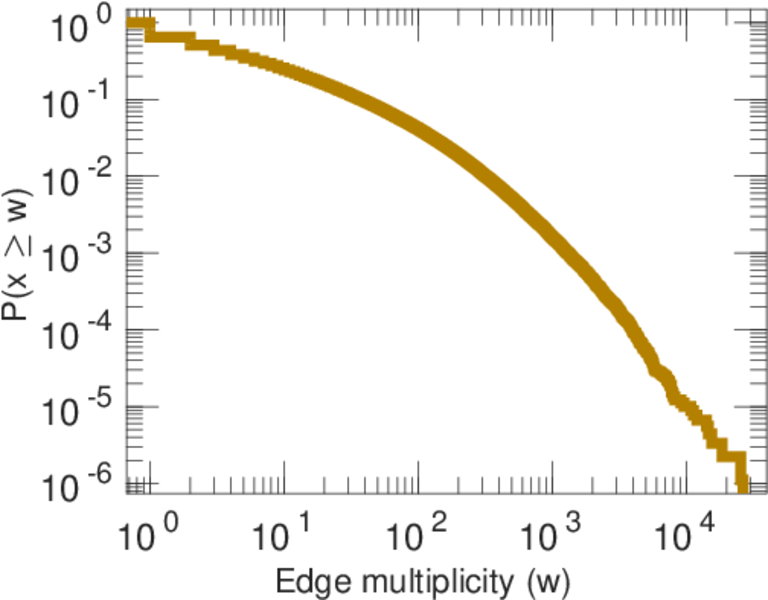
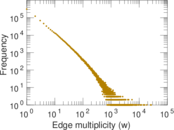
| Average edge multiplicity | m̃ = | 21.324 7
|
| Size of LCC | N = | 175,069
|
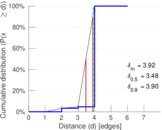
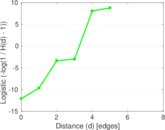
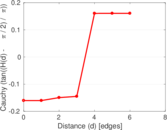
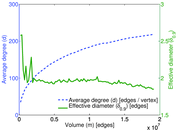
| Diameter | δ = | 6
|
| 50-Percentile effective diameter | δ0.5 = | 3.475 46
|
| 90-Percentile effective diameter | δ0.9 = | 3.895 35
|
| Median distance | δM = | 4
|
| Mean distance | δm = | 3.919 94
|
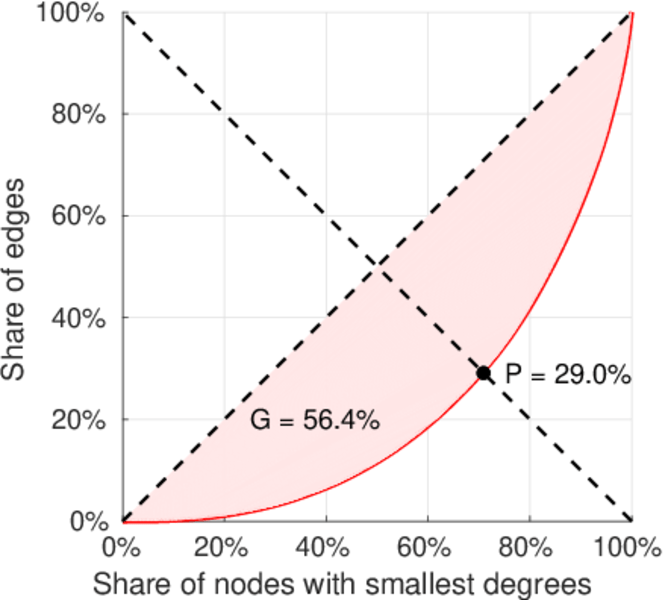
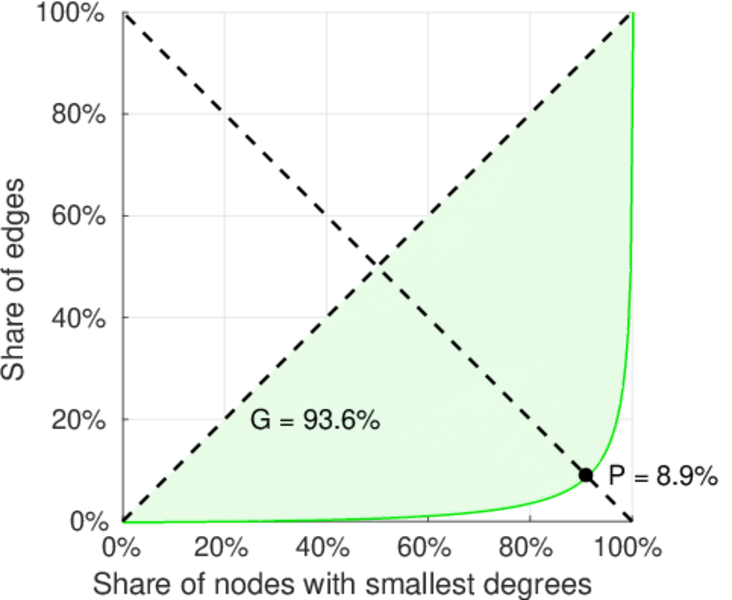
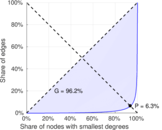
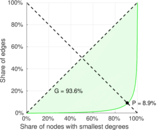
| Gini coefficient | G = | 0.964 193
|
| Balanced inequality ratio | P = | 0.060 768 4
|
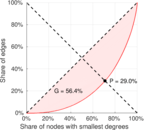
| Left balanced inequality ratio | P1 = | 0.289 593
|
| Right balanced inequality ratio | P2 = | 0.089 095 2
|
| Relative edge distribution entropy | Her = | 0.760 117
|
| Power law exponent | γ = | 2.581 27
|
| Tail power law exponent | γt = | 1.811 00
|
| Tail power law exponent with p | γ3 = | 1.811 00
|
| p-value | p = | 0.000 00
|
| Left tail power law exponent with p | γ3,1 = | 1.421 00
|
| Left p-value | p1 = | 0.000 00
|
| Right tail power law exponent with p | γ3,2 = | 1.881 00
|
| Right p-value | p2 = | 0.000 00
|
| Degree assortativity | ρ = | −0.177 727
|
| Degree assortativity p-value | pρ = | 0.000 00
|
| Spectral norm | α = | 27,811.3
|
| Algebraic connectivity | a = | 0.878 651
|
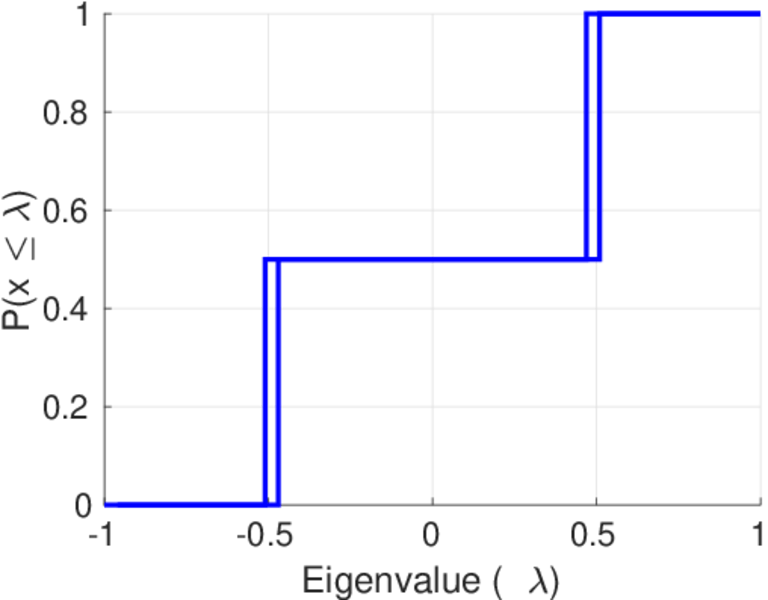
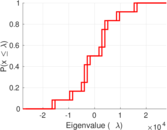
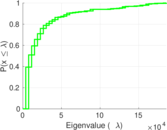
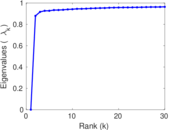
| Spectral separation | |λ1[A] / λ2[A]| = | 1.003 32
|
| Controllability | C = | 173,085
|
| Relative controllability | Cr = | 0.988 667
|
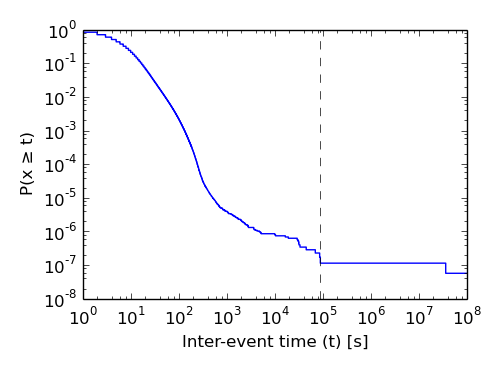
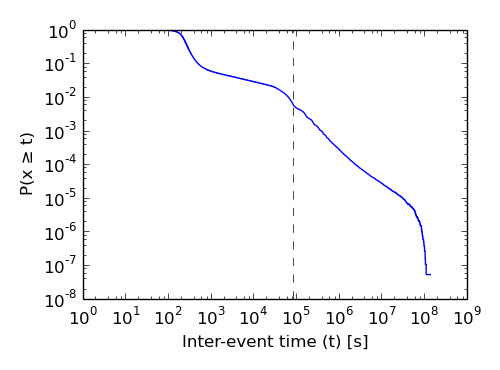
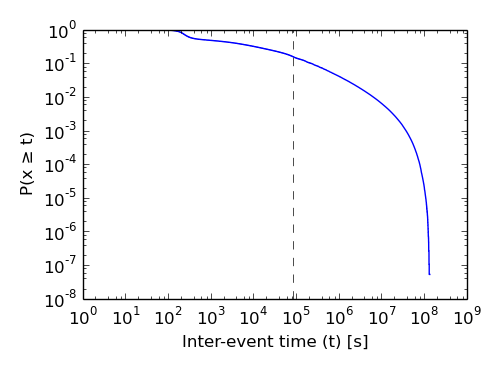
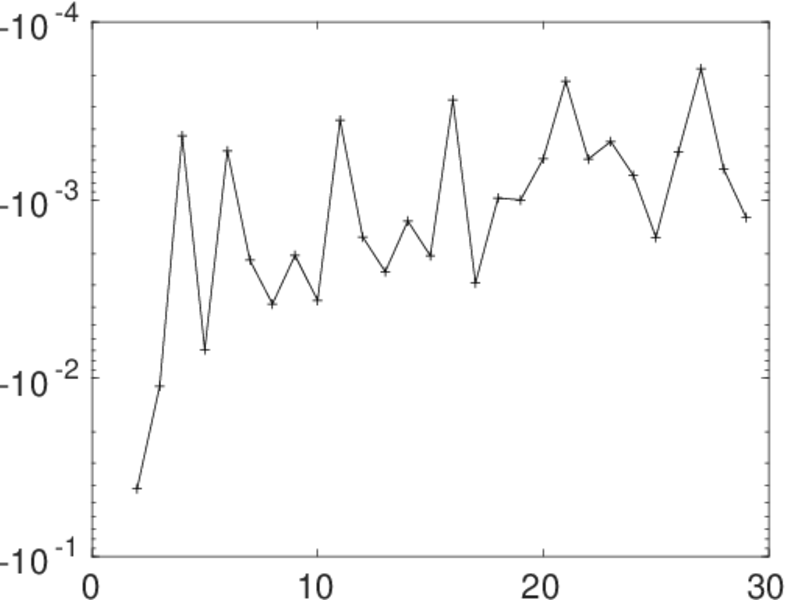
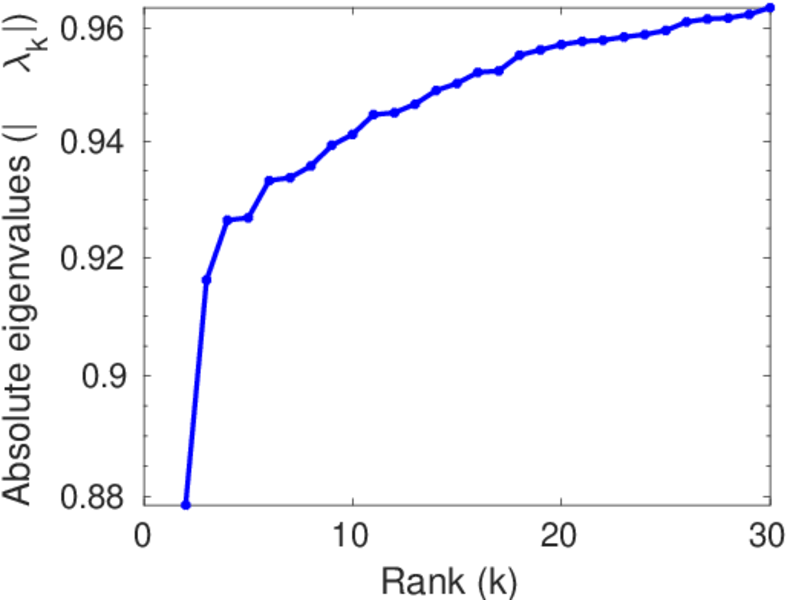
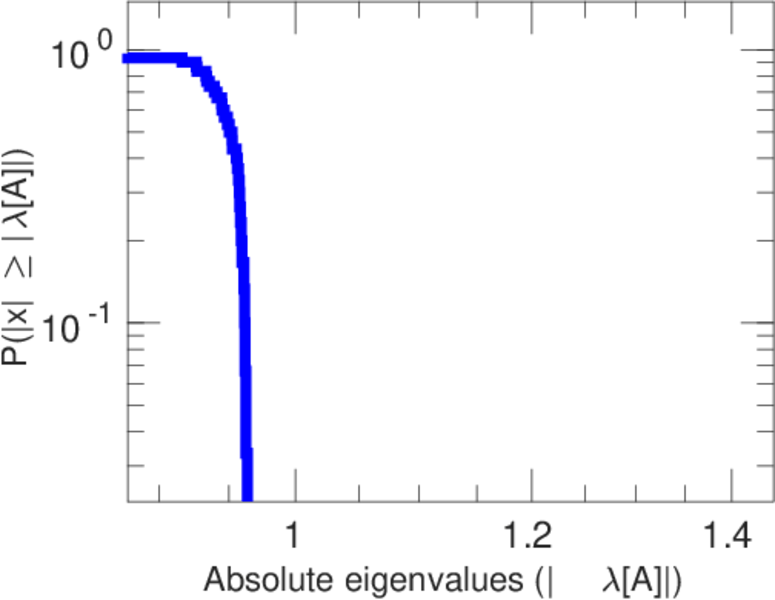
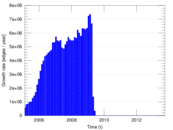
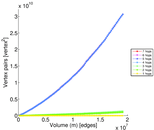
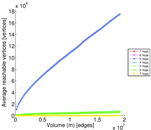
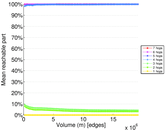
Plots


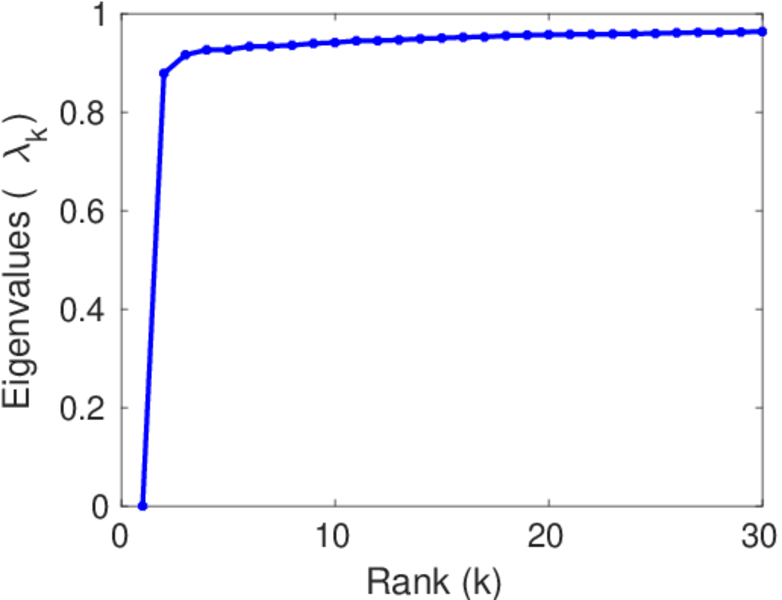
Matrix decompositions plots


Downloads
References
|
[1]
|
Jérôme Kunegis.
KONECT – The Koblenz Network Collection.
In Proc. Int. Conf. on World Wide Web Companion, pages
1343–1350, 2013.
[ http ]
|
|
[2]
|
Òscar Celma.
Music Recommendation and Discovery in the Long Tail.
Springer, 2010.
|
 KONECT ‣ Networks ‣
Buy Me a Coffee
KONECT ‣ Networks ‣
Buy Me a Coffee