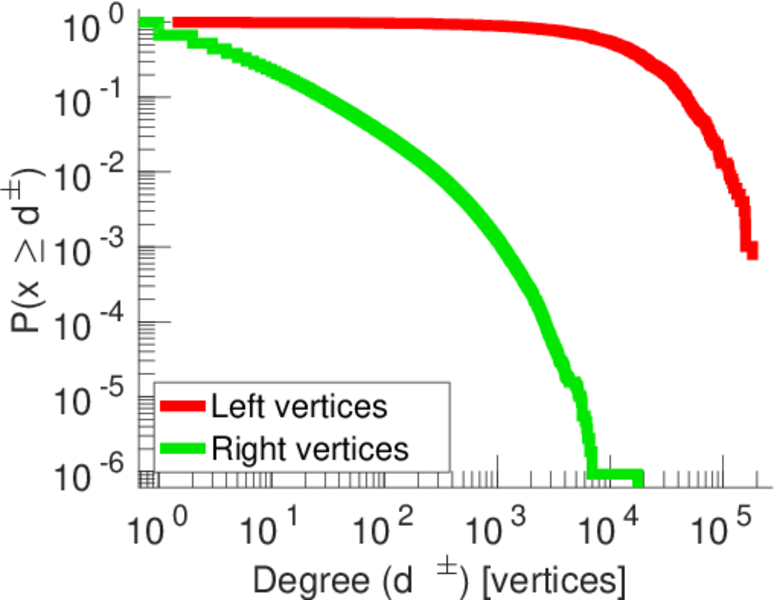
Last.fm songs
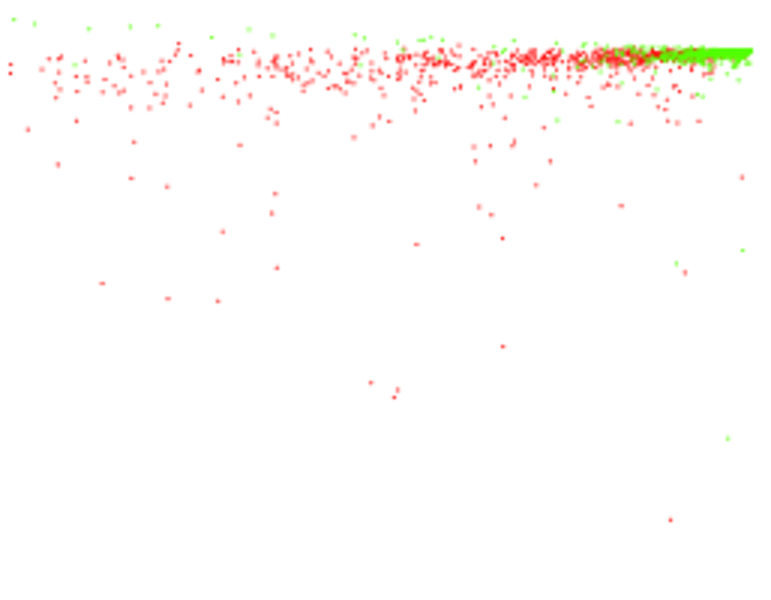
This bipartite network represent the user–song listening habits of last.fm
users. Left nodes are users and right nodes are songs. An edge connects users
and songs they have listened to.
Metadata
Statistics
| Size | n = | 1,085,612
|
| Left size | n1 = | 992
|
| Right size | n2 = | 1,084,620
|
| Volume | m = | 19,150,868
|
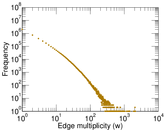
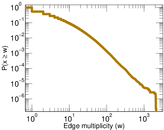
| Unique edge count | m̿ = | 4,413,834
|
| Wedge count | s = | 22,053,978,162
|
| Claw count | z = | 139,516,276,582,416
|
| Cross count | x = | 1,074,730,261,041,871,232
|
| Square count | q = | 32,357,367,219
|
| 4-Tour count | T4 = | 347,084,940,232
|
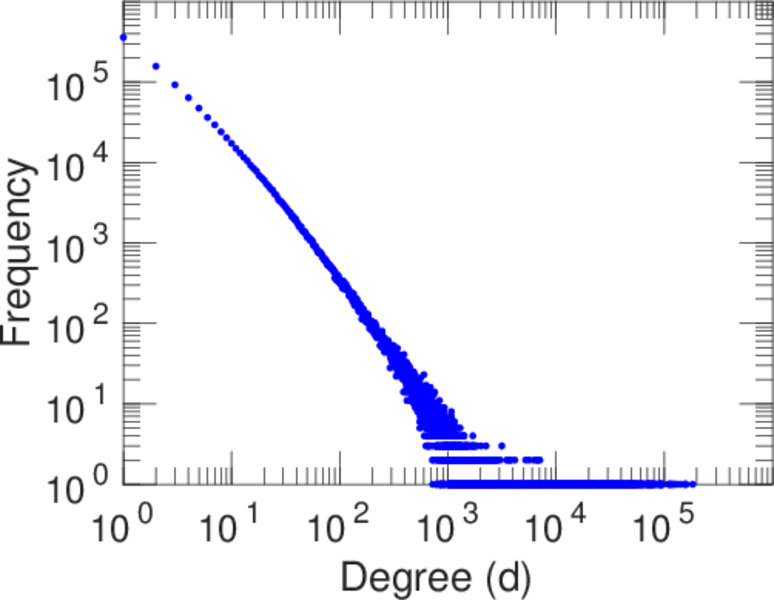
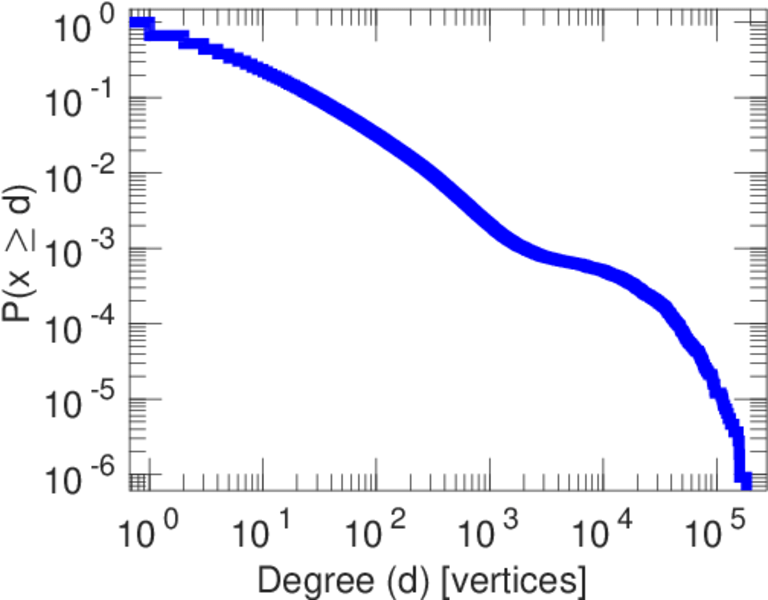
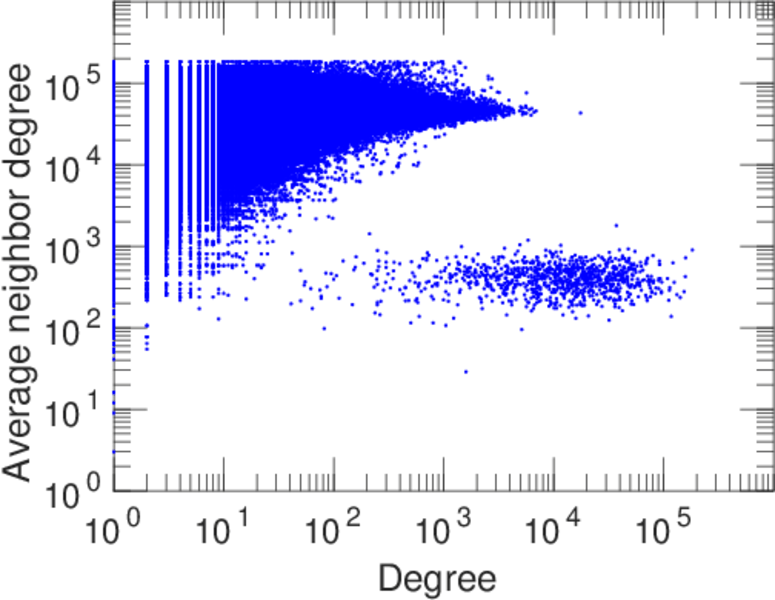
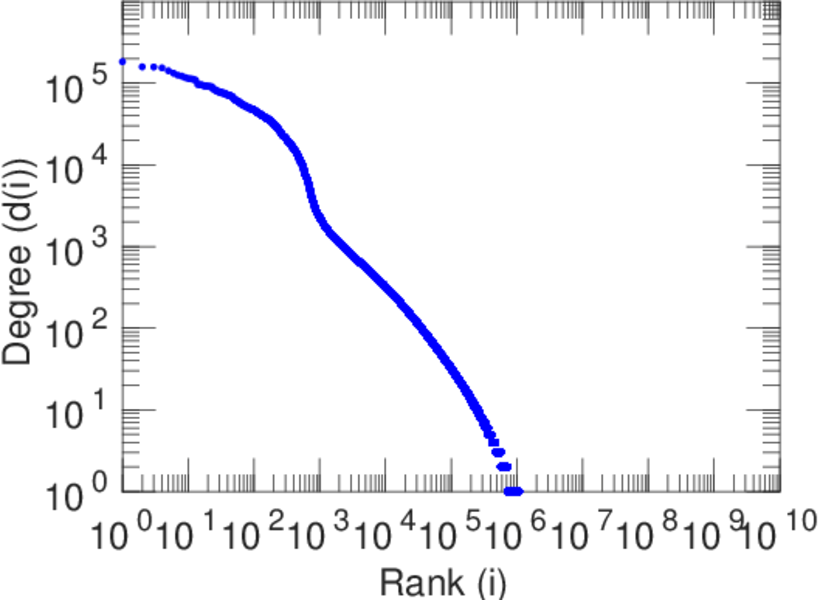
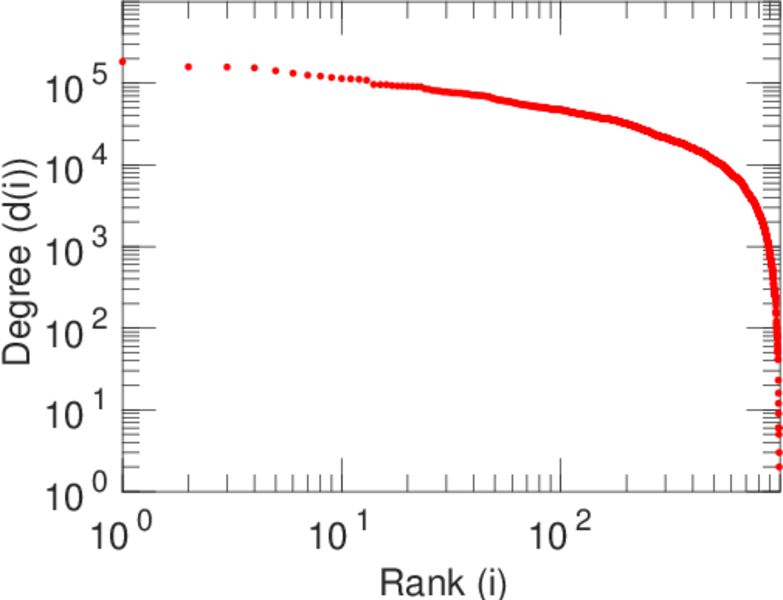
| Maximum degree | dmax = | 183,103
|
| Maximum left degree | d1max = | 183,103
|
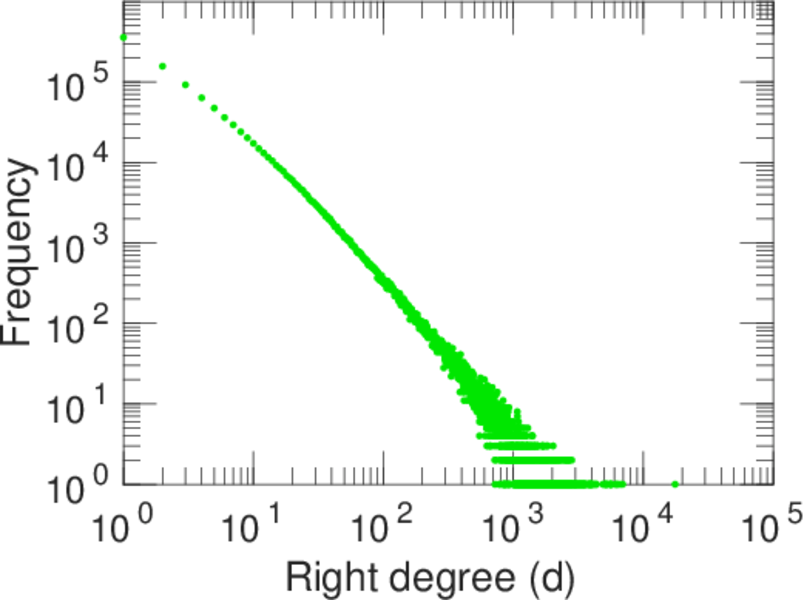
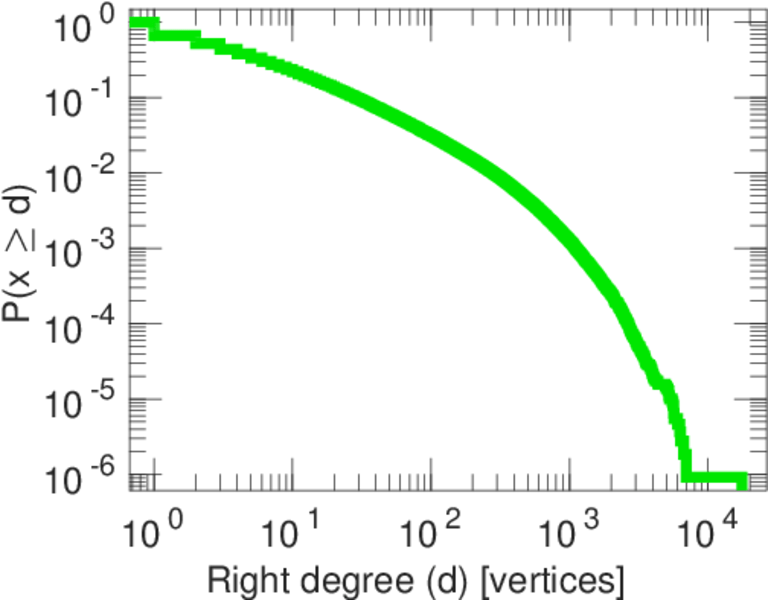
| Maximum right degree | d2max = | 17,601
|
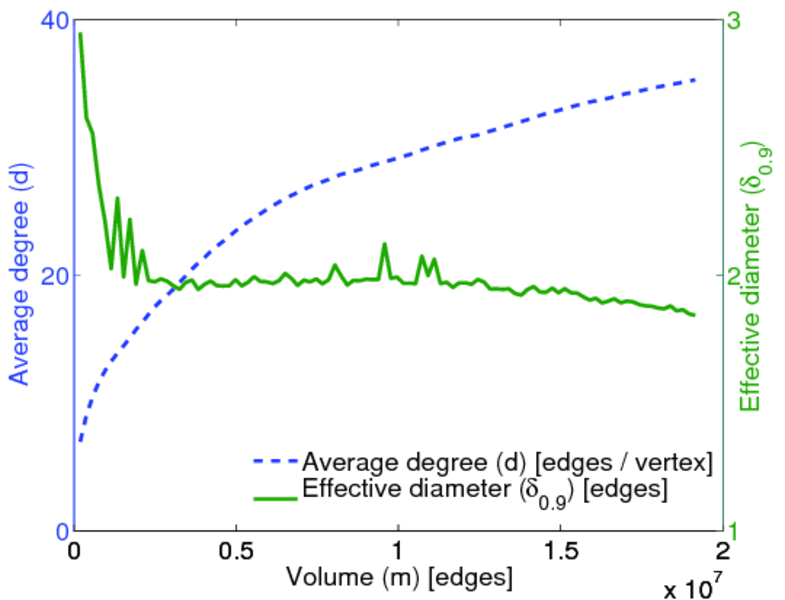
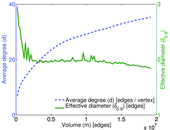
| Average degree | d = | 35.281 2
|
| Average left degree | d1 = | 19,305.3
|
| Average right degree | d2 = | 17.656 8
|
| Fill | p = | 0.004 102 29
|
| Average edge multiplicity | m̃ = | 4.338 83
|
| Size of LCC | N = | 1,085,611
|
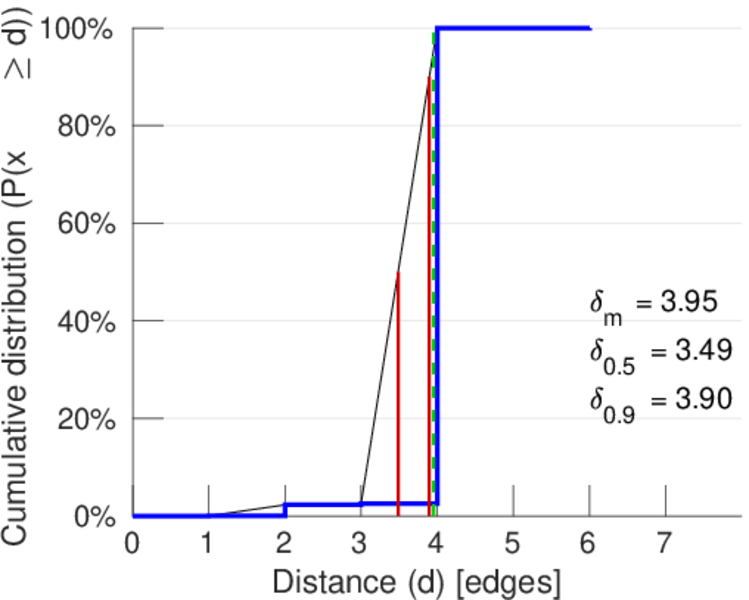
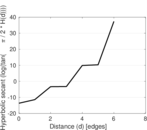
| Diameter | δ = | 6
|
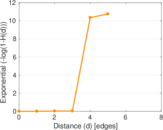
| 50-Percentile effective diameter | δ0.5 = | 3.487 12
|
| 90-Percentile effective diameter | δ0.9 = | 3.897 45
|
| Median distance | δM = | 4
|
| Mean distance | δm = | 3.952 16
|
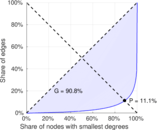
| Gini coefficient | G = | 0.908 531
|
| Balanced inequality ratio | P = | 0.111 067
|
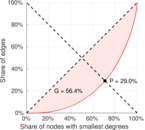
| Left balanced inequality ratio | P1 = | 0.289 593
|
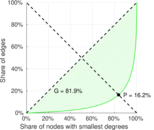
| Right balanced inequality ratio | P2 = | 0.161 995
|
| Relative edge distribution entropy | Her = | 0.737 931
|
| Power law exponent | γ = | 2.713 84
|
| Tail power law exponent | γt = | 1.921 00
|
| Degree assortativity | ρ = | −0.114 597
|
| Degree assortativity p-value | pρ = | 0.000 00
|
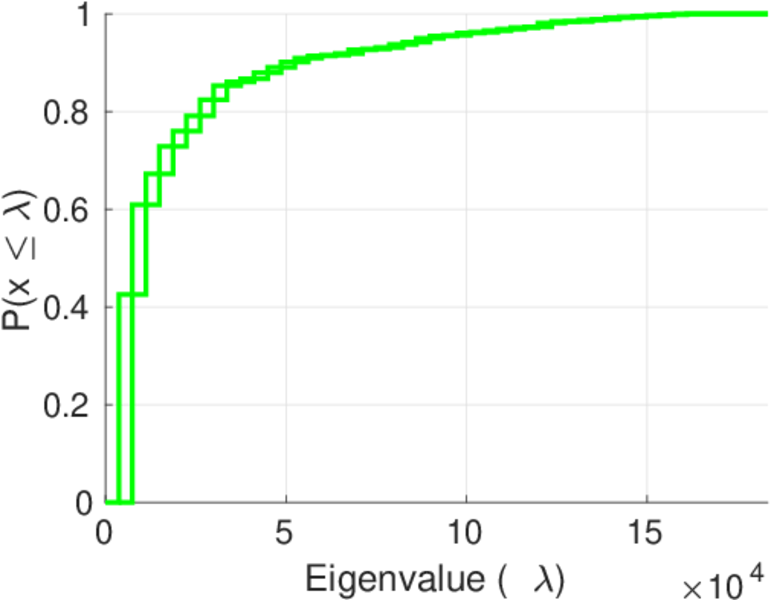
| Spectral norm | α = | 7,516.29
|
| Algebraic connectivity | a = | 0.518 714
|
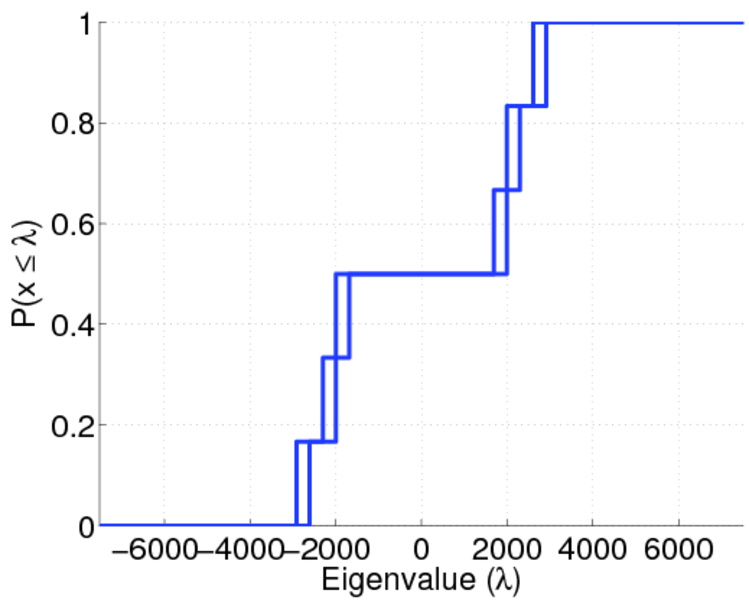
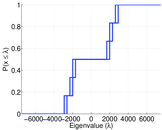
| Spectral separation | |λ1[A] / λ2[A]| = | 1.043 10
|
| Controllability | C = | 1,083,628
|
| Relative controllability | Cr = | 0.998 172
|
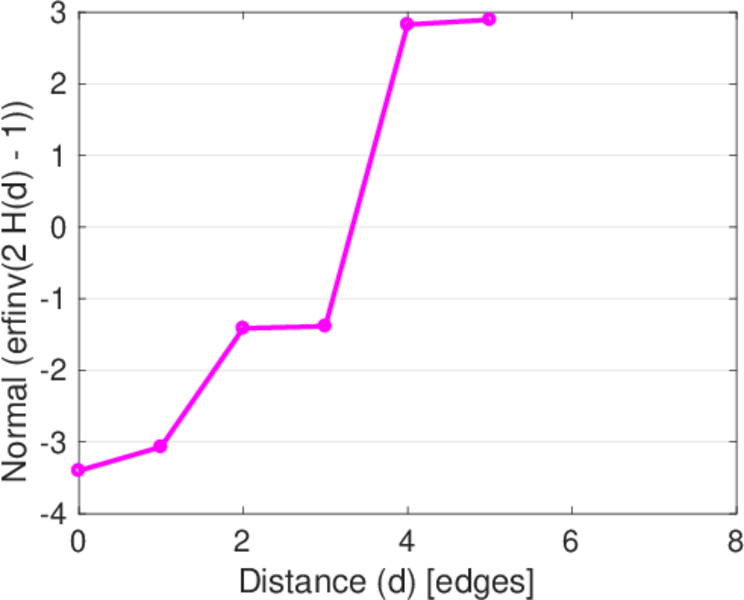
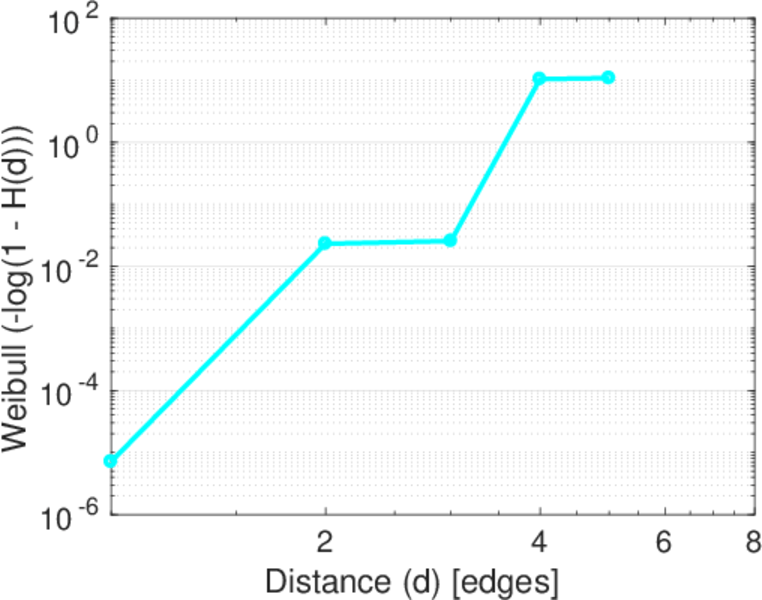
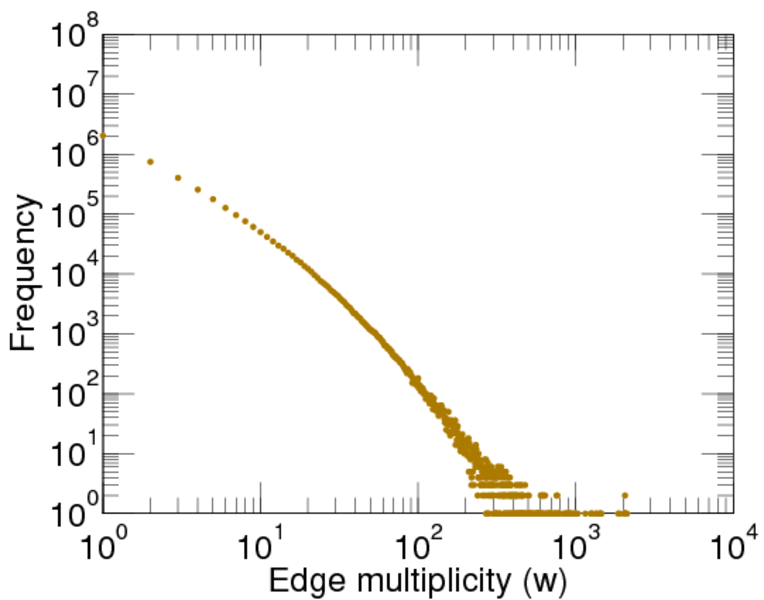
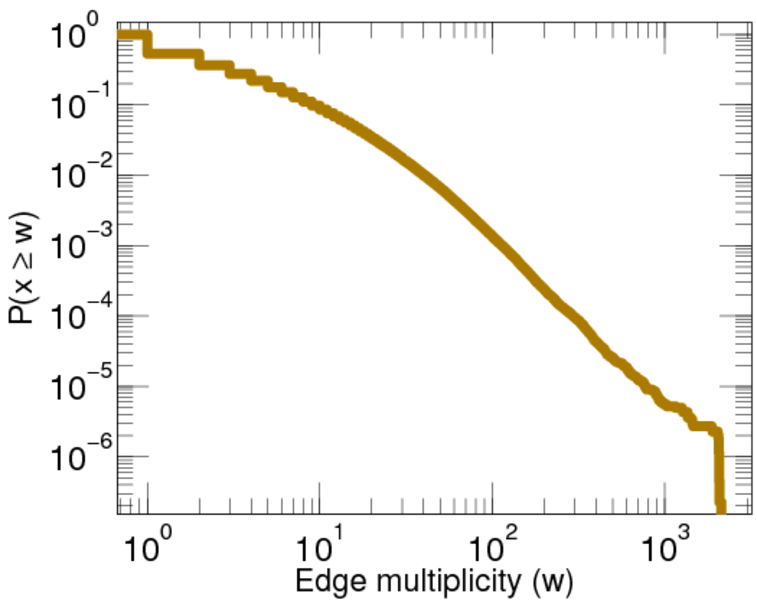
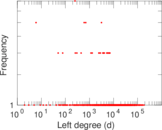
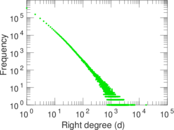
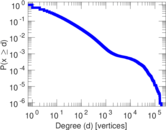
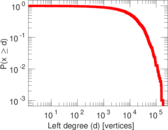
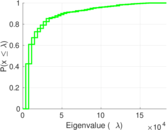
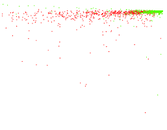
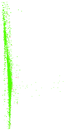
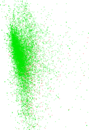
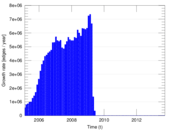
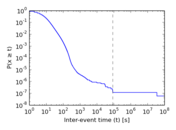
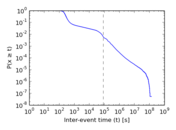
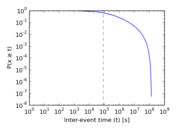
Plots


Downloads
References
|
[1]
|
Jérôme Kunegis.
KONECT – The Koblenz Network Collection.
In Proc. Int. Conf. on World Wide Web Companion, pages
1343–1350, 2013.
[ http ]
|
|
[2]
|
Òscar Celma.
Music Recommendation and Discovery in the Long Tail.
Springer, 2010.
|
 KONECT ‣ Networks ‣
Buy Me a Coffee
KONECT ‣ Networks ‣
Buy Me a Coffee