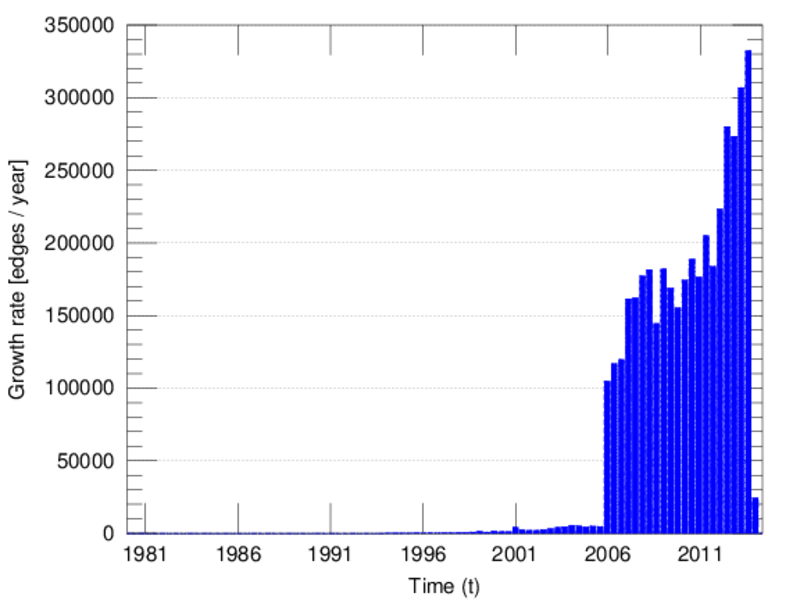
Linux kernel mailing list threads
This bipartite network contains contributions of persons to various threads of
the Linux kernel mailing list. An edge represents a post; left nodes are
persons and right nodes represent threads in the mailing list.
Metadata
Statistics
| Size | n = | 379,554
|
| Left size | n1 = | 42,045
|
| Right size | n2 = | 337,509
|
| Volume | m = | 1,565,683
|
| Unique edge count | m̿ = | 599,858
|
| Wedge count | s = | 1,002,436,389
|
| Square count | q = | 11,033,932
|
| 4-Tour count | T4 = | 4,099,266,604
|
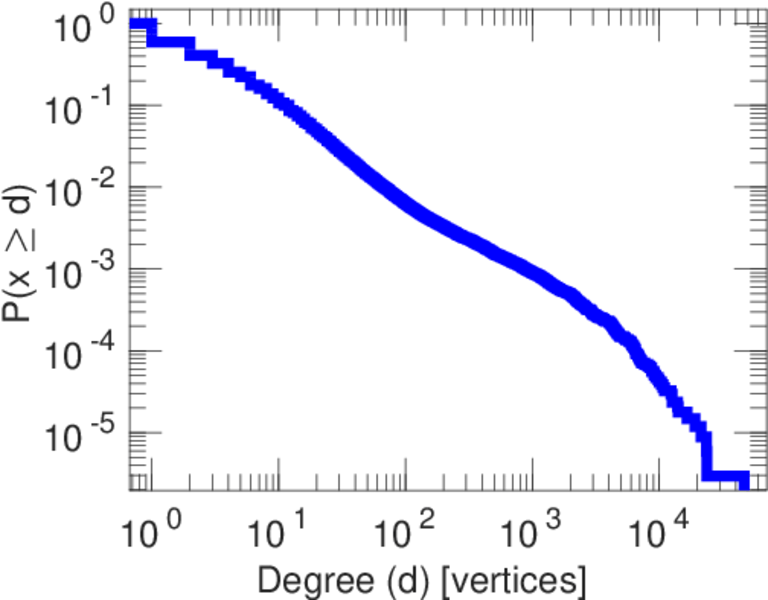
| Maximum degree | dmax = | 46,620
|
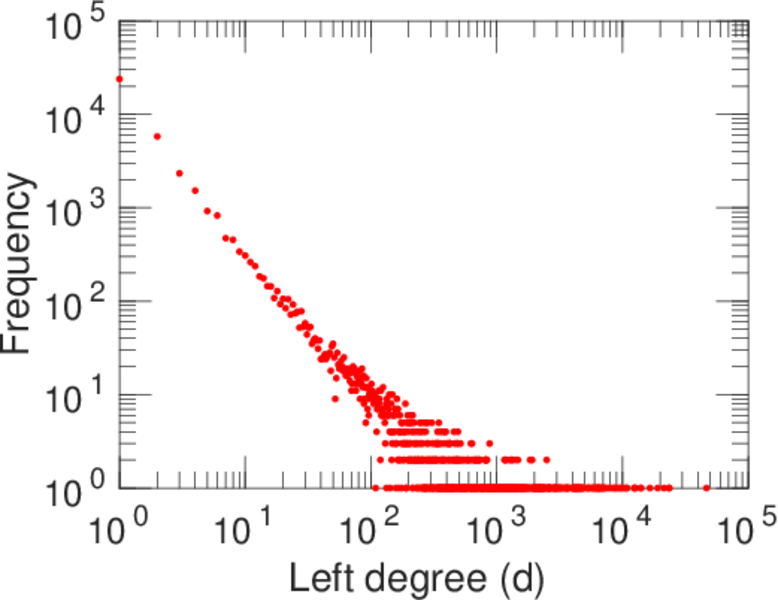
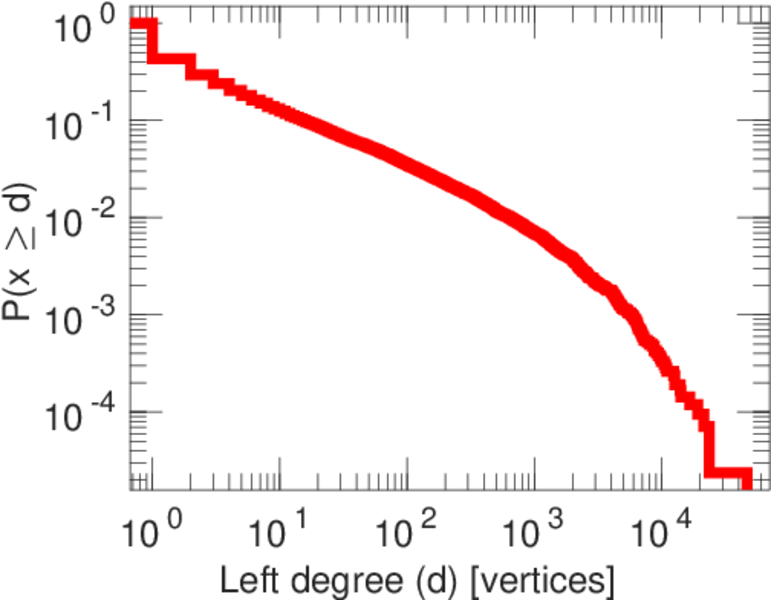
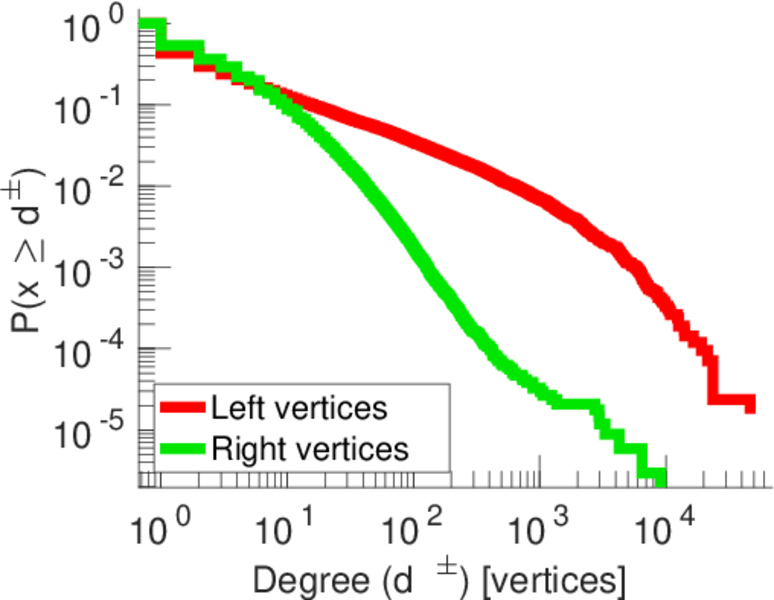
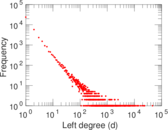
| Maximum left degree | d1max = | 46,620
|
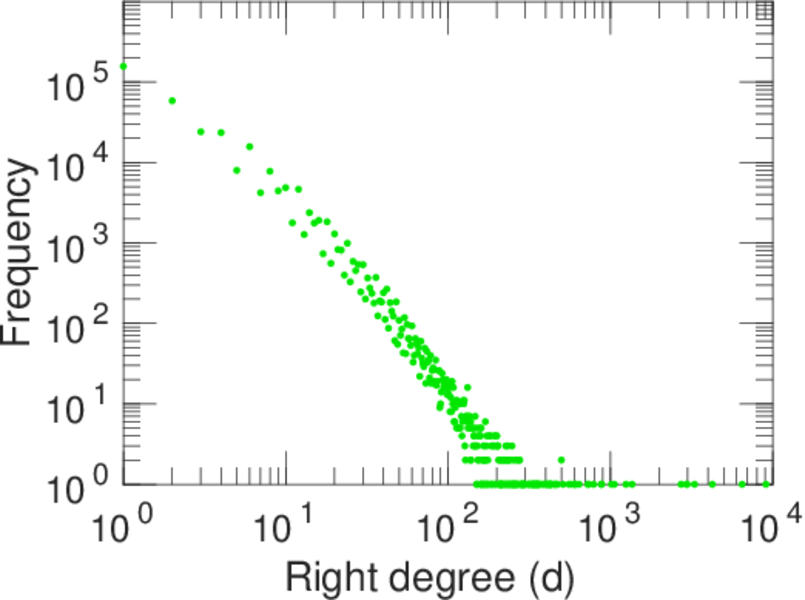
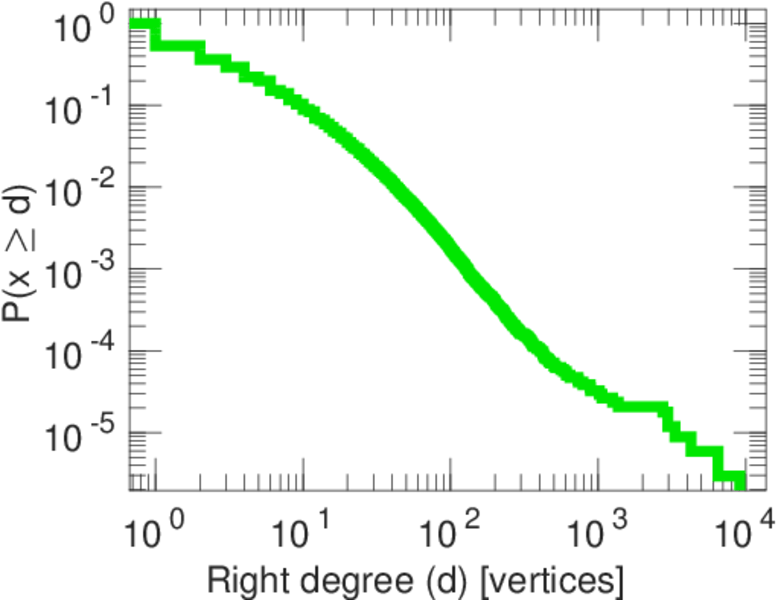
| Maximum right degree | d2max = | 9,101
|
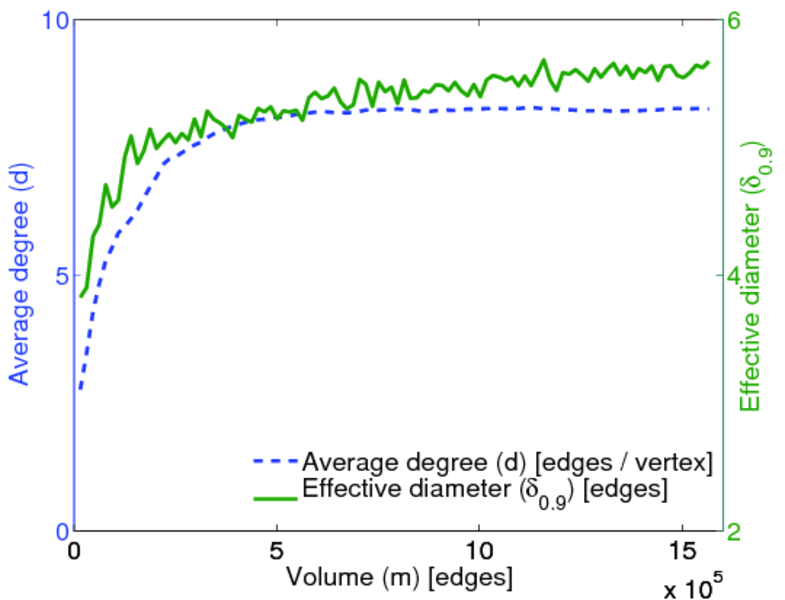
| Average degree | d = | 8.250 12
|
| Average left degree | d1 = | 37.238 3
|
| Average right degree | d2 = | 4.638 94
|
| Fill | p = | 4.227 16 × 10−5
|
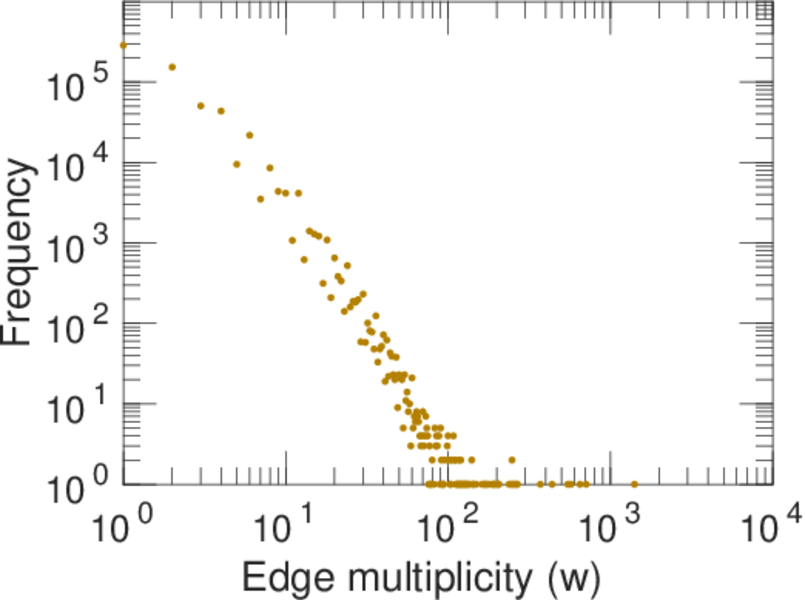
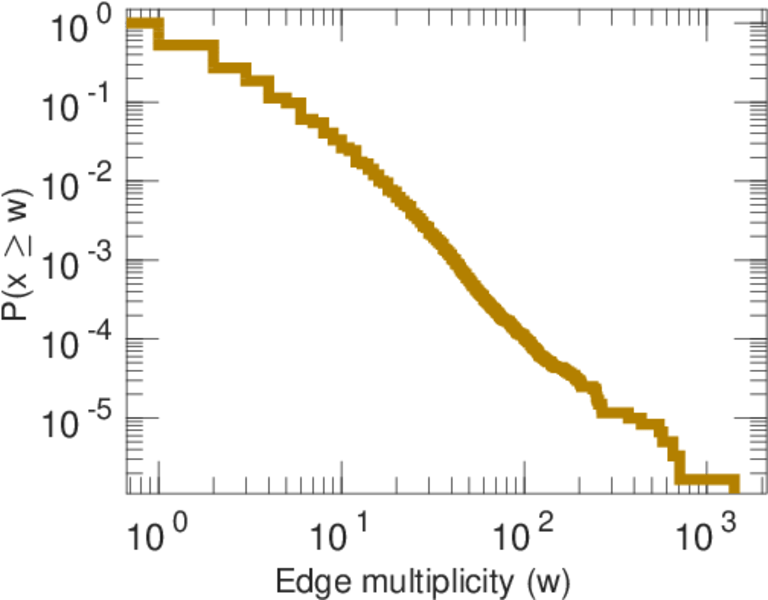
| Average edge multiplicity | m̃ = | 2.610 09
|
| Size of LCC | N = | 364,645
|
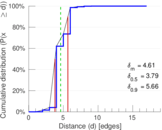
| Diameter | δ = | 22
|
| 50-Percentile effective diameter | δ0.5 = | 3.791 92
|
| 90-Percentile effective diameter | δ0.9 = | 5.656 67
|
| Median distance | δM = | 4
|
| Mean distance | δm = | 4.609 19
|
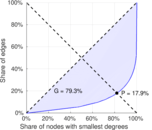
| Gini coefficient | G = | 0.792 924
|
| Balanced inequality ratio | P = | 0.182 741
|
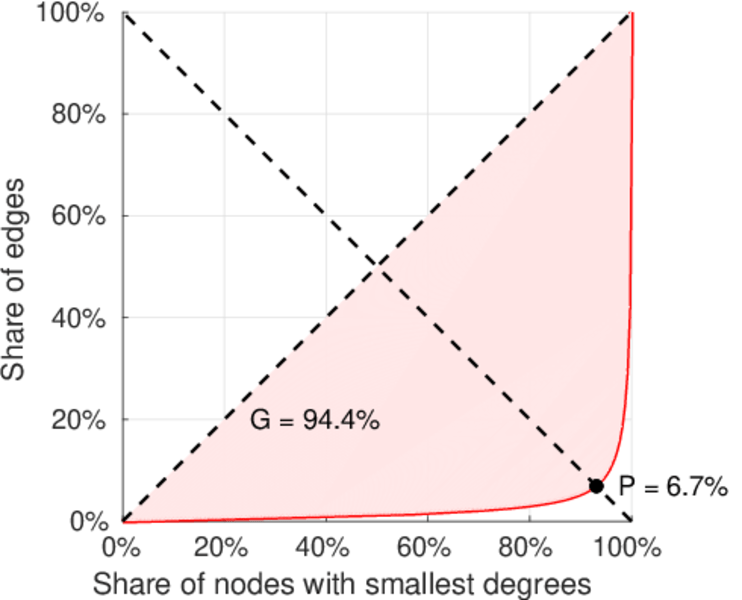
| Left balanced inequality ratio | P1 = | 0.067 359 1
|
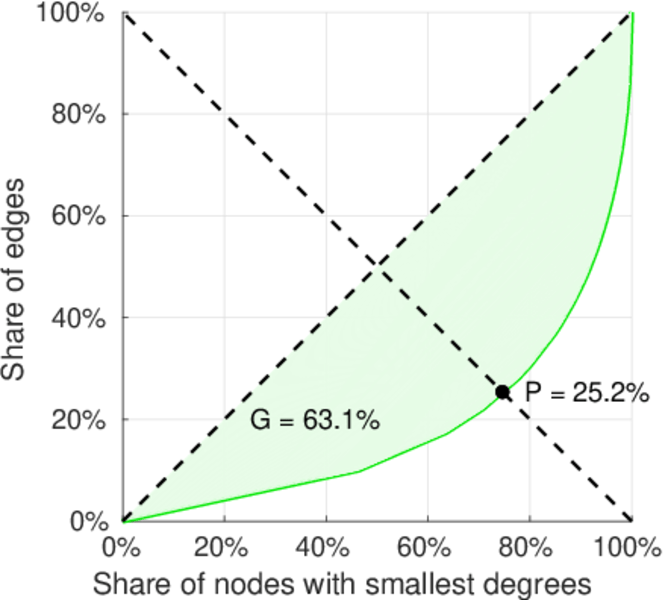
| Right balanced inequality ratio | P2 = | 0.252 499
|
| Relative edge distribution entropy | Her = | 0.808 470
|
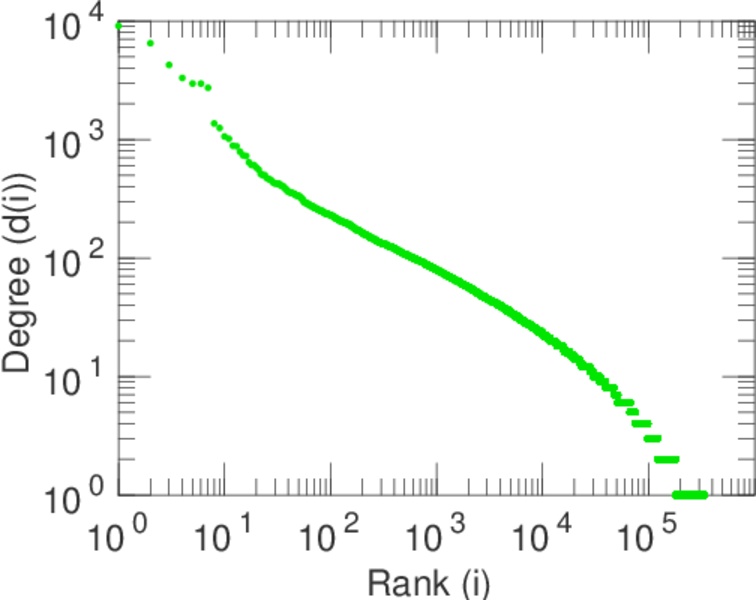
| Power law exponent | γ = | 3.711 04
|
| Tail power law exponent | γt = | 1.751 00
|
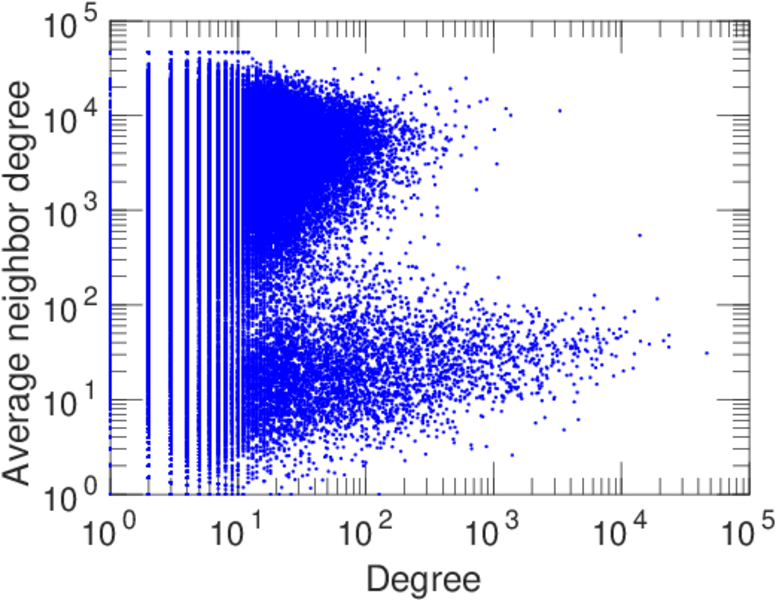
| Degree assortativity | ρ = | −0.079 021 3
|
| Degree assortativity p-value | pρ = | 0.000 00
|
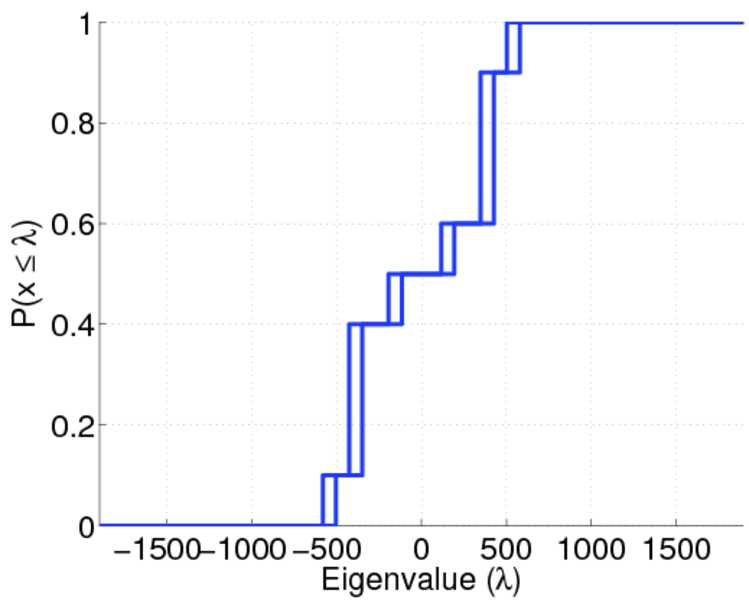
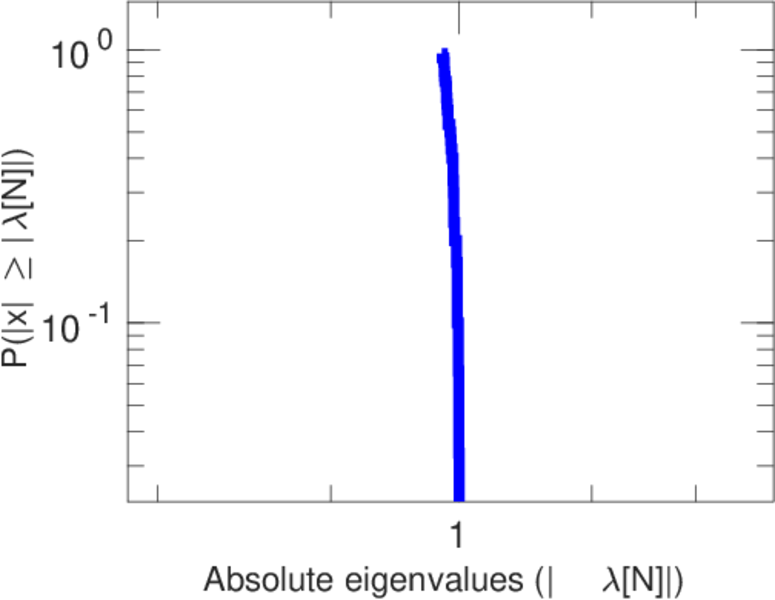
| Spectral norm | α = | 1,895.58
|
| Algebraic connectivity | a = | 0.002 041 70
|
| Controllability | C = | 340,372
|
| Relative controllability | Cr = | 0.896 768
|
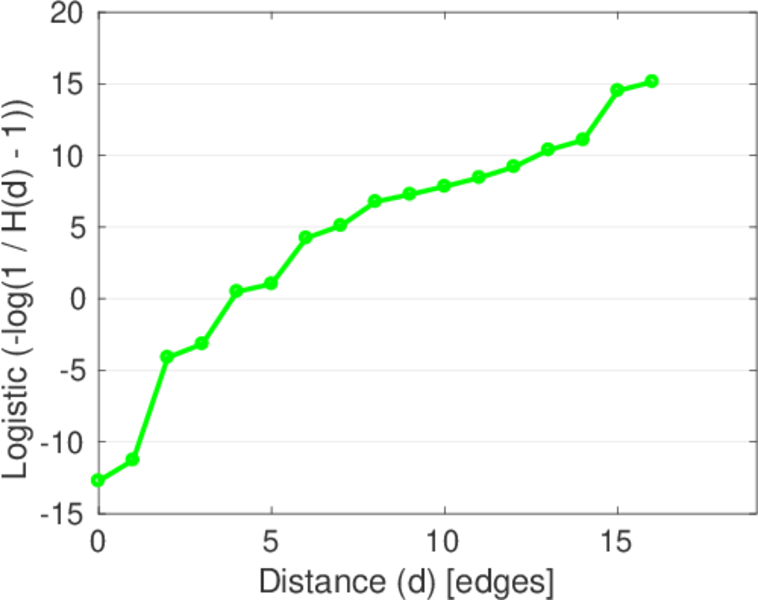
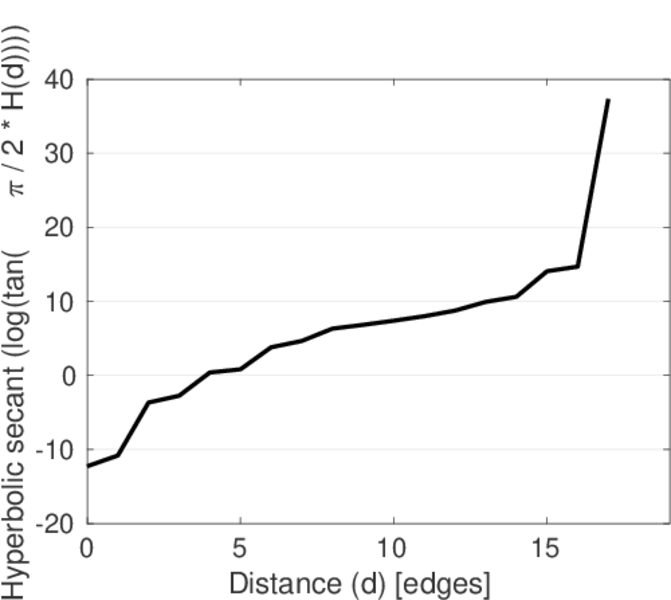
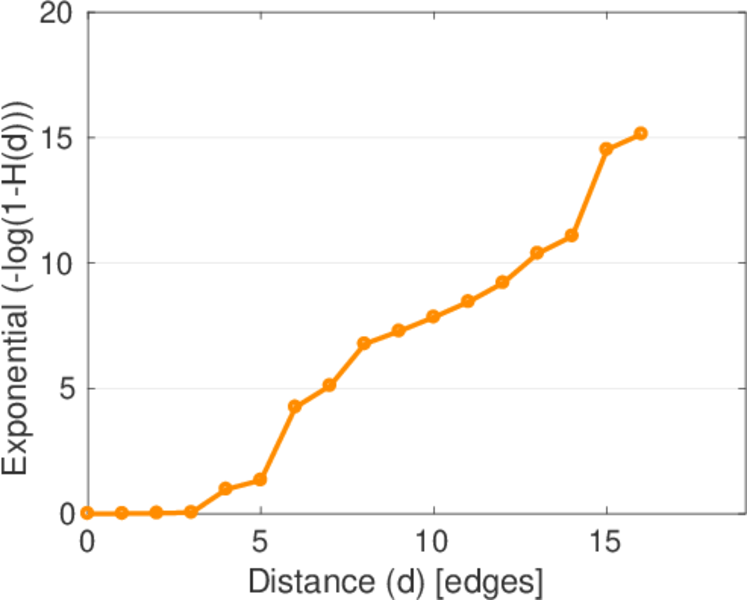
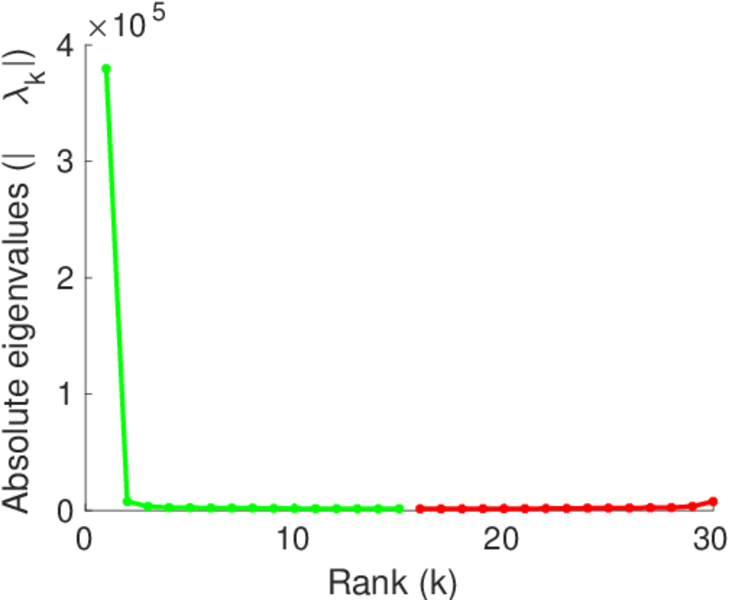
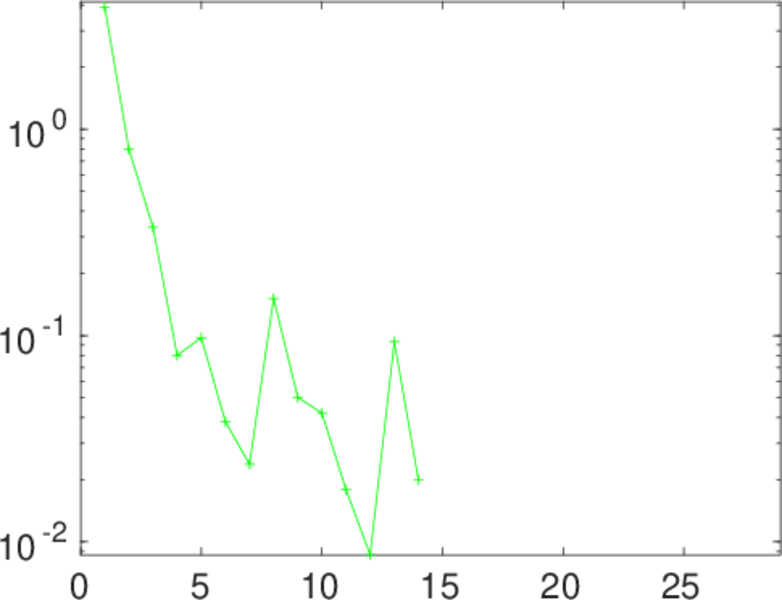
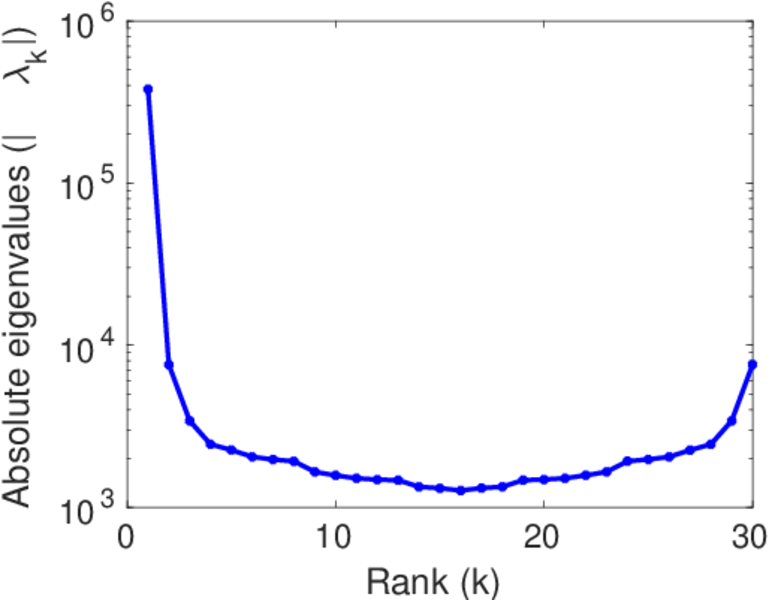
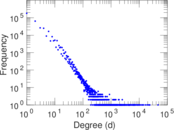
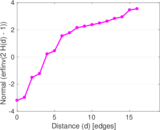
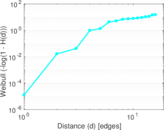
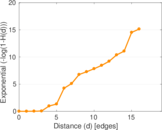
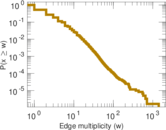
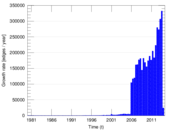
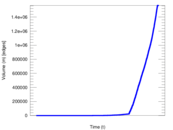
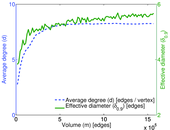
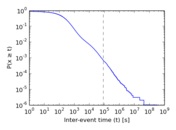
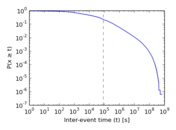
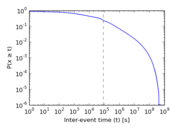
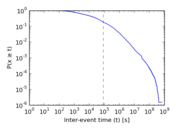
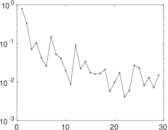
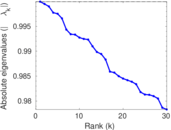
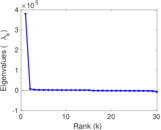
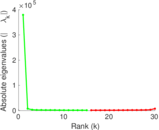
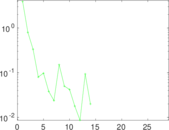
Plots


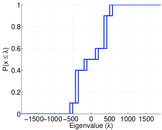

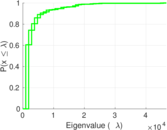


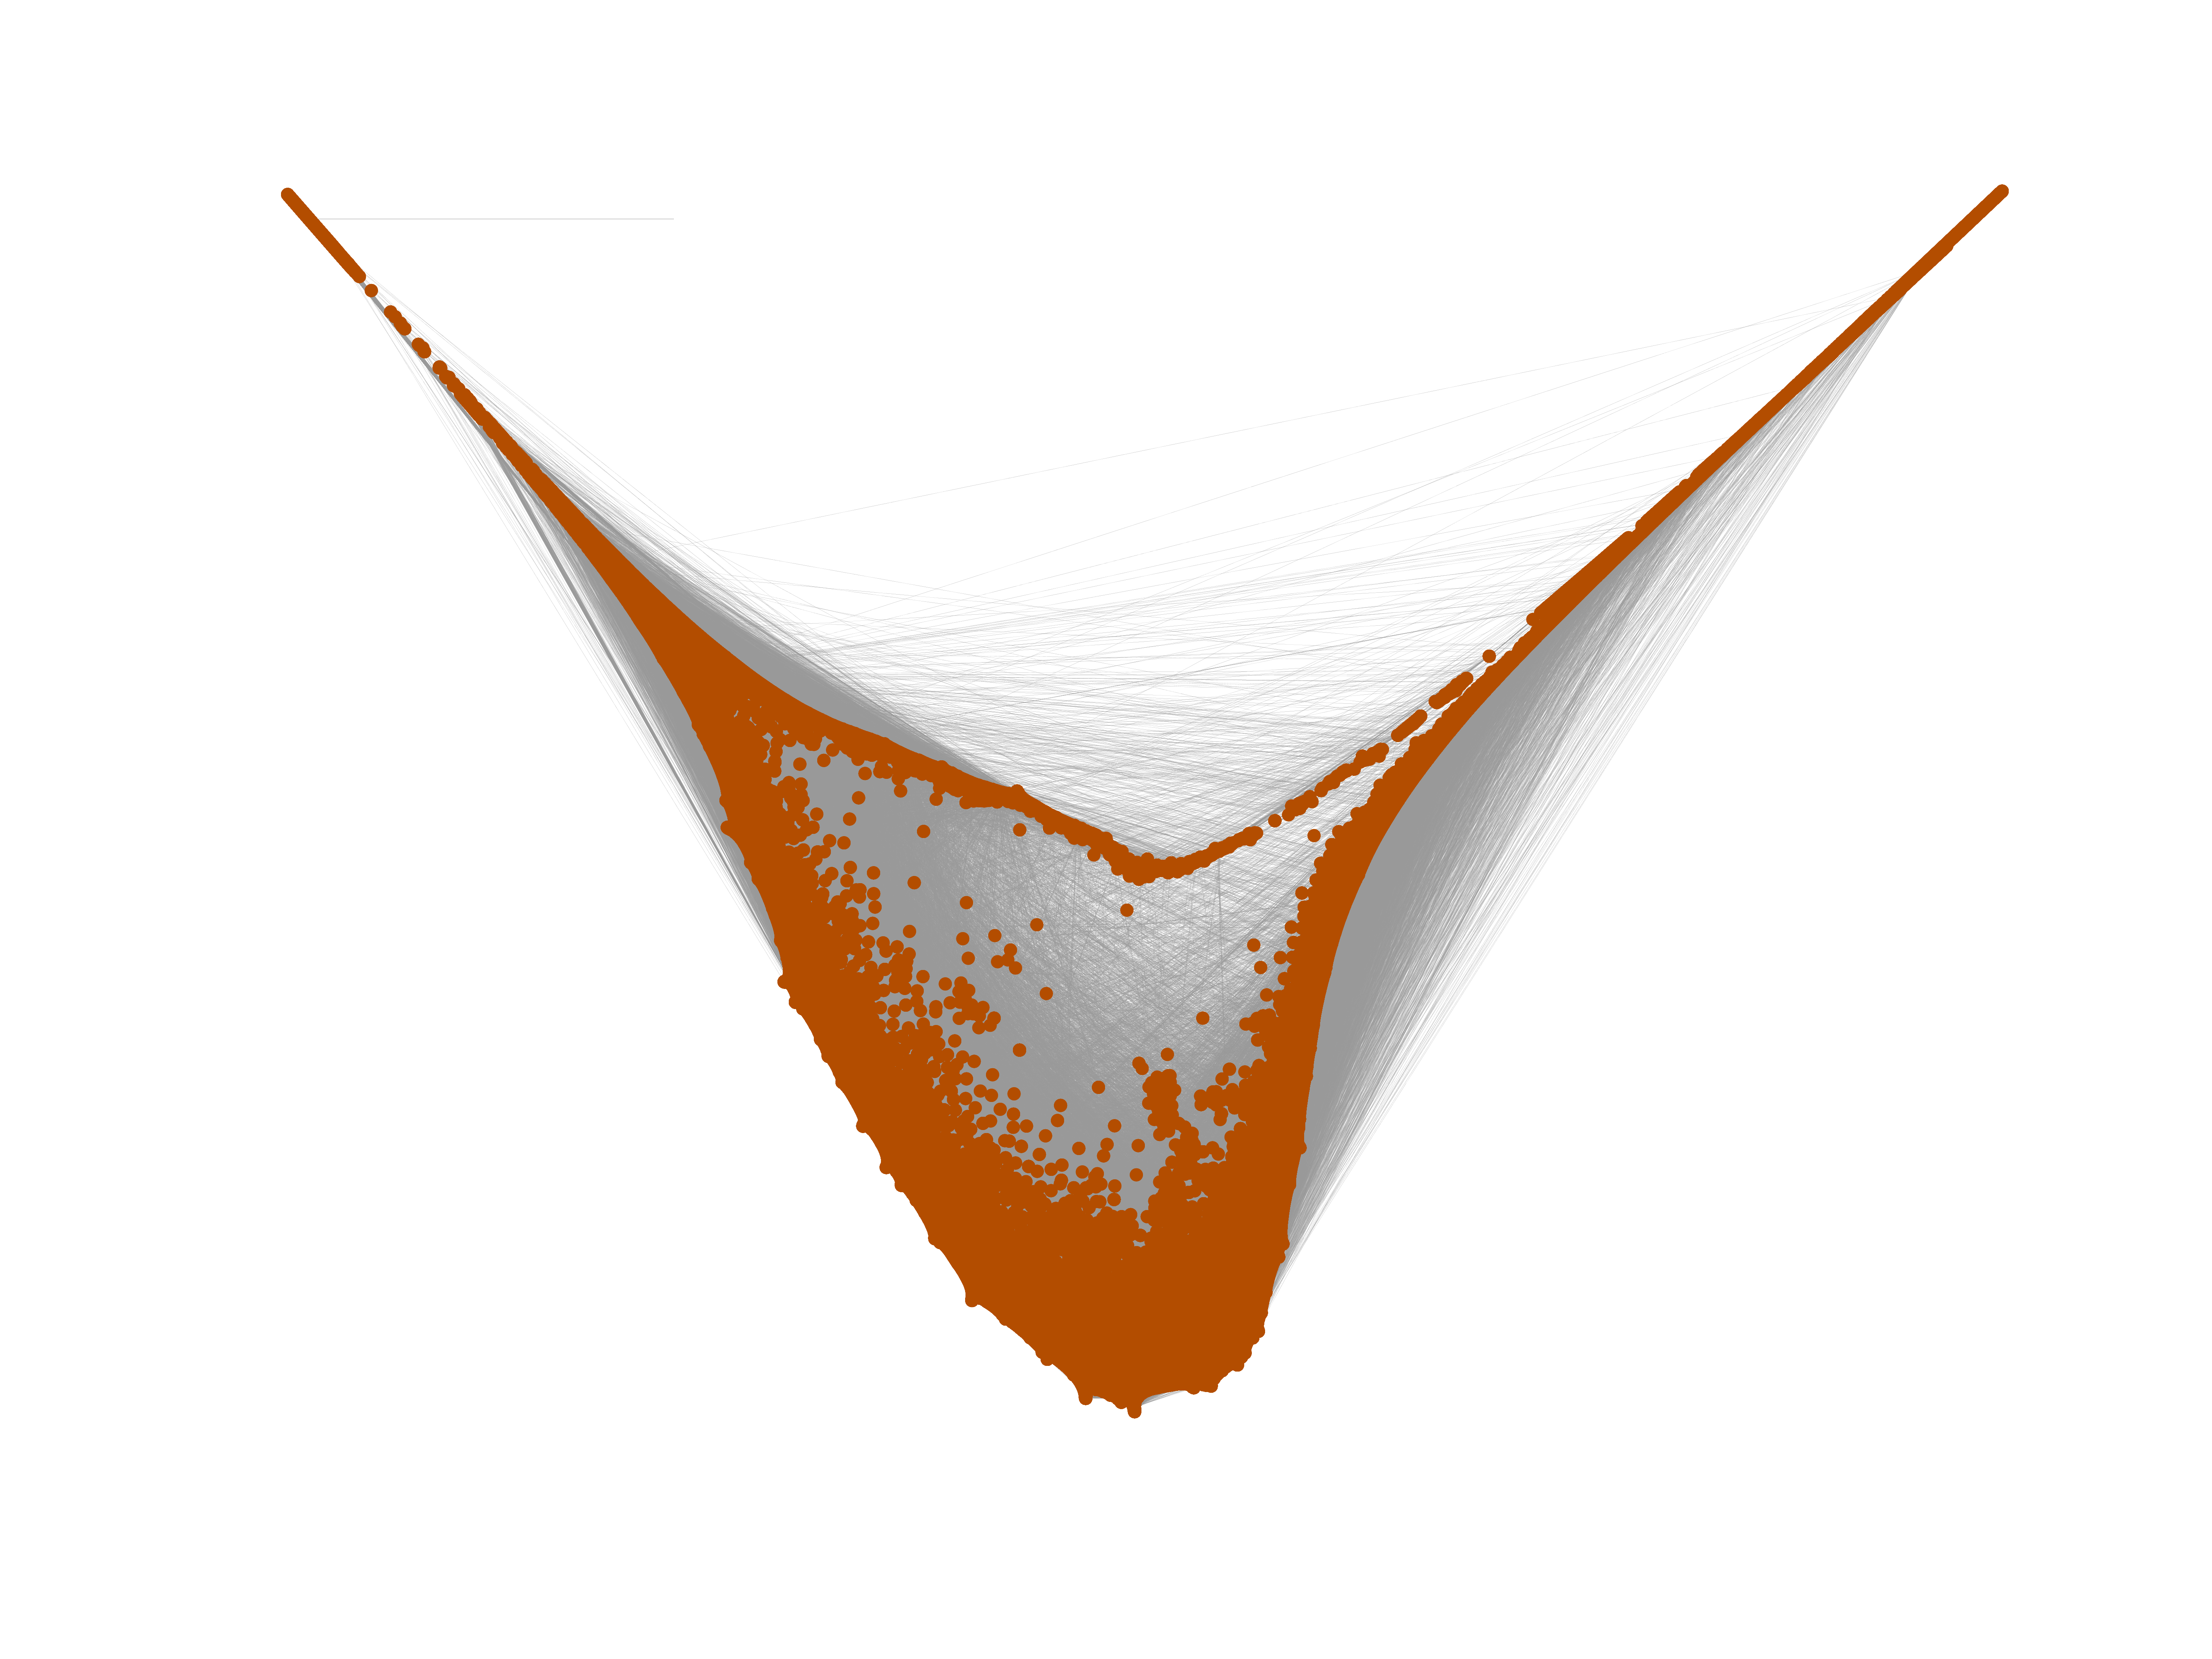
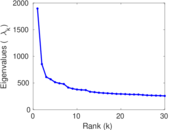
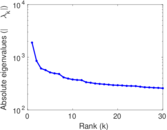
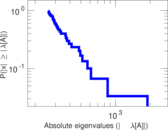
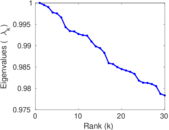
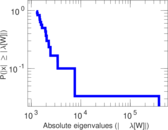
Matrix decompositions plots


Downloads
References
|
[1]
|
Jérôme Kunegis.
KONECT – The Koblenz Network Collection.
In Proc. Int. Conf. on World Wide Web Companion, pages
1343–1350, 2013.
[ http ]
|
|
[2]
|
Dirk Homscheid, Jérôme Kunegis, and Mario Schaarschmidt.
Private-collective invention and open source software: Longitudinal
insights from Linux kernel development.
In Proc. IFIP Conf. on e-Business, e-Services and e-Society,
pages 299–313, 2015.
[ http ]
|
 KONECT ‣ Networks ‣
Buy Me a Coffee
KONECT ‣ Networks ‣
Buy Me a Coffee