Dutch college

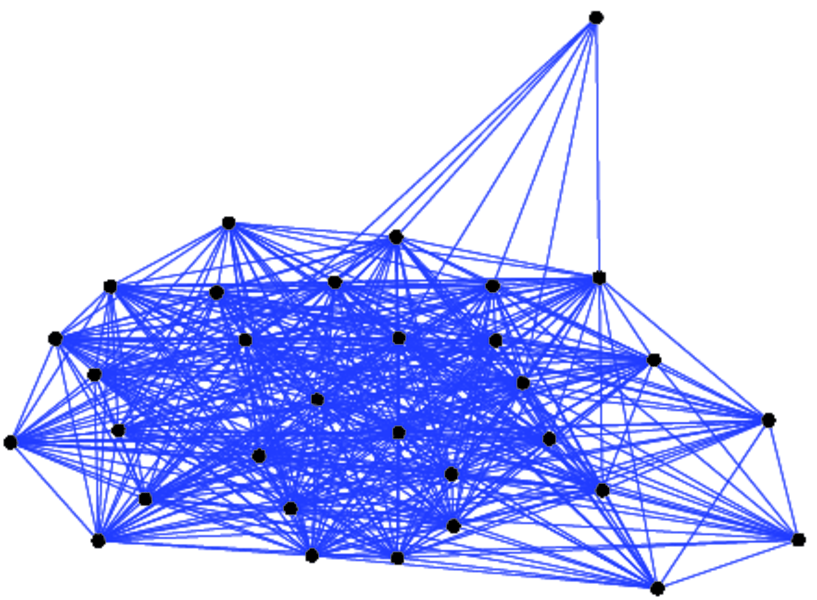
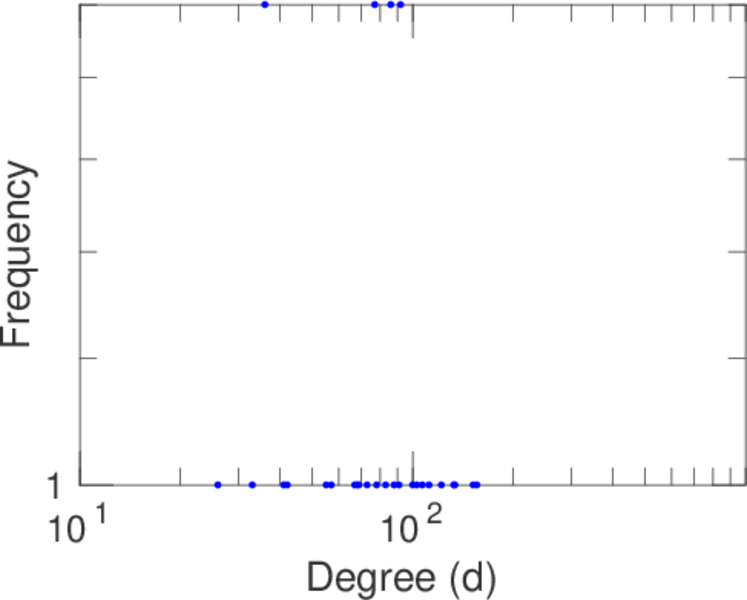
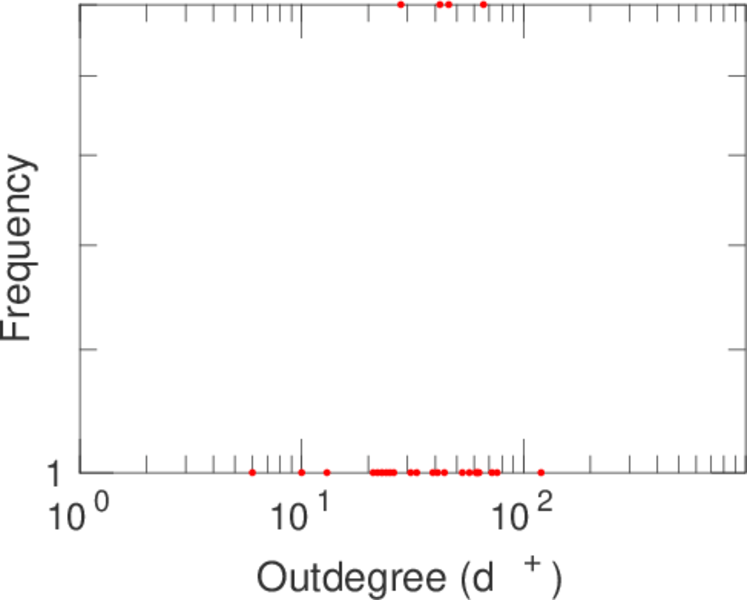
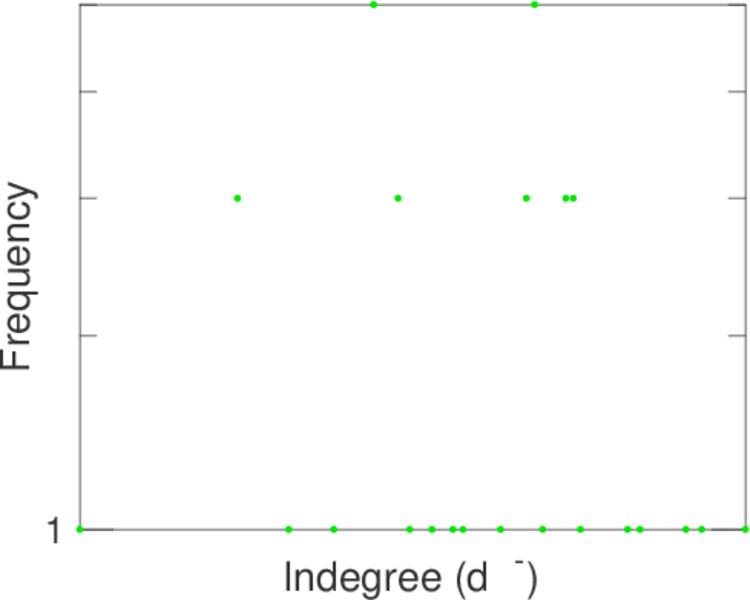
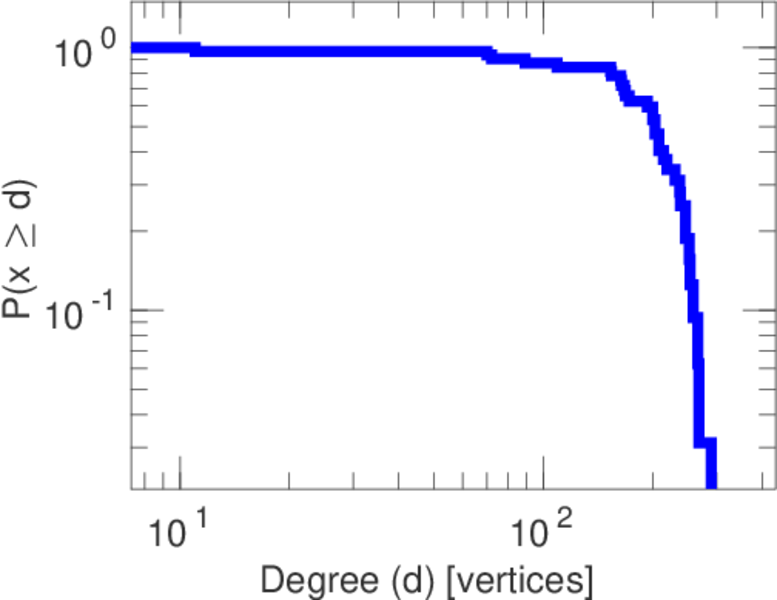
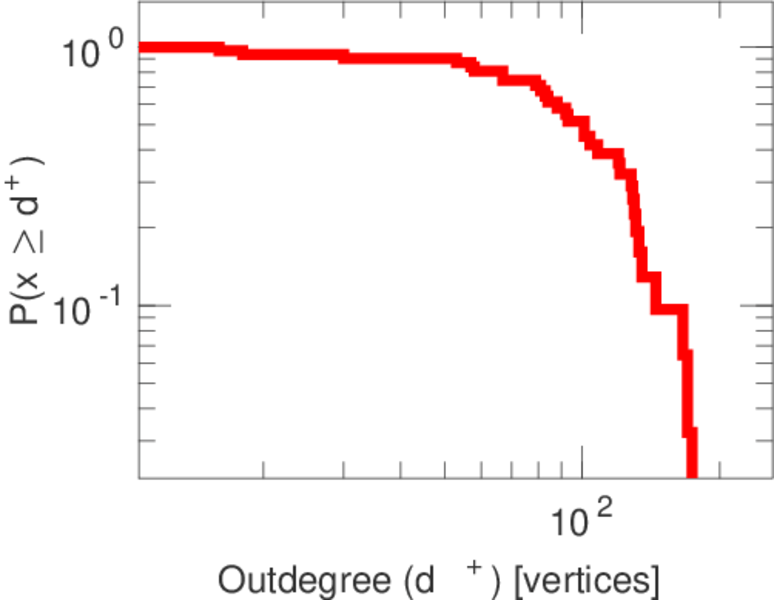
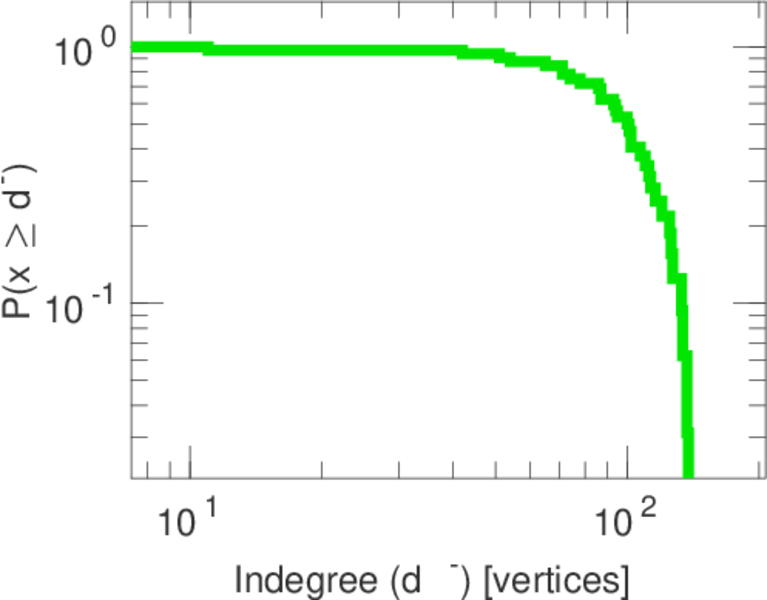
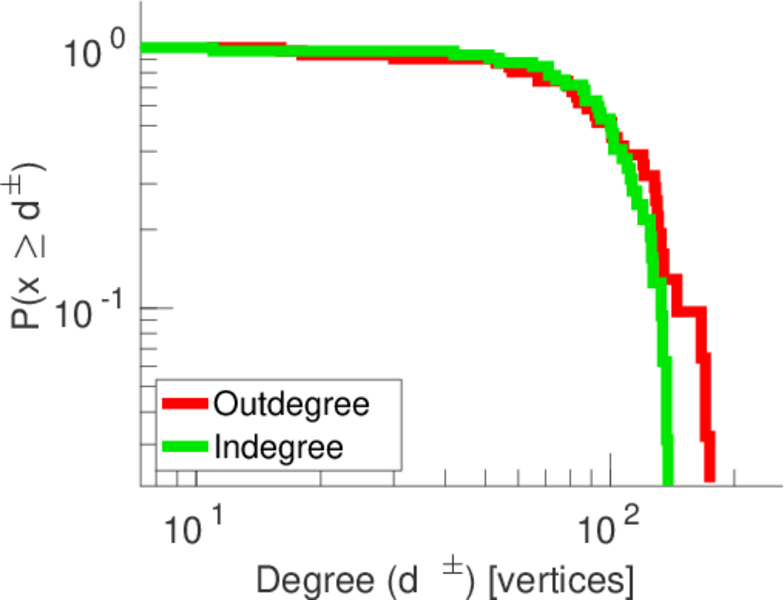
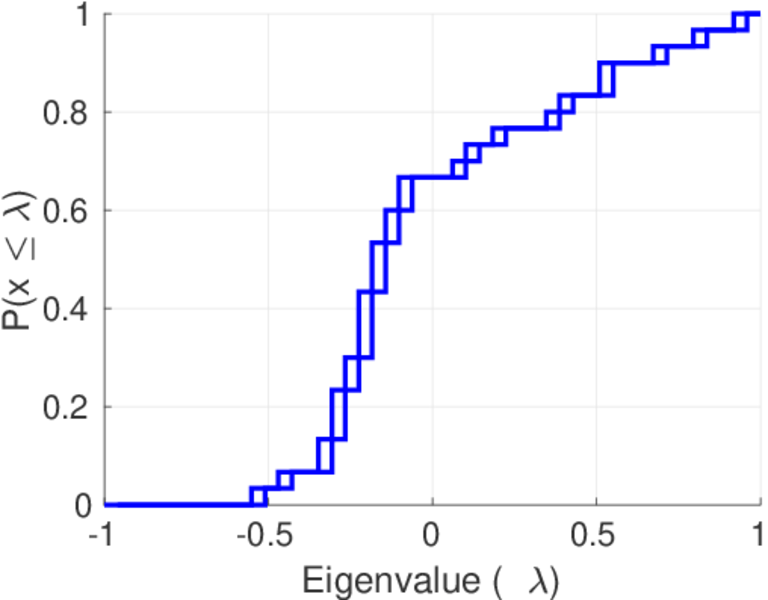
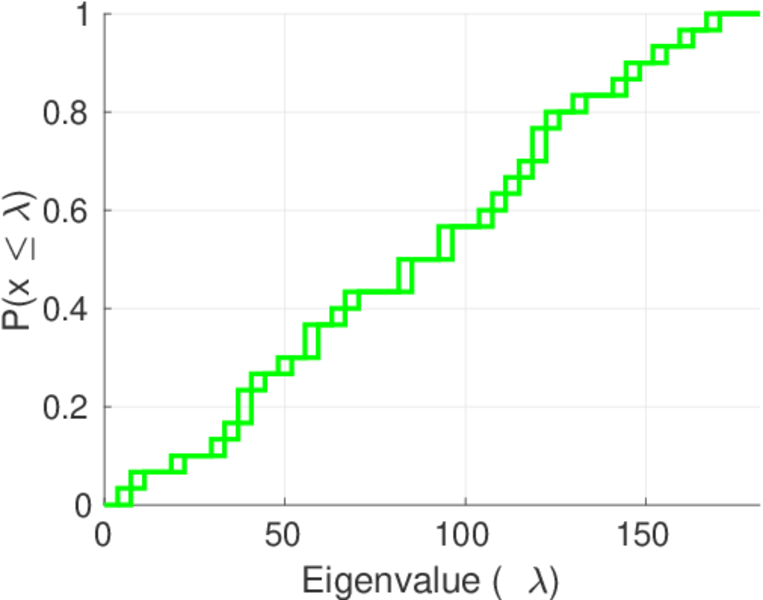
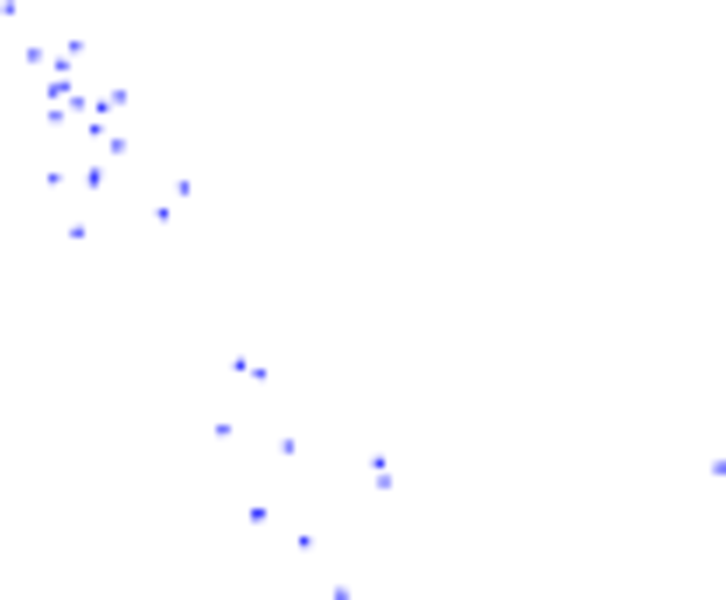
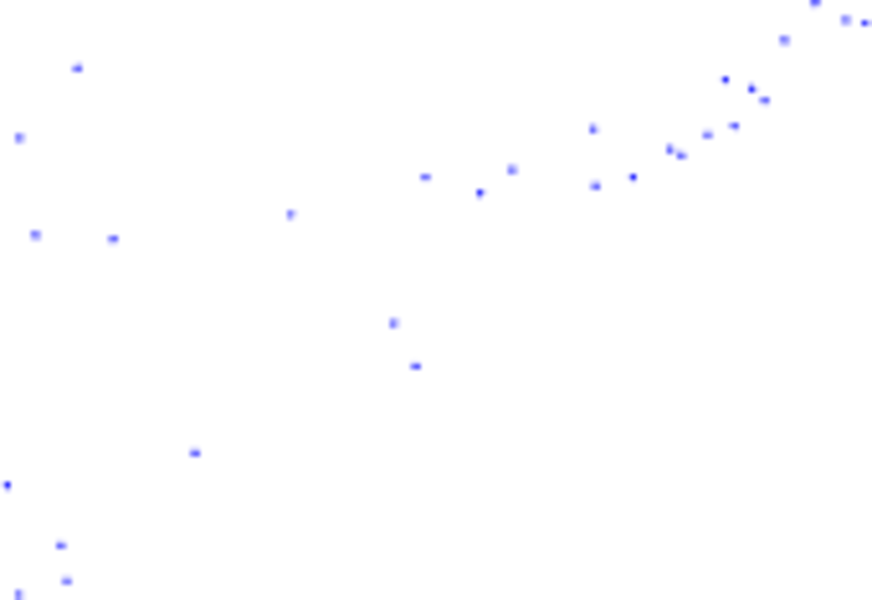
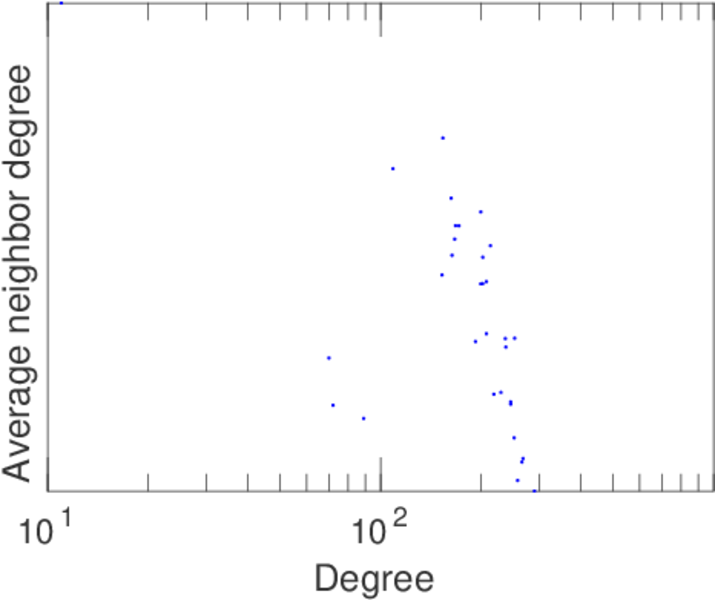
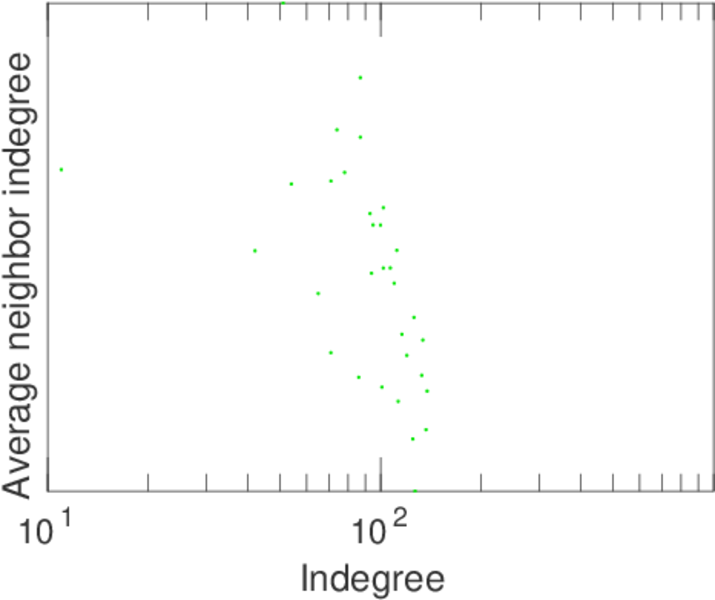
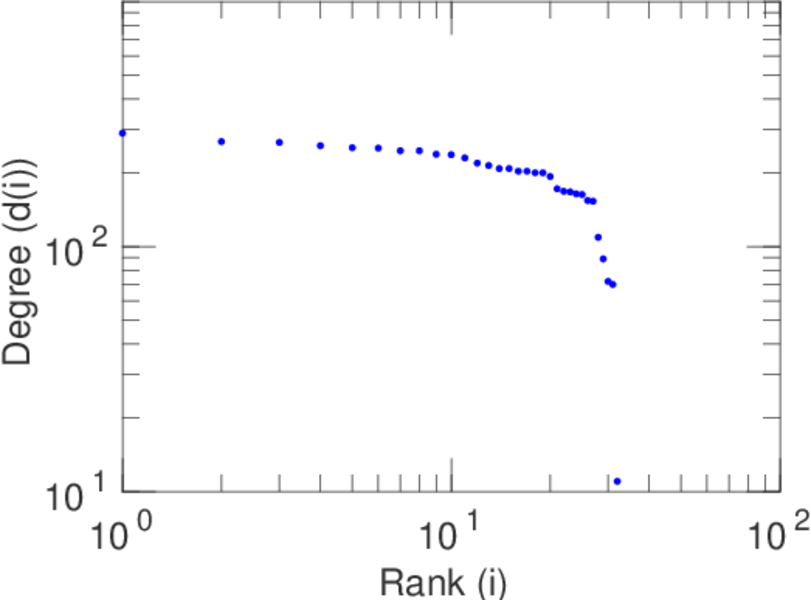
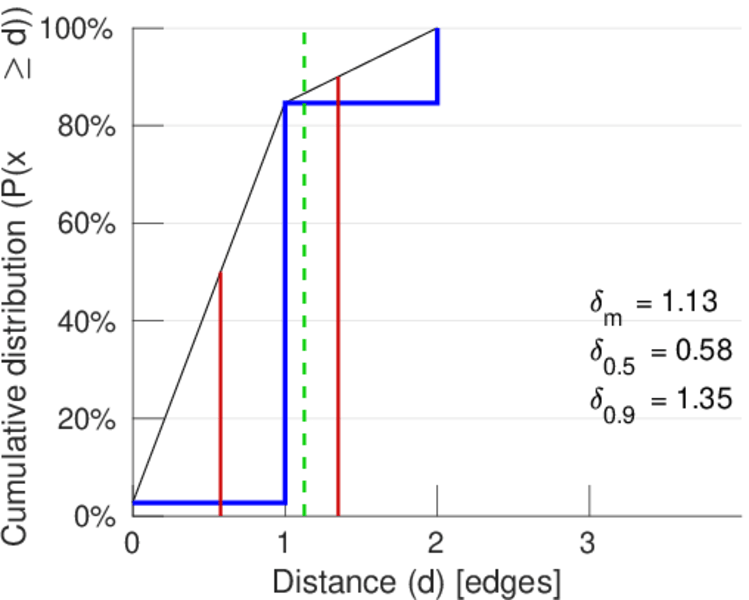
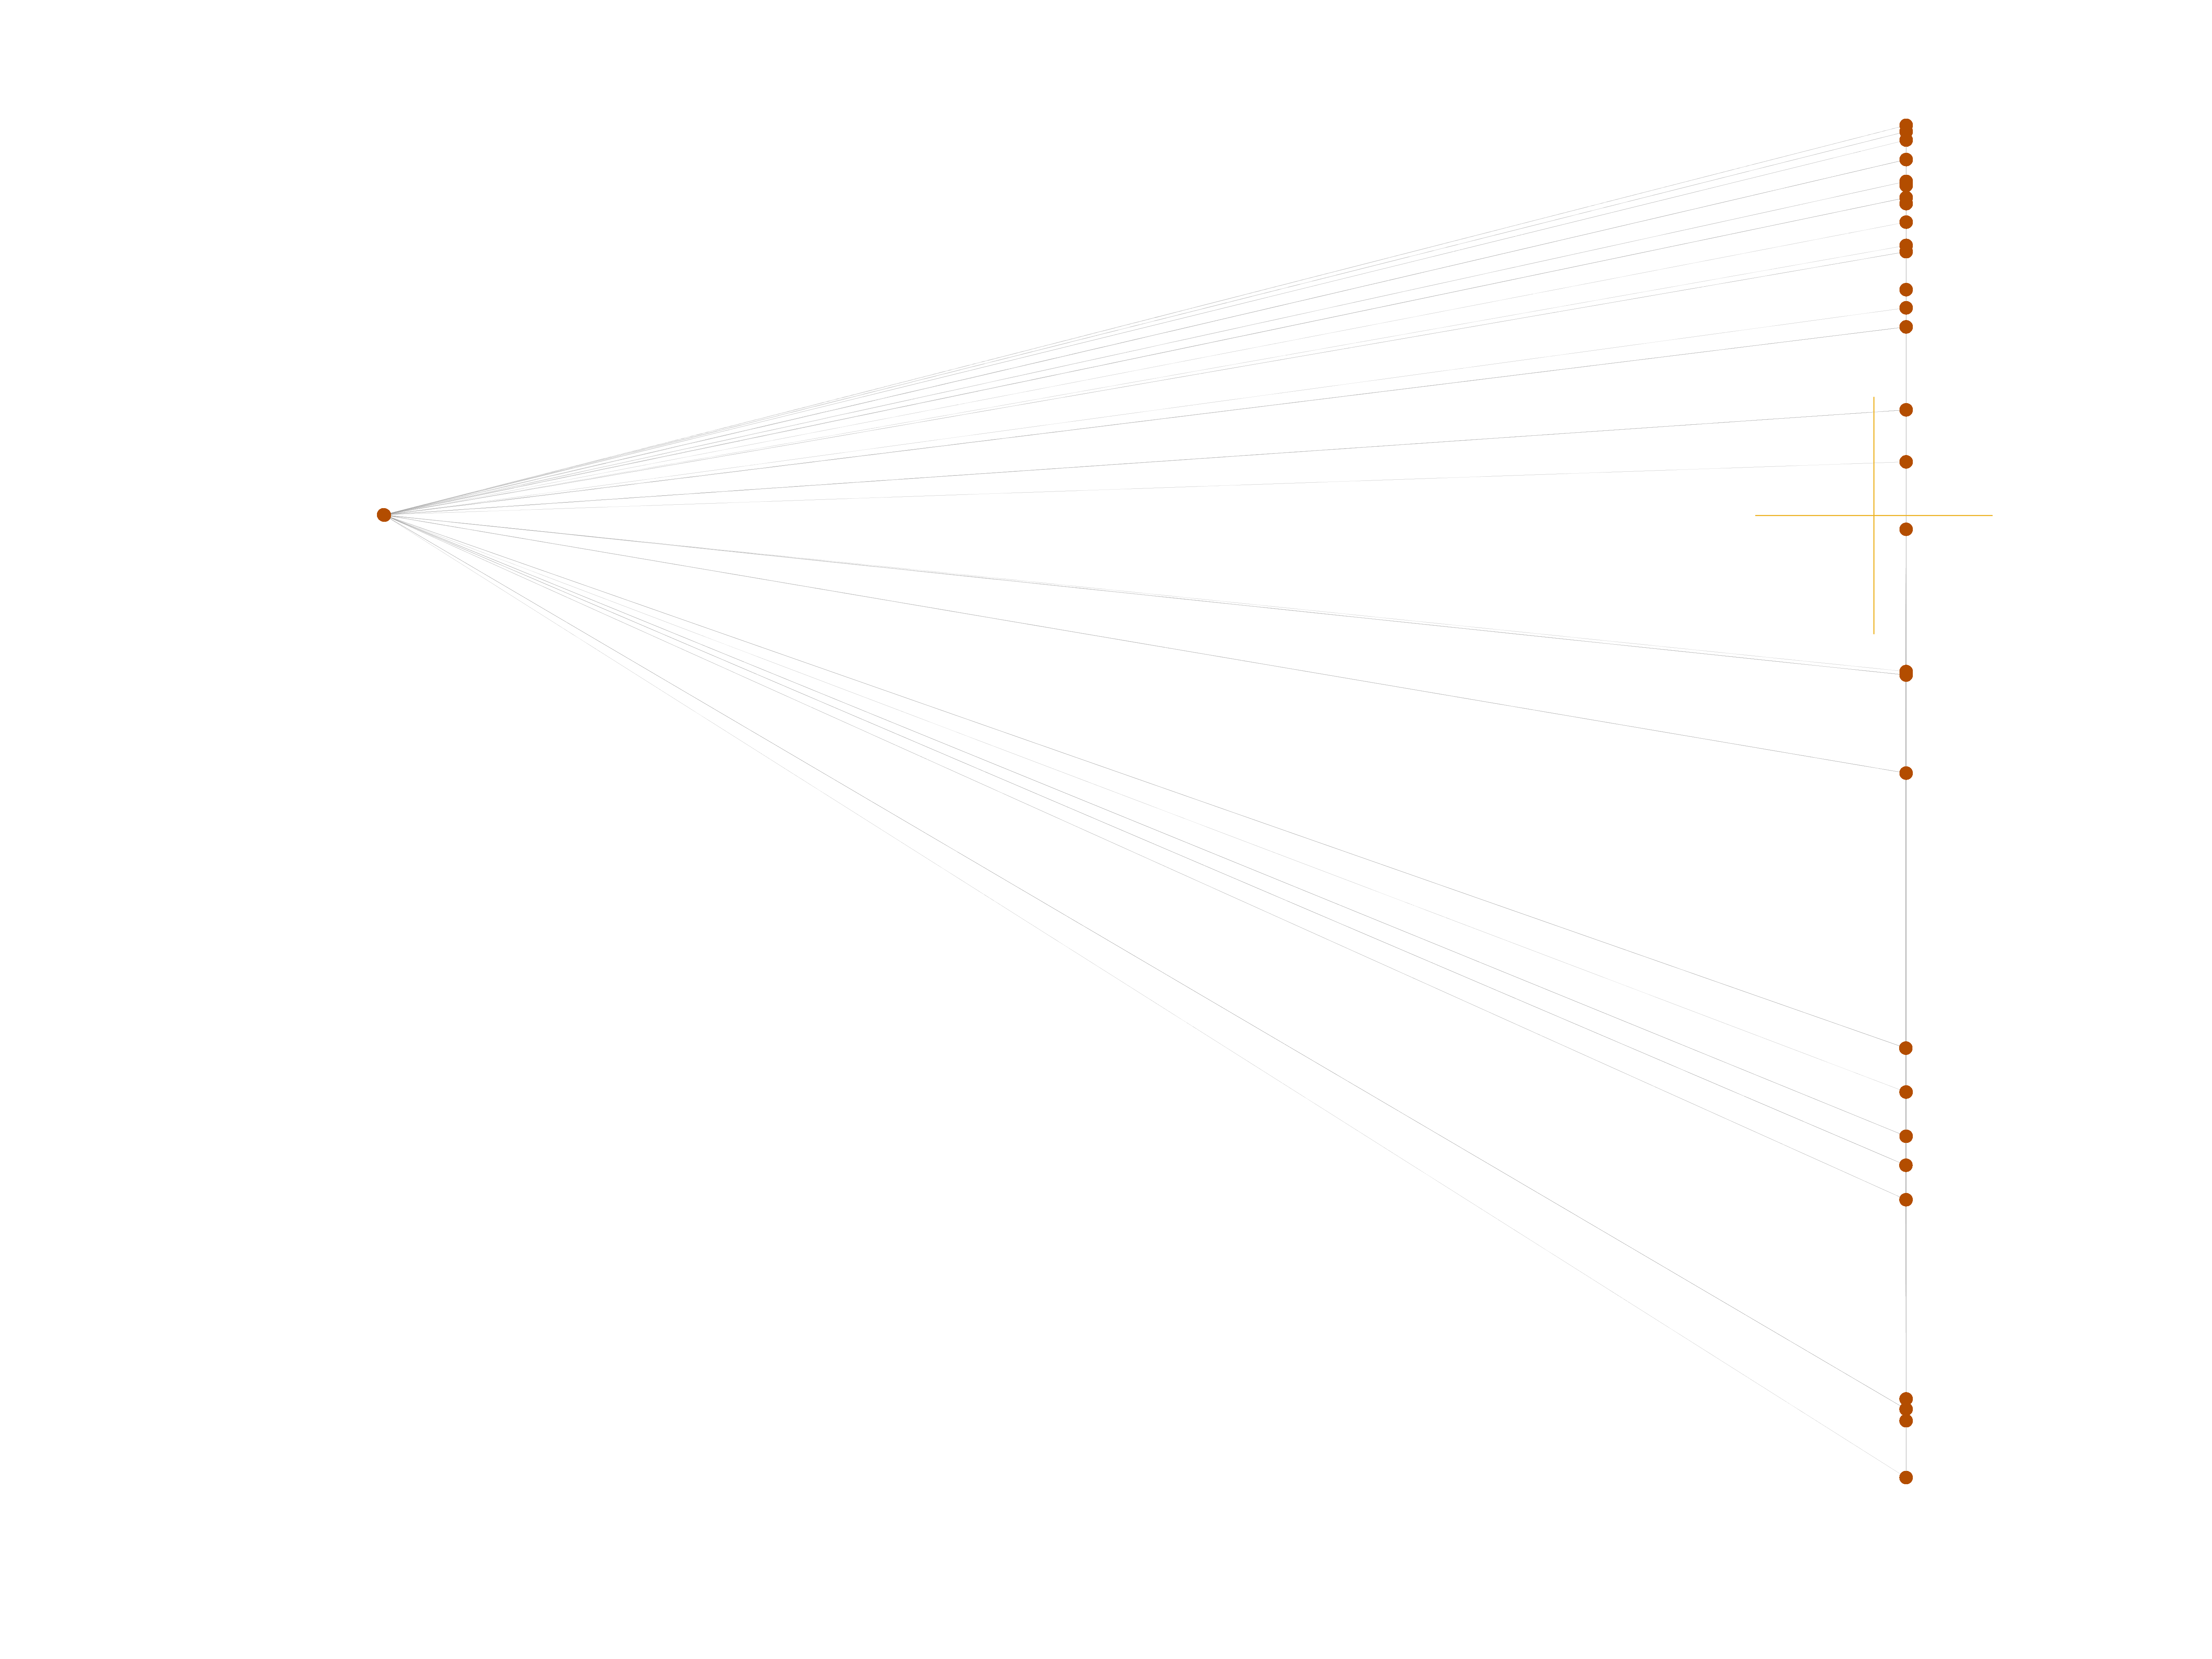
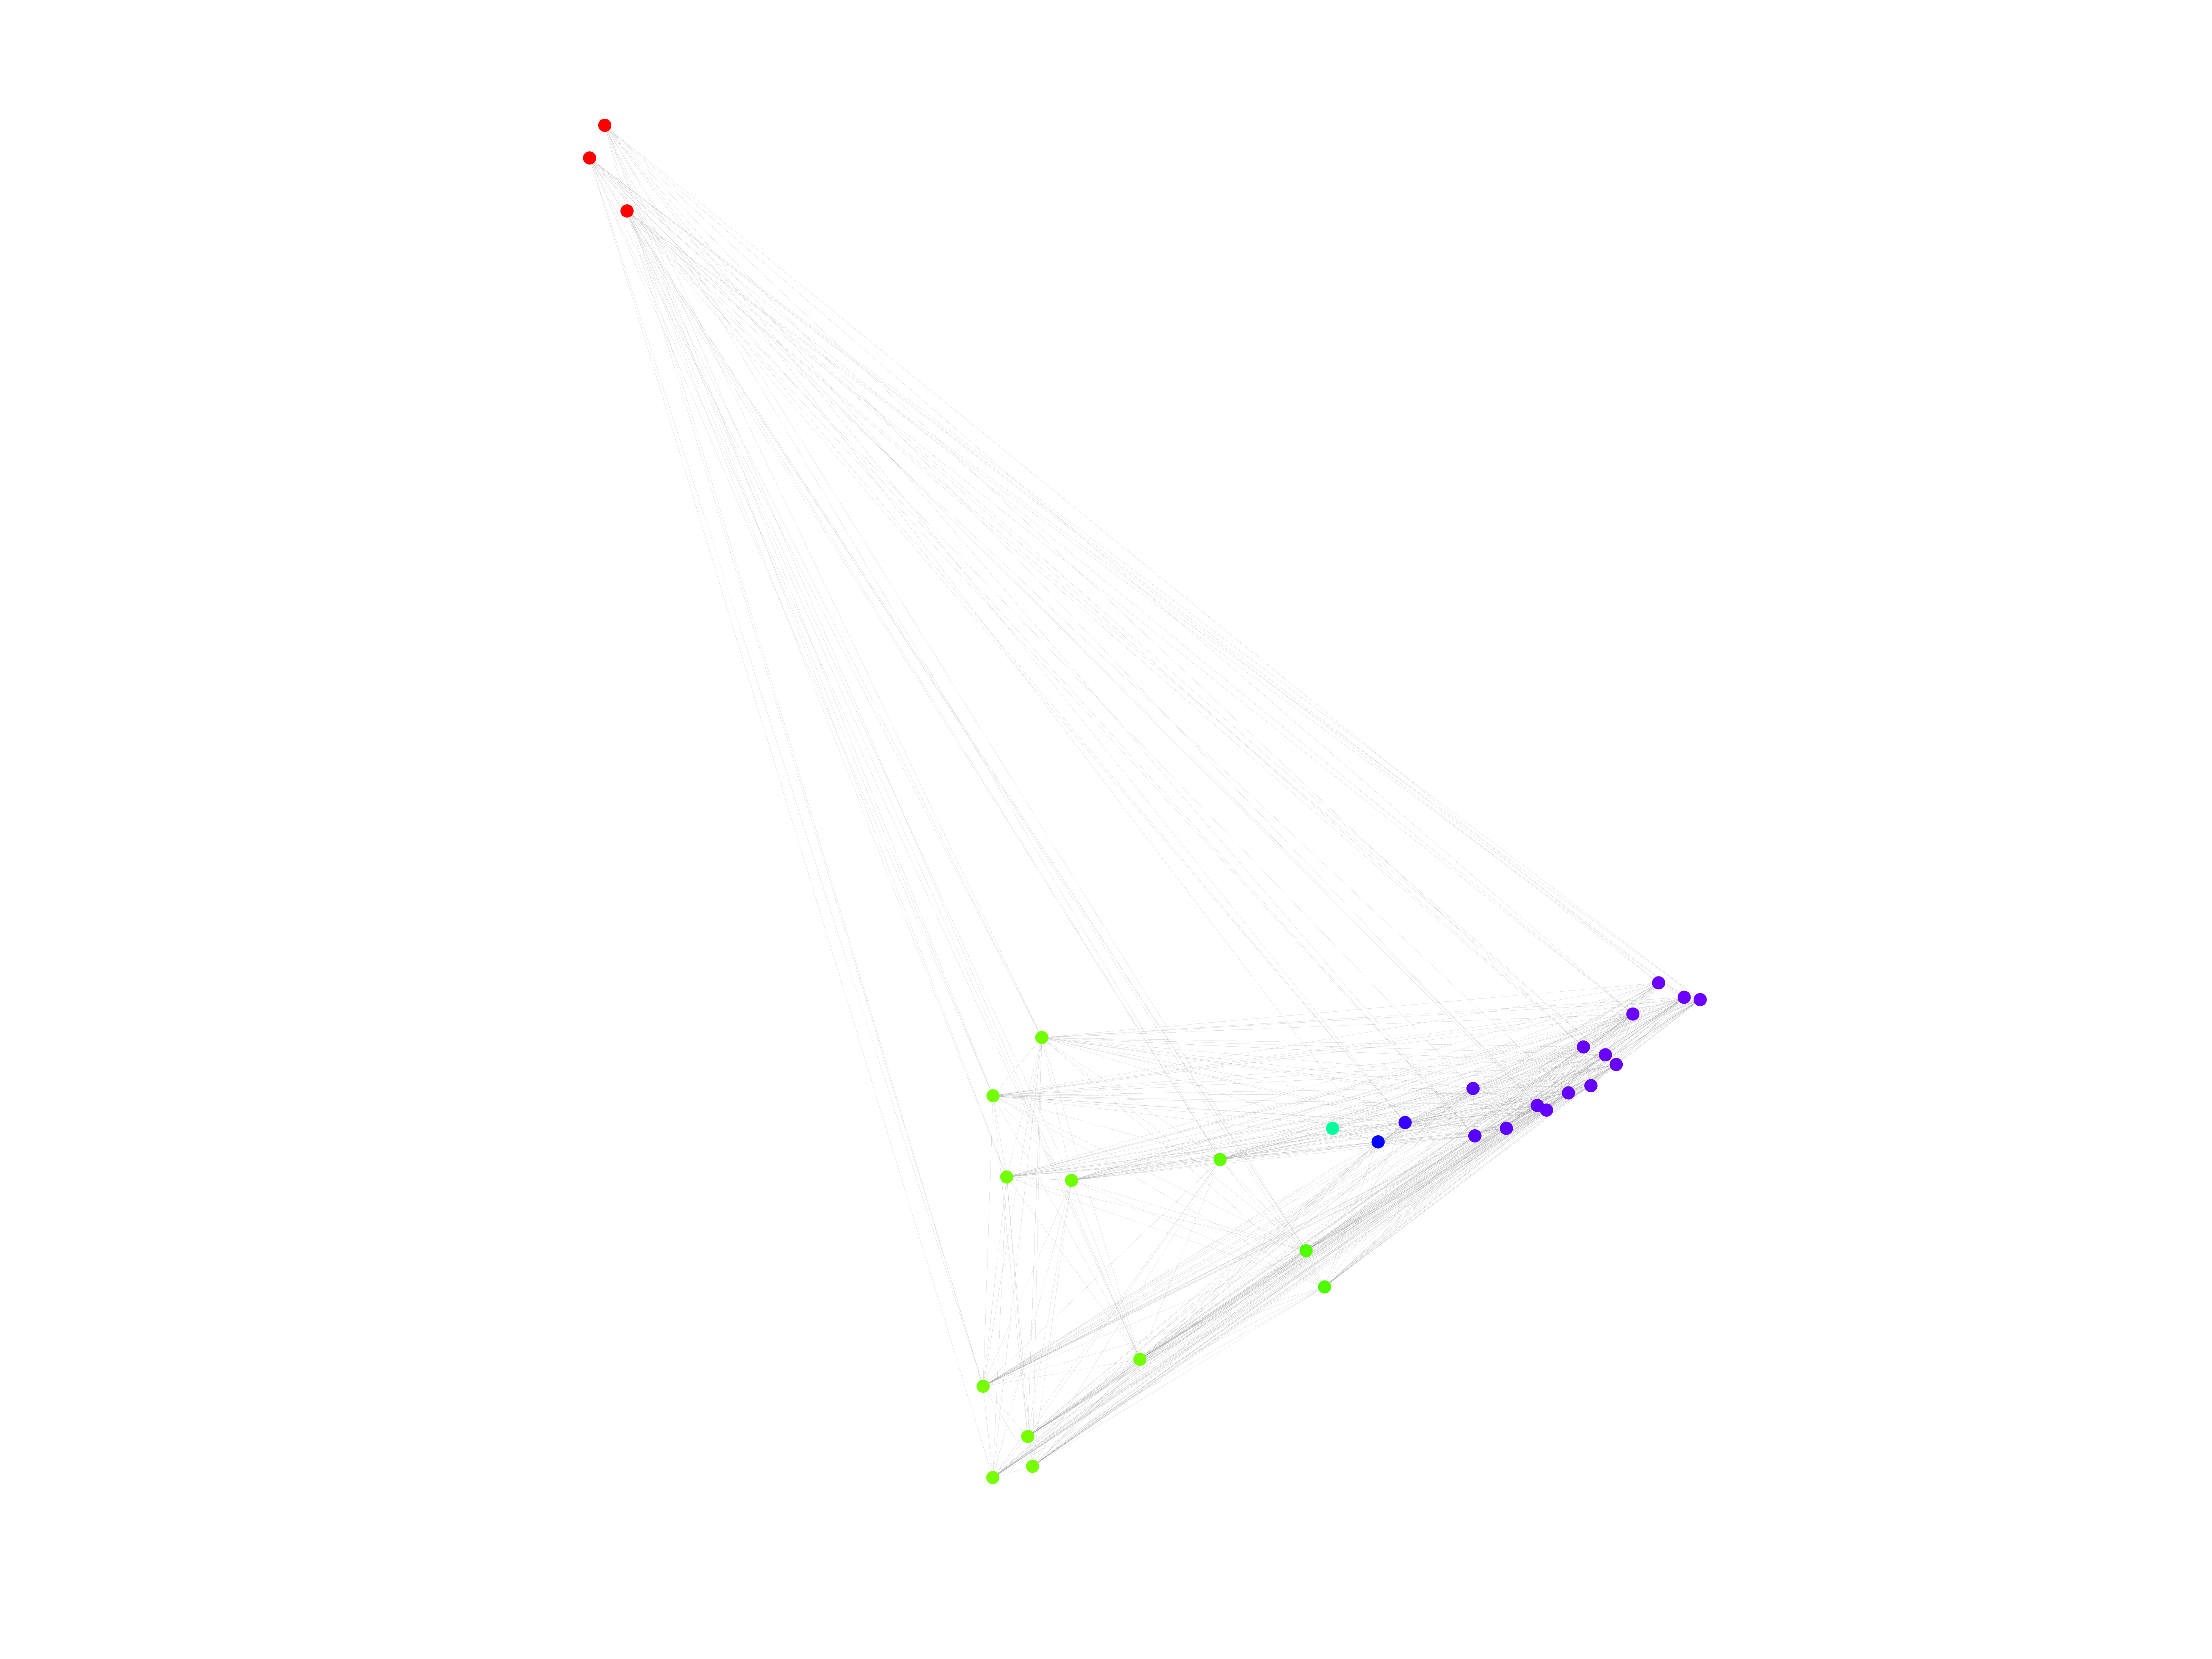
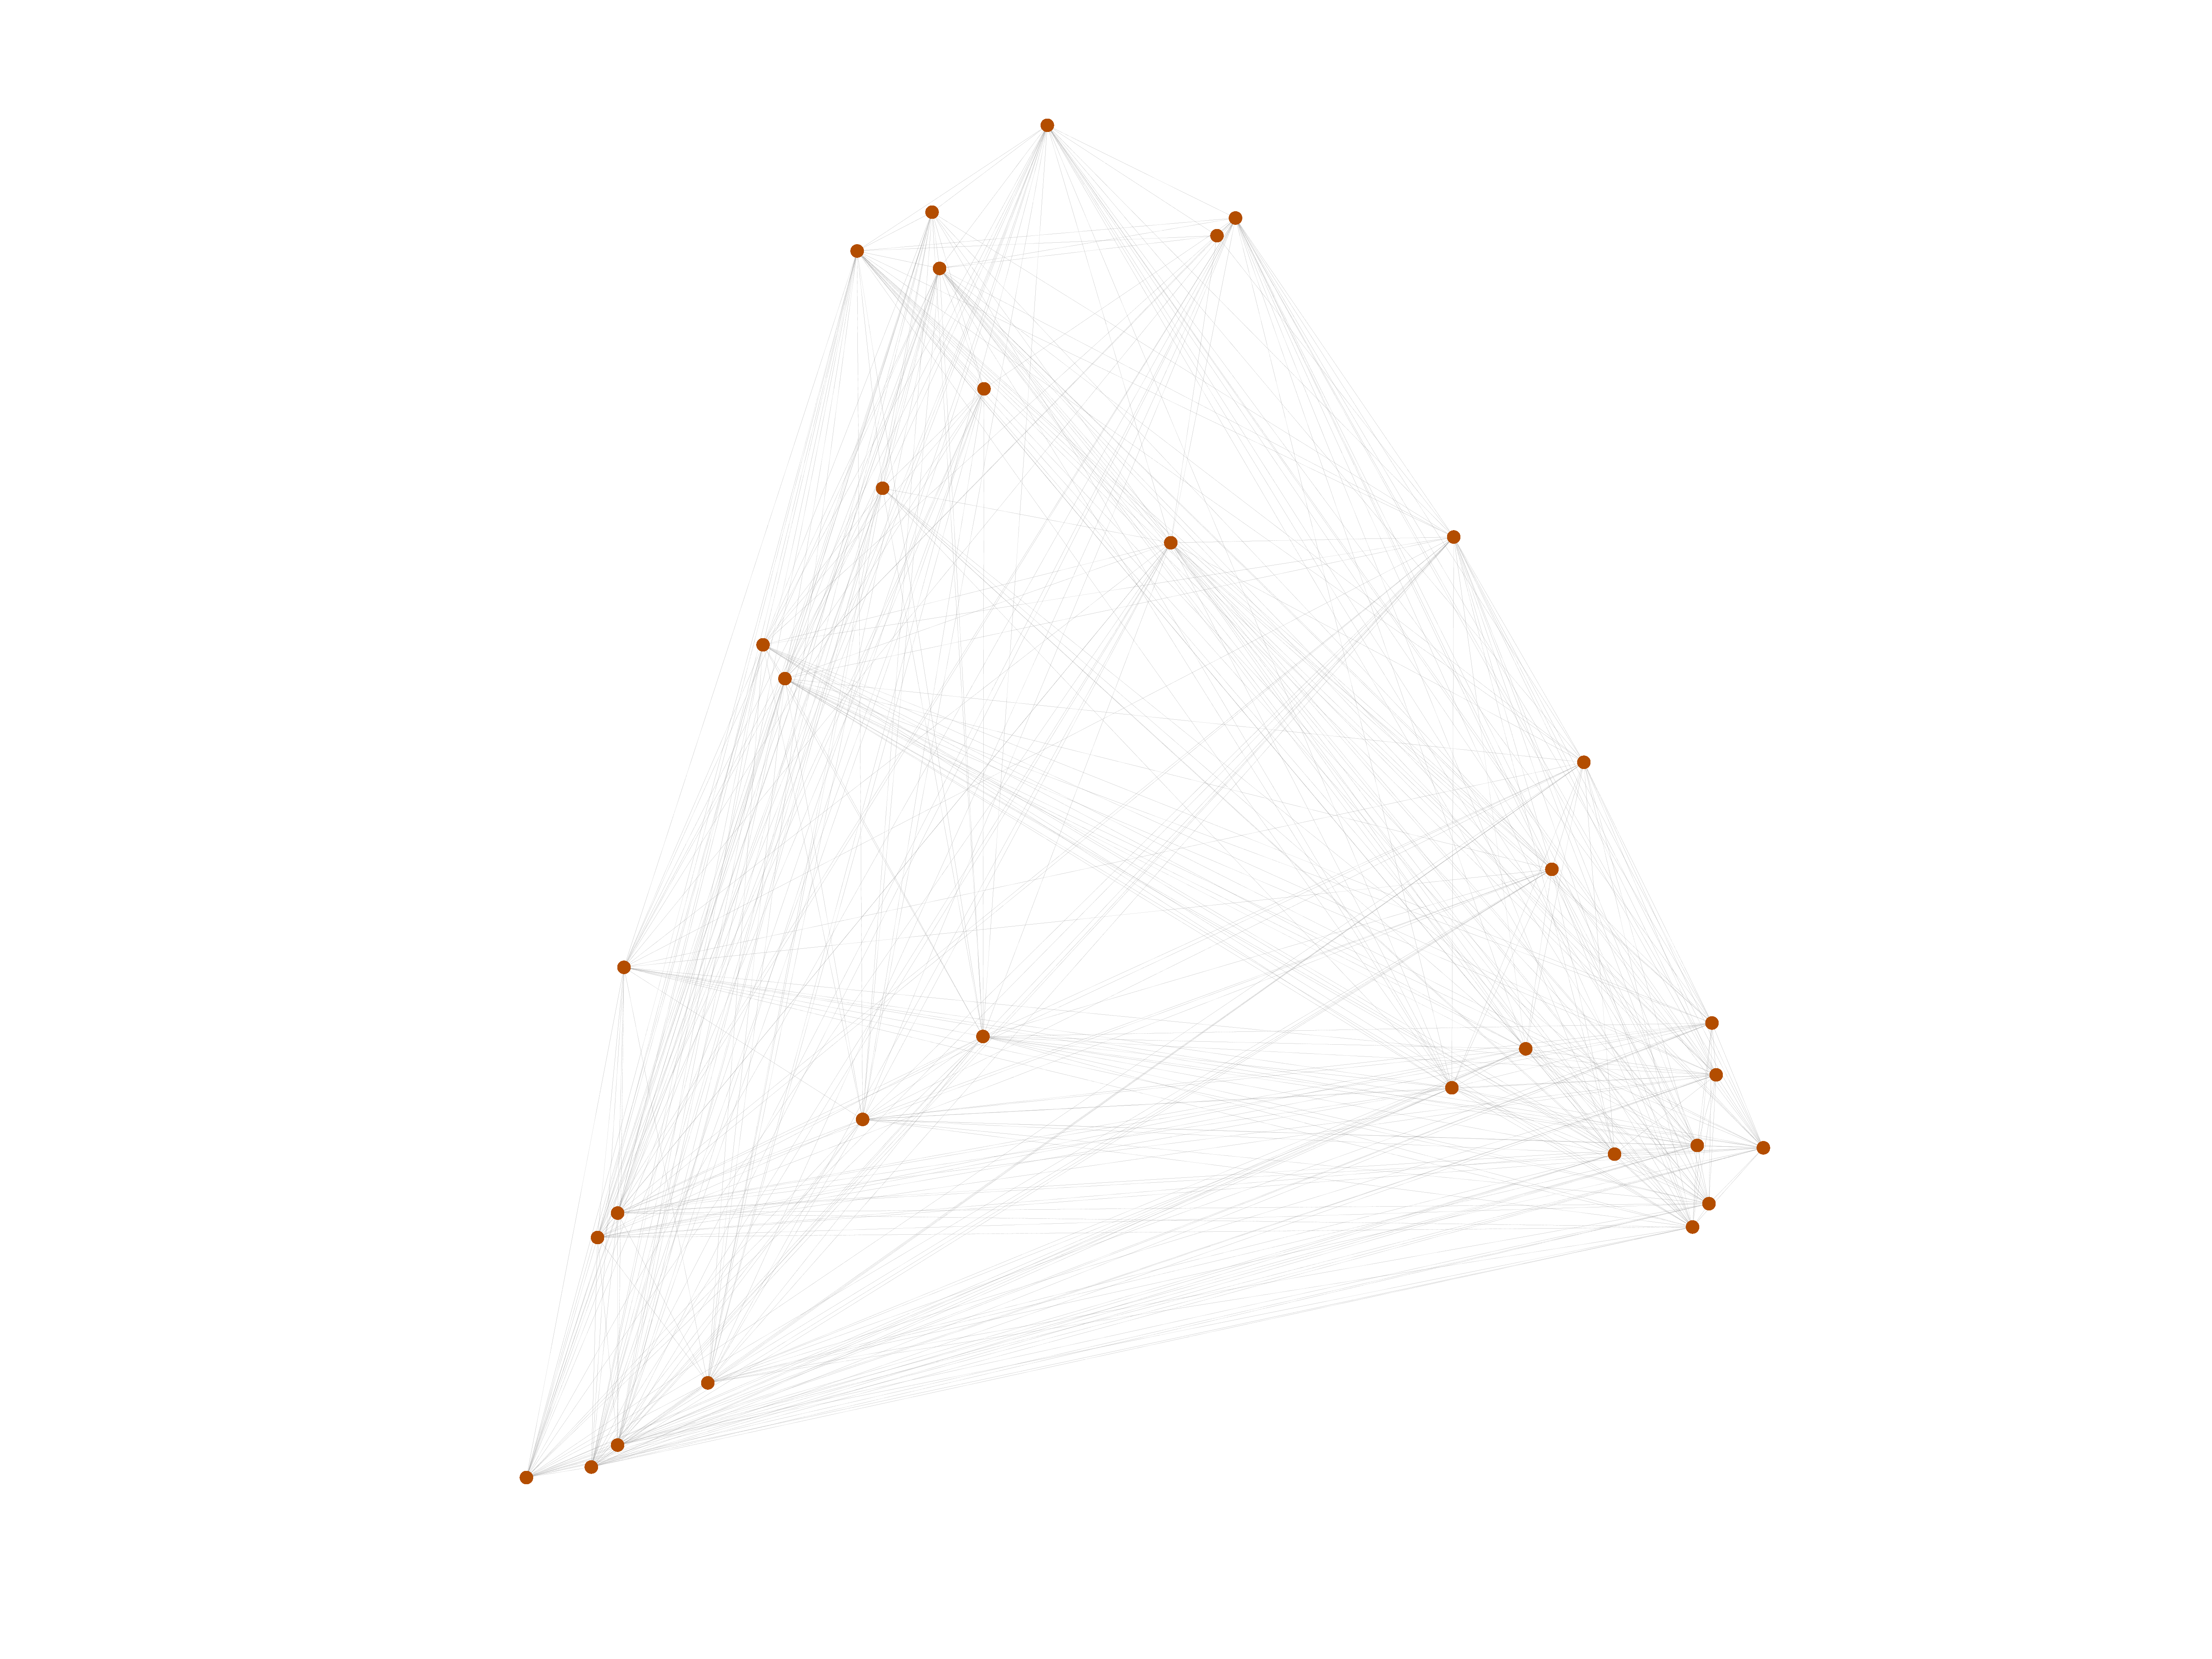
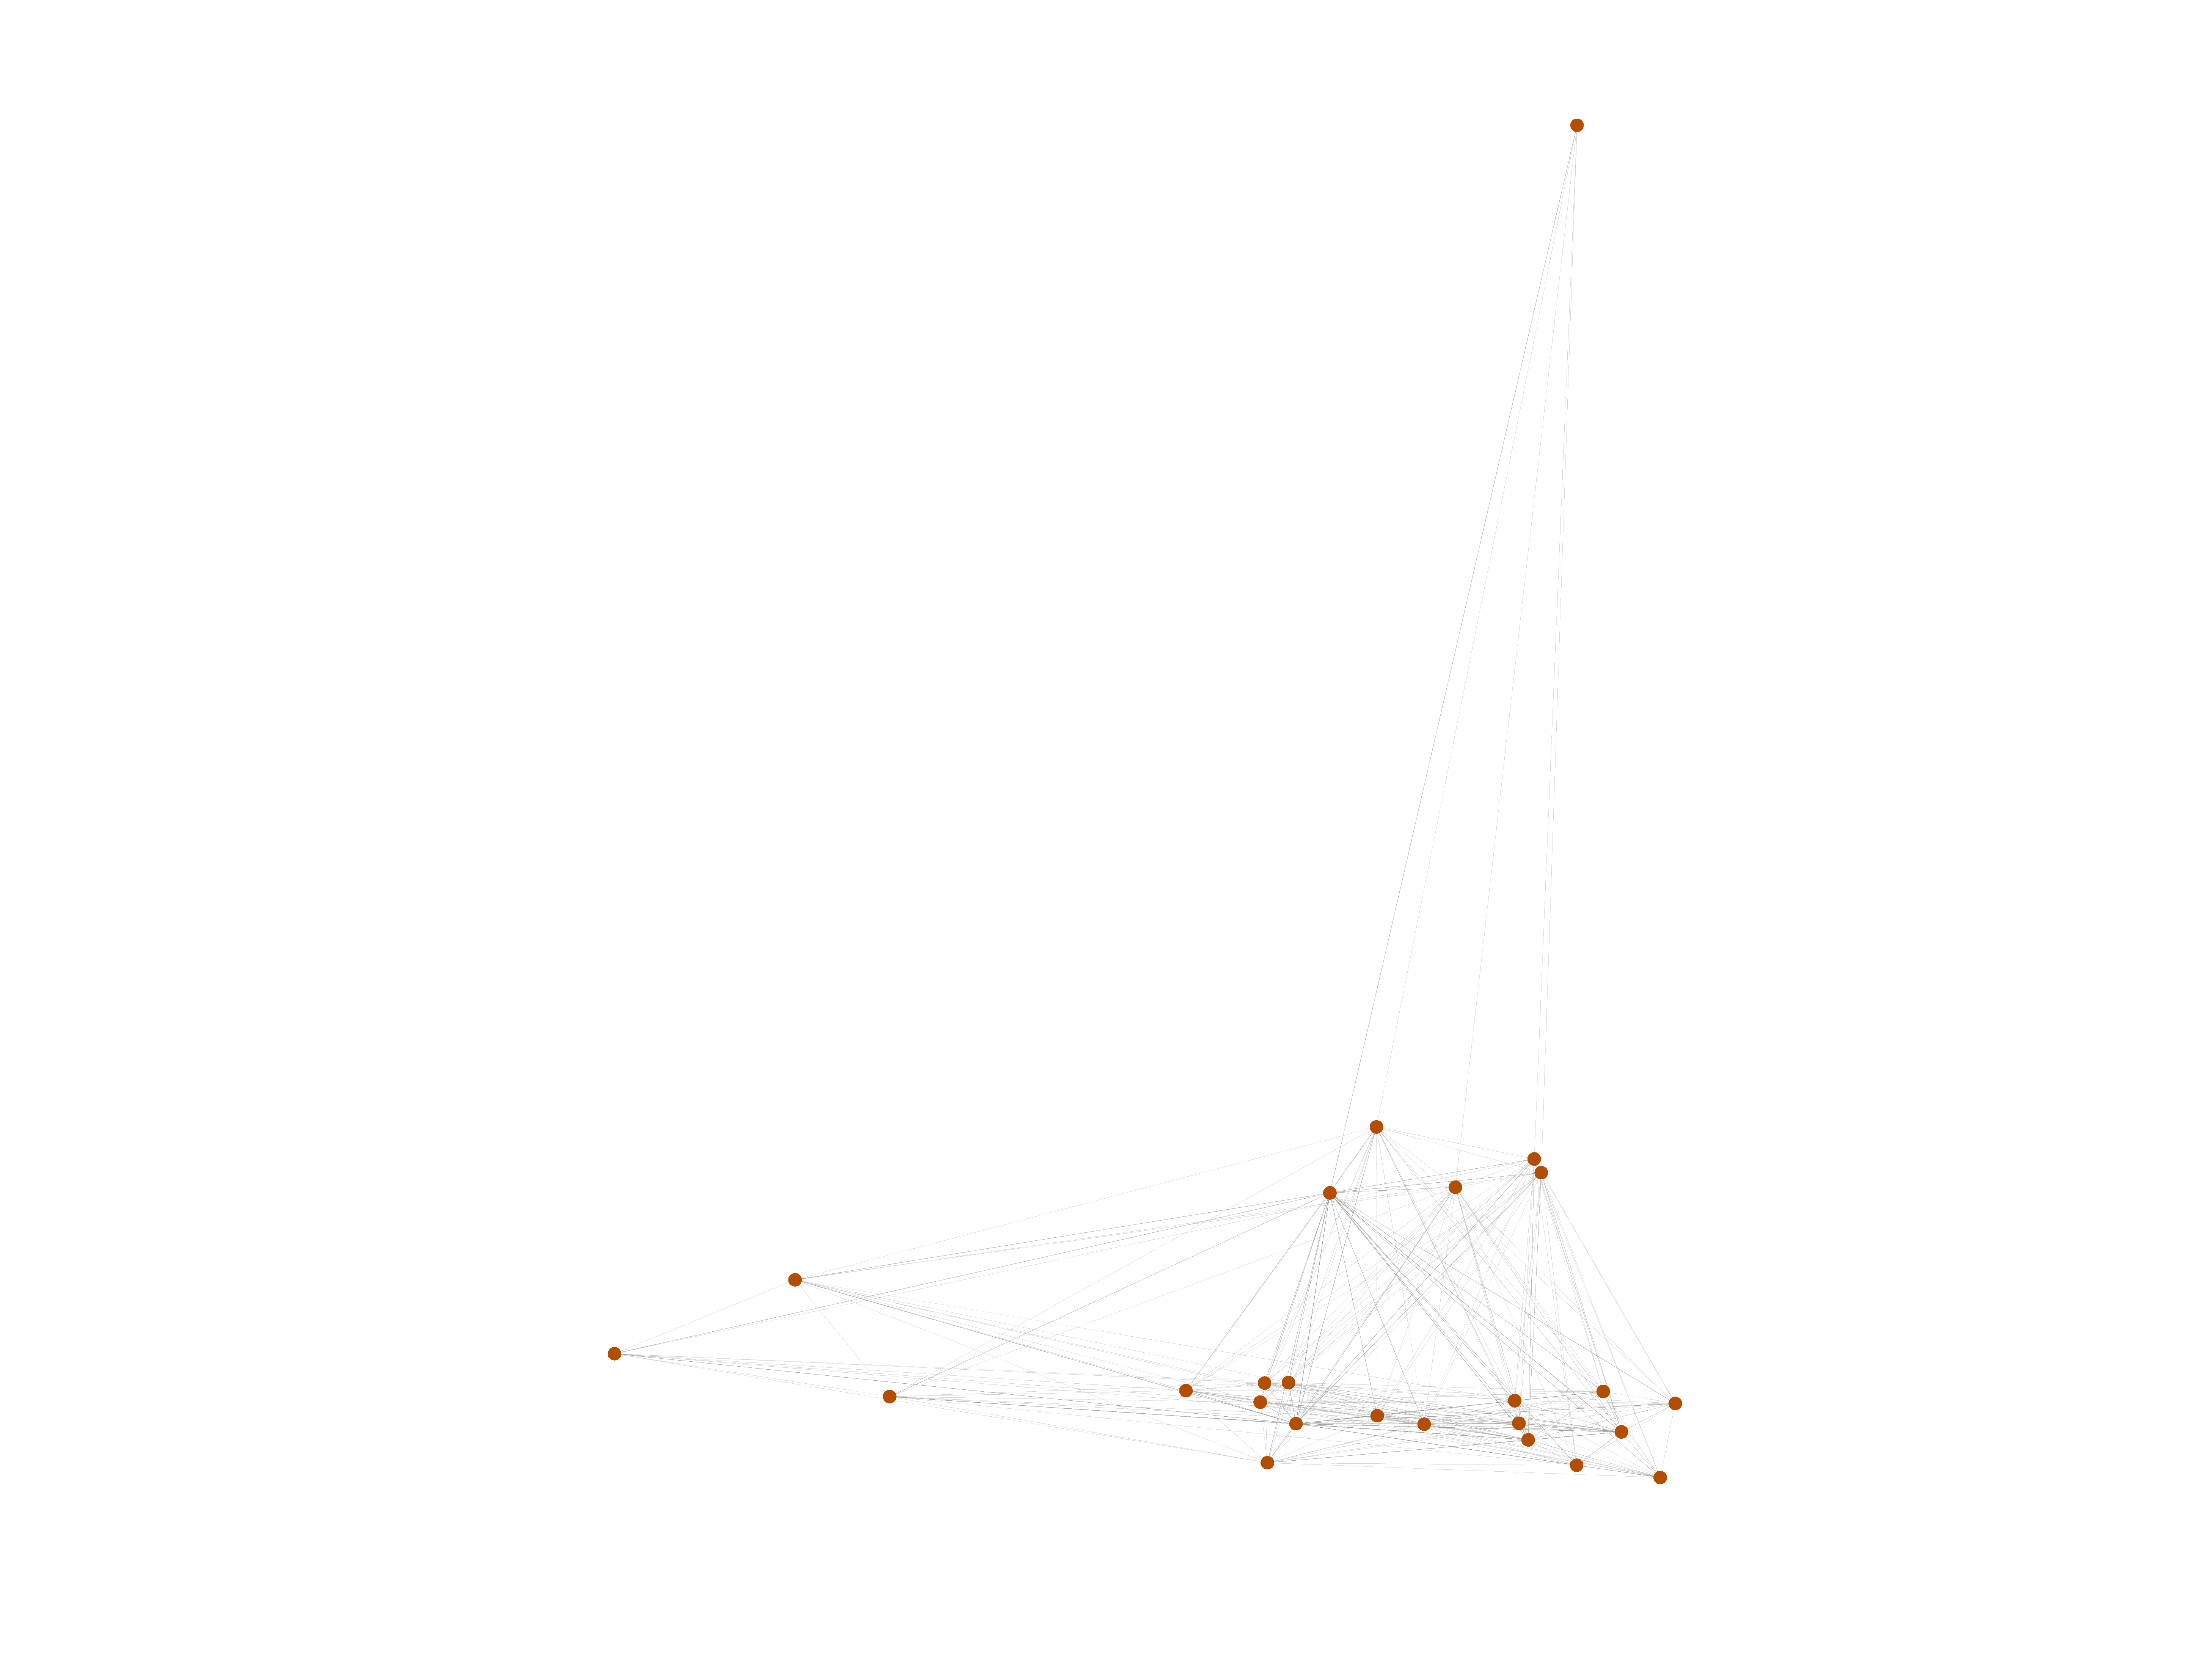
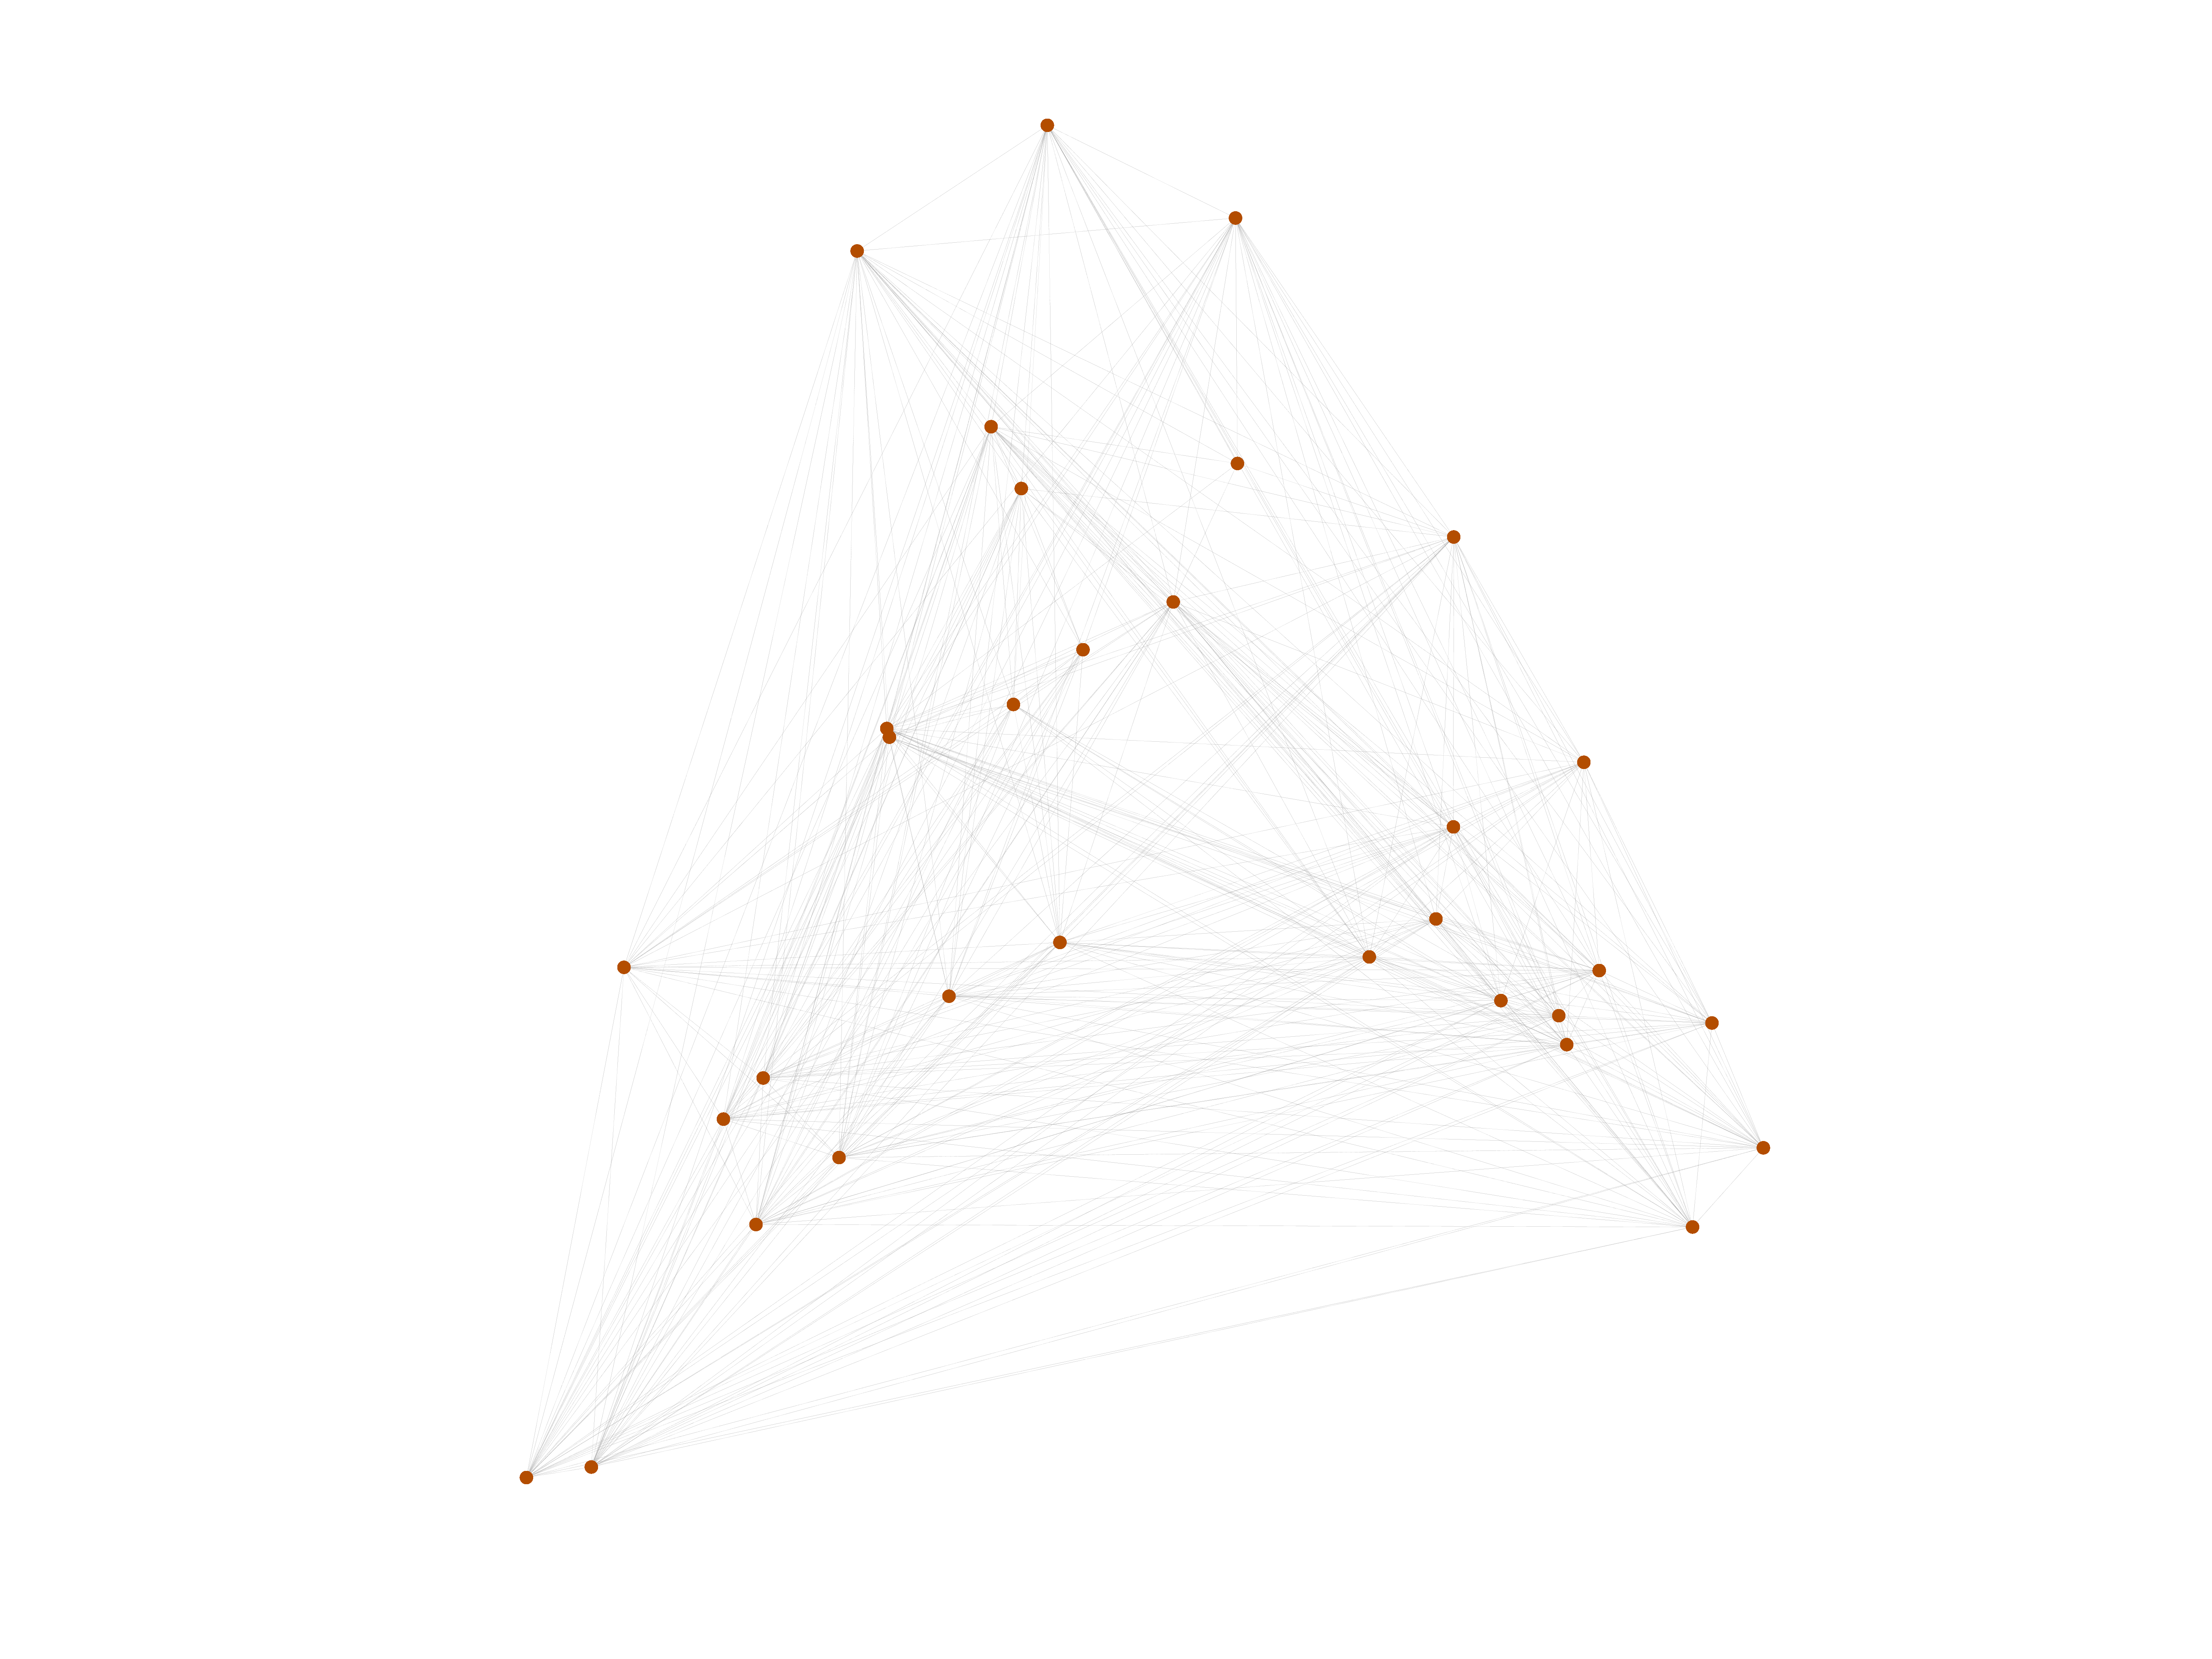
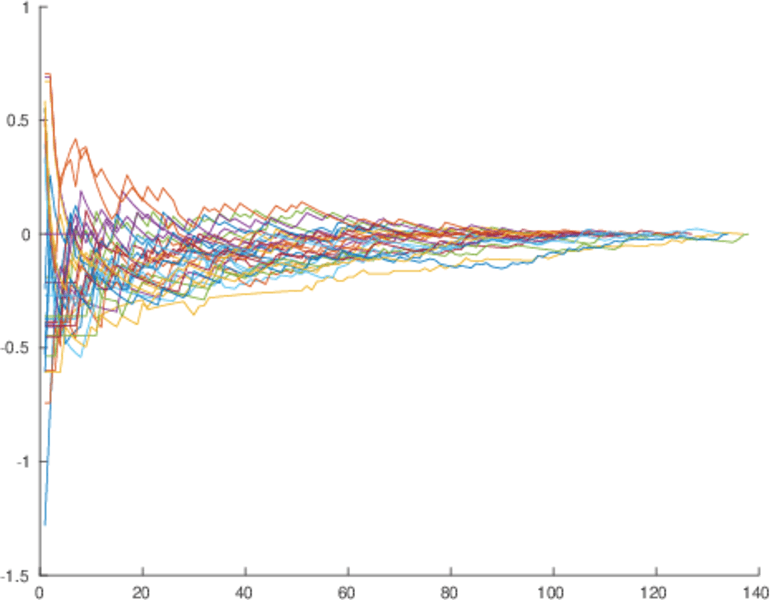
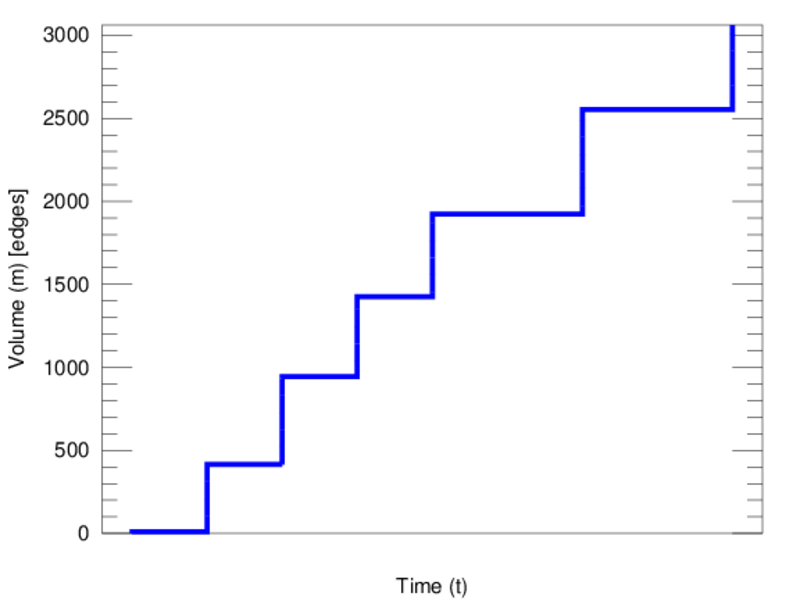
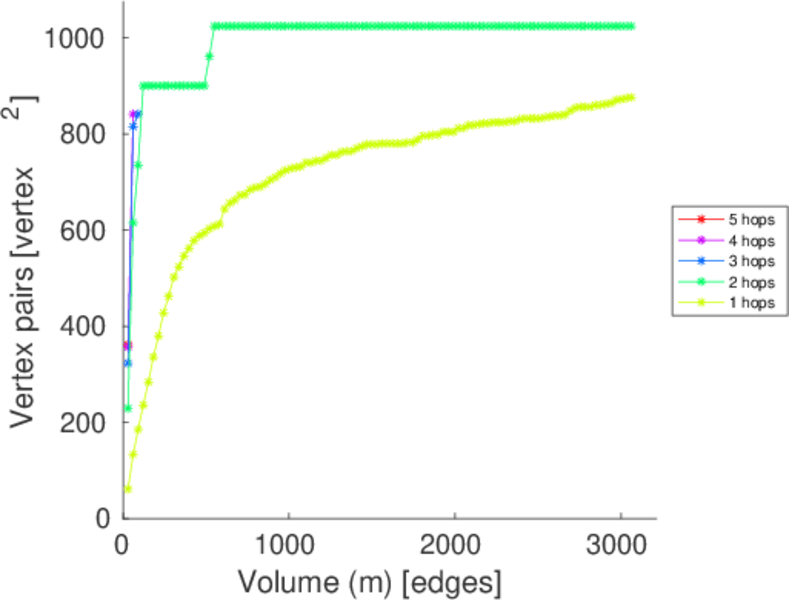
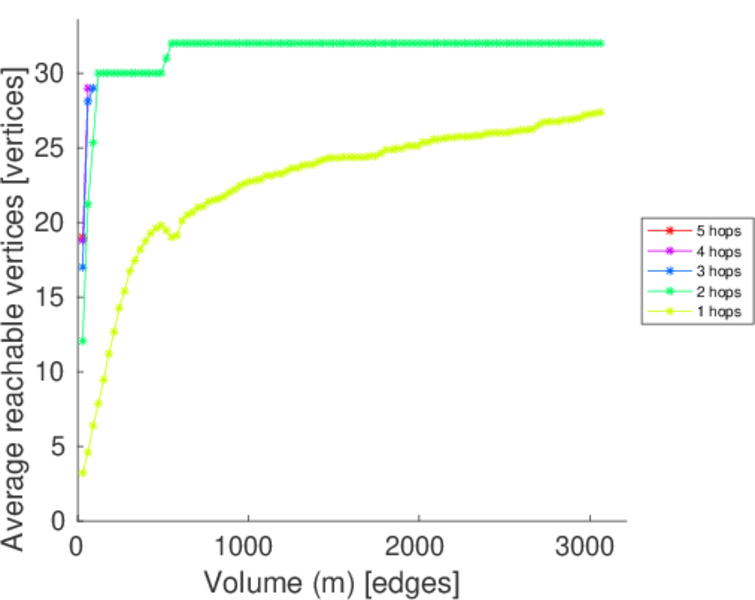
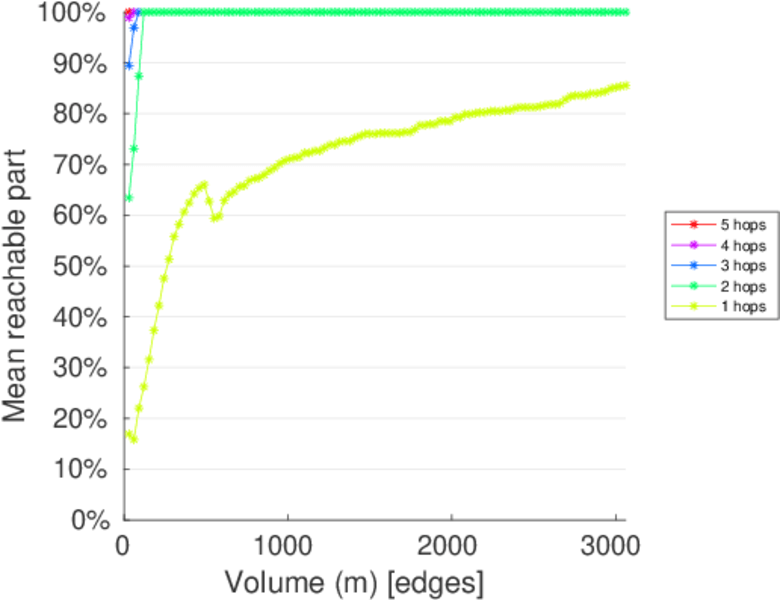
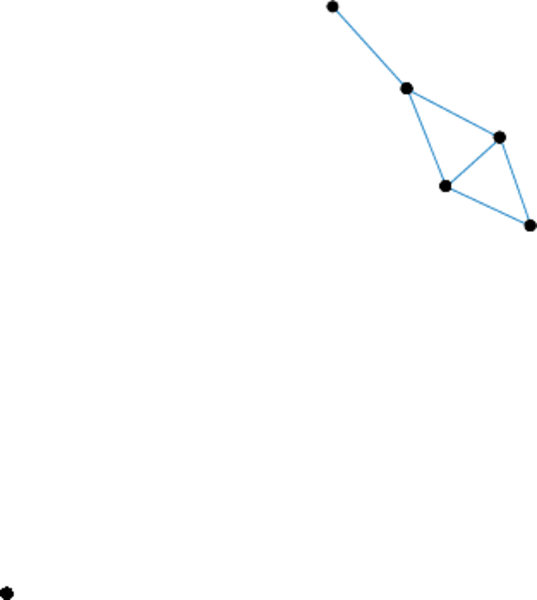
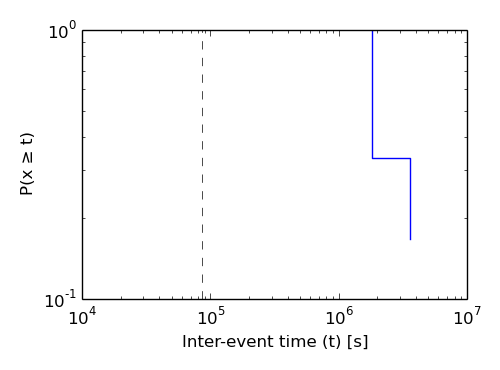
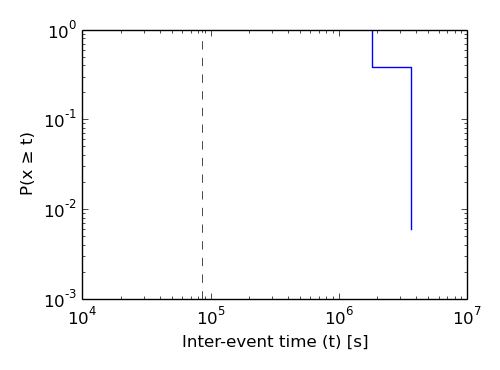
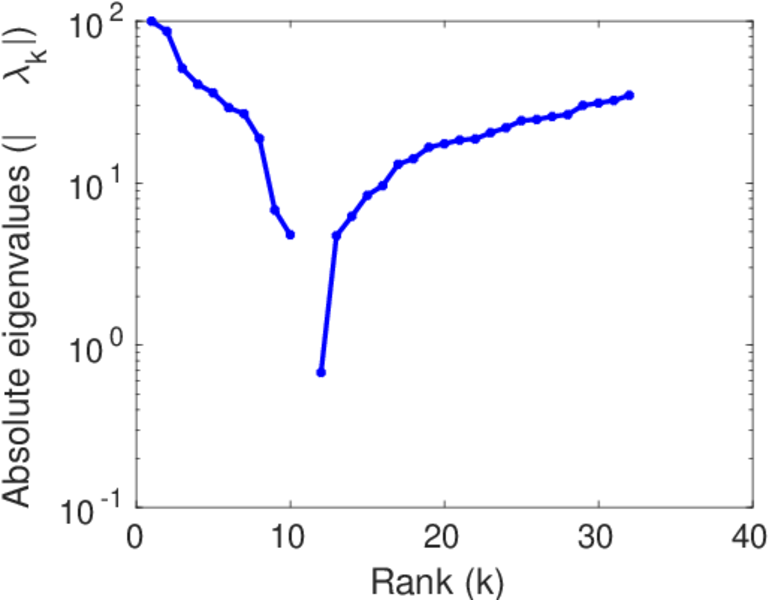
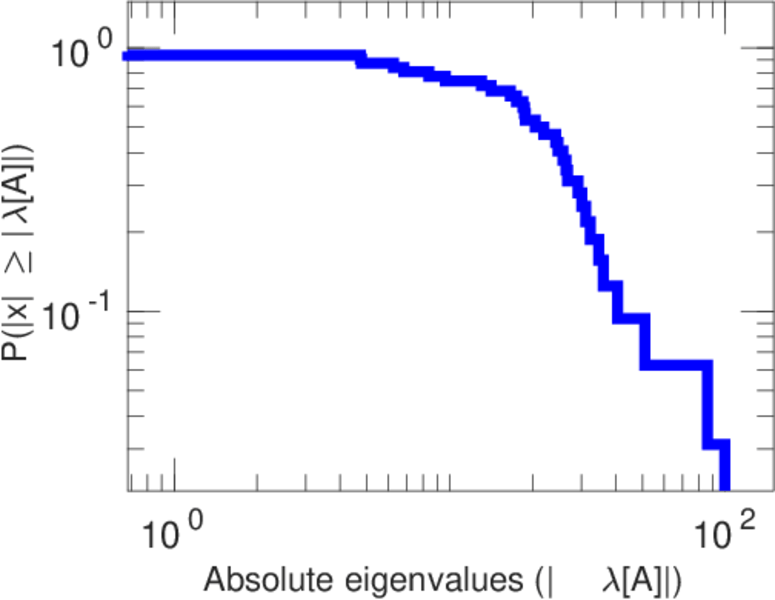
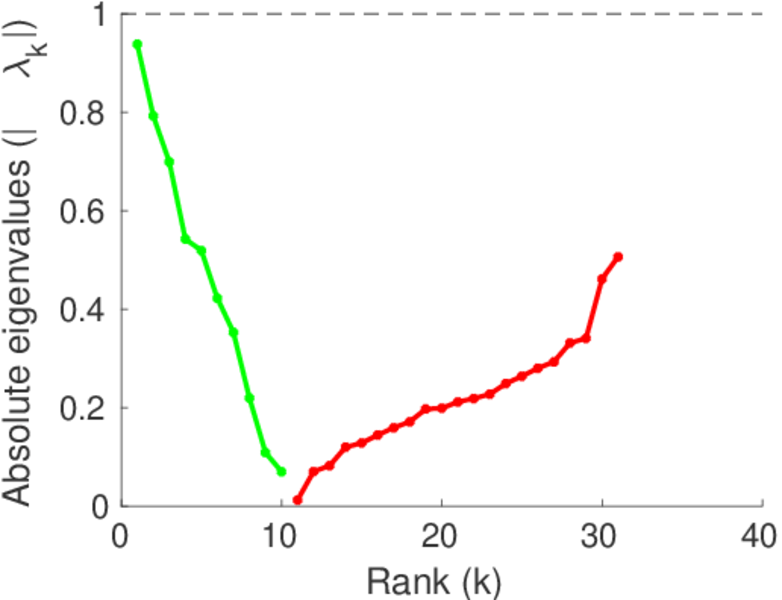
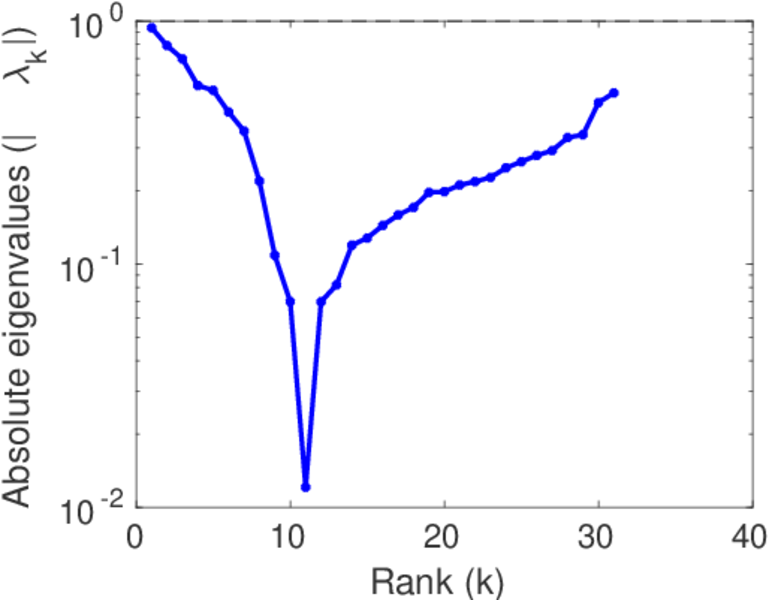
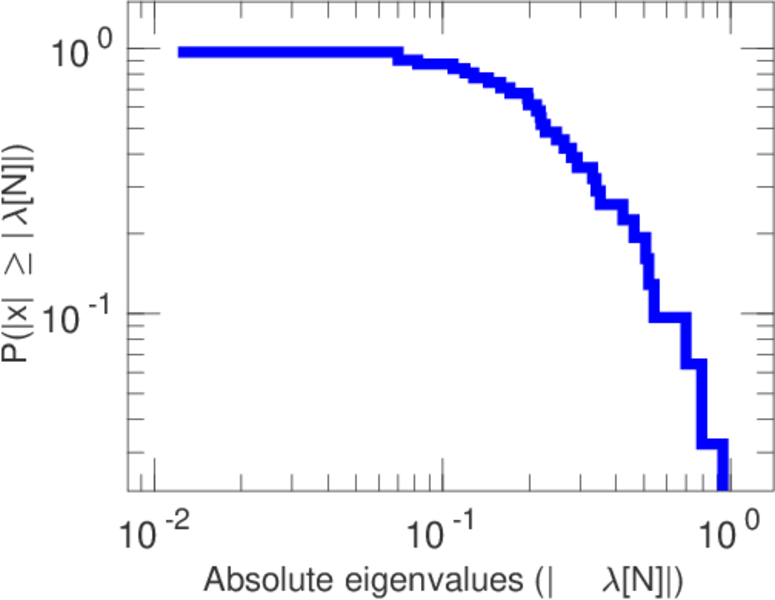
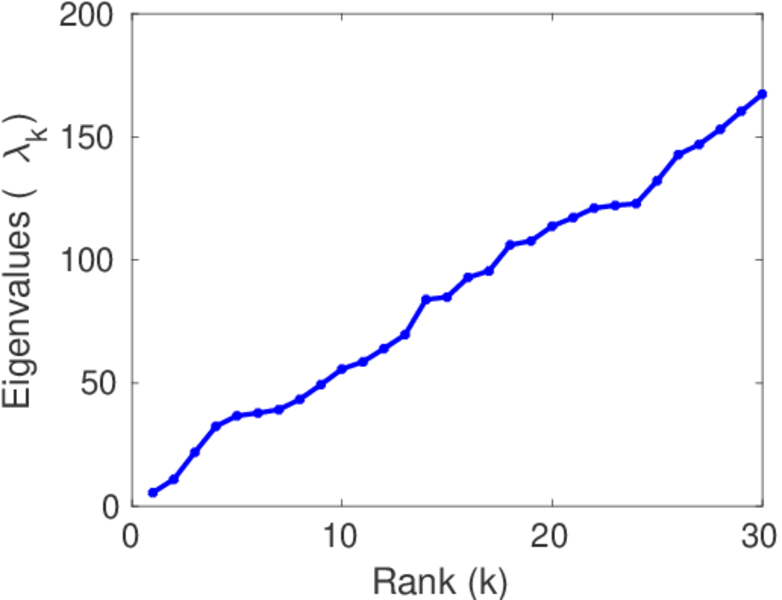
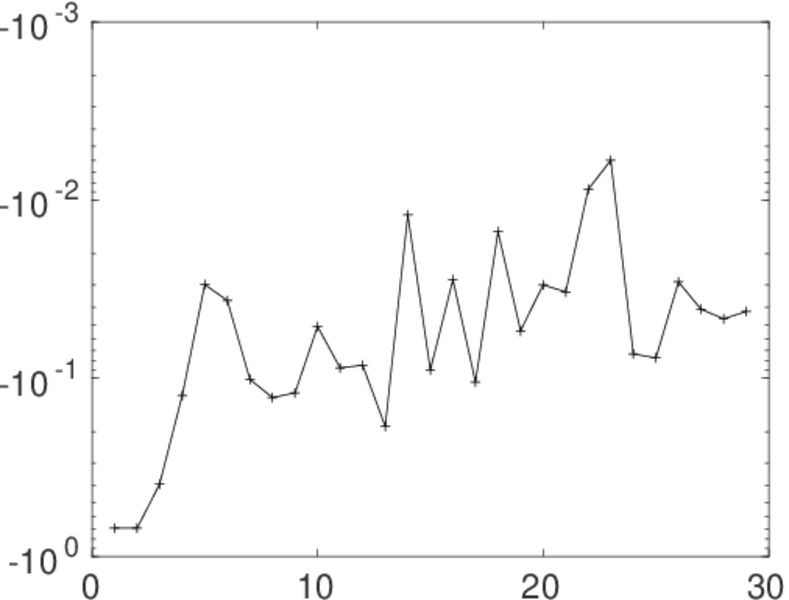
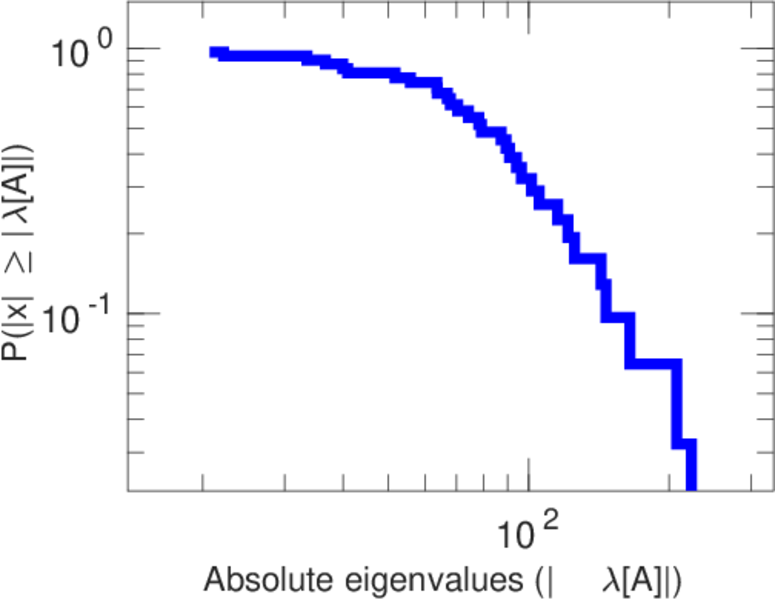
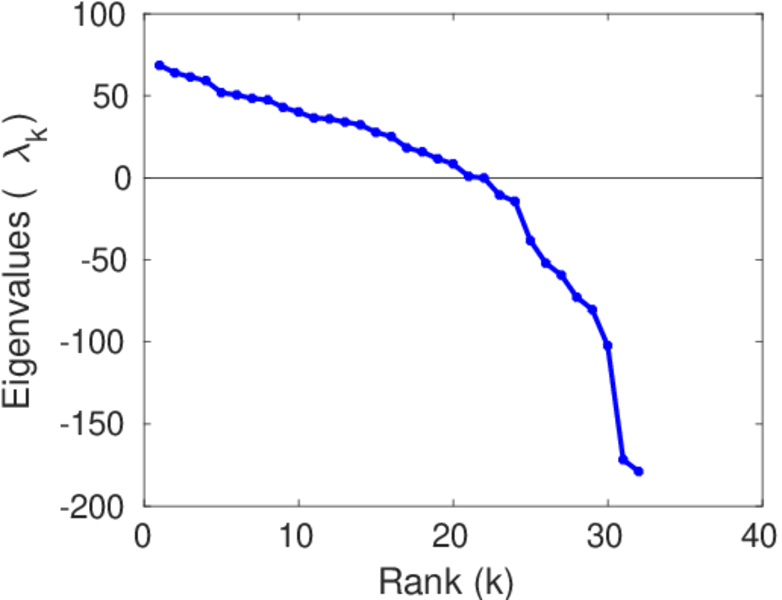
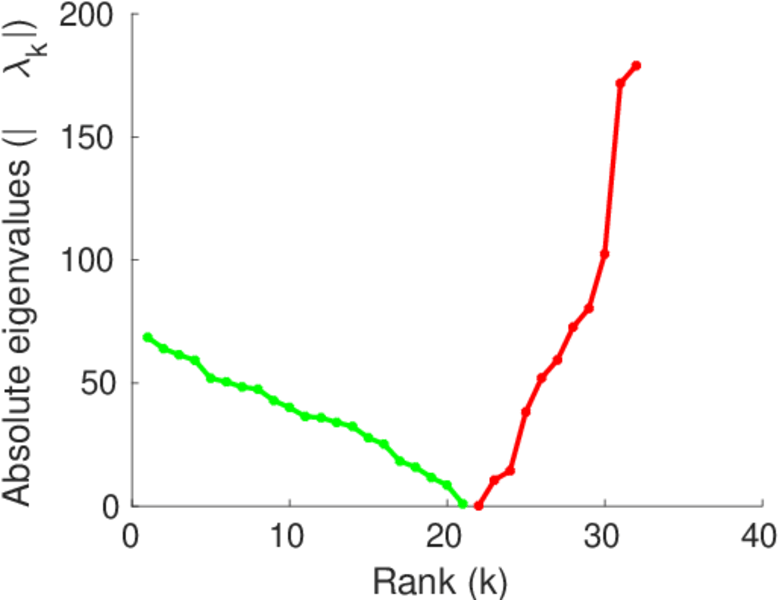
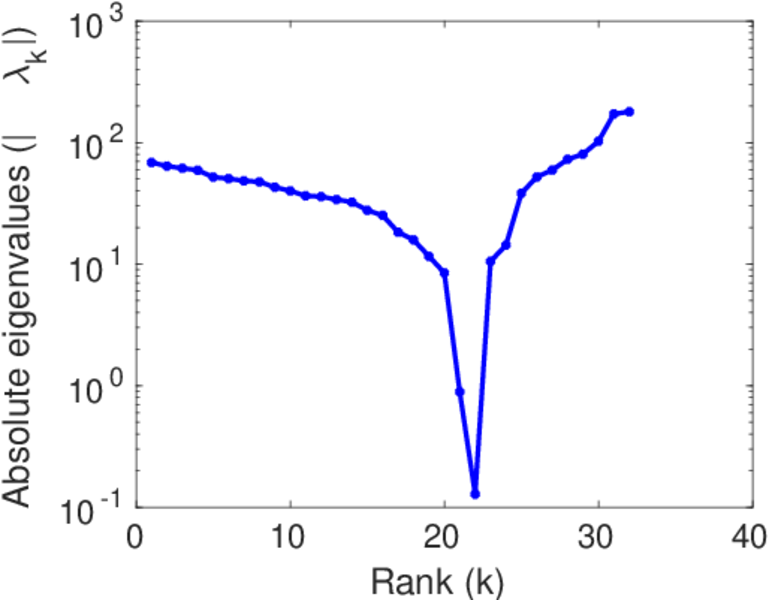
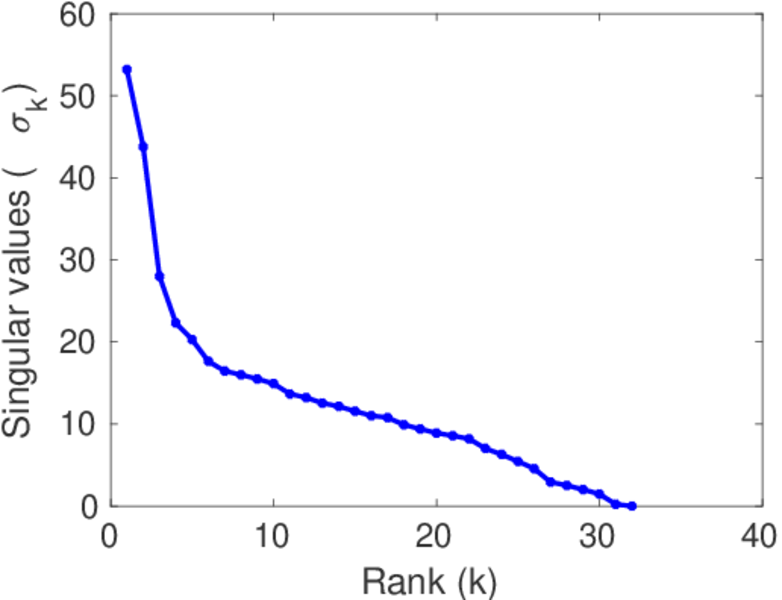
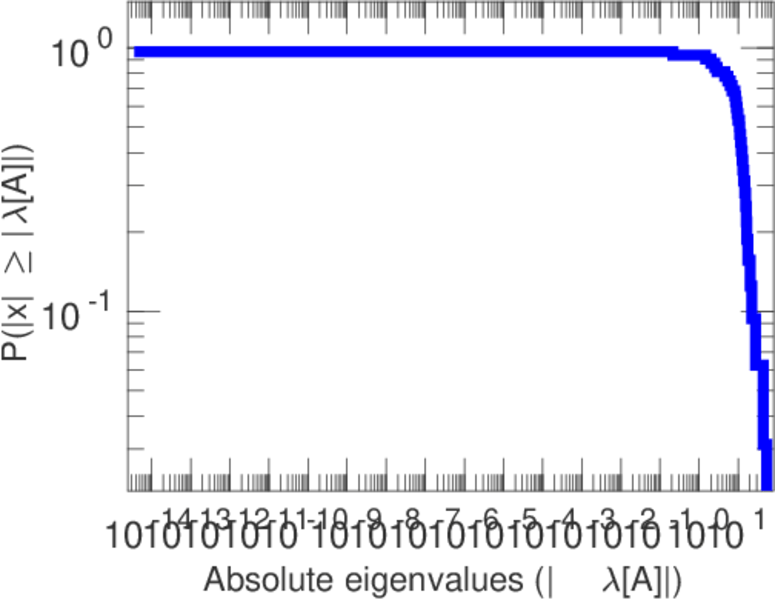
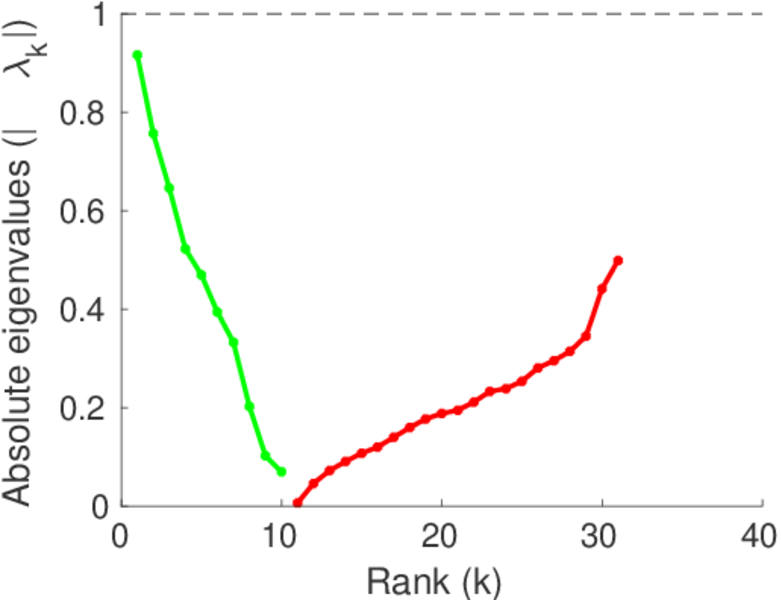
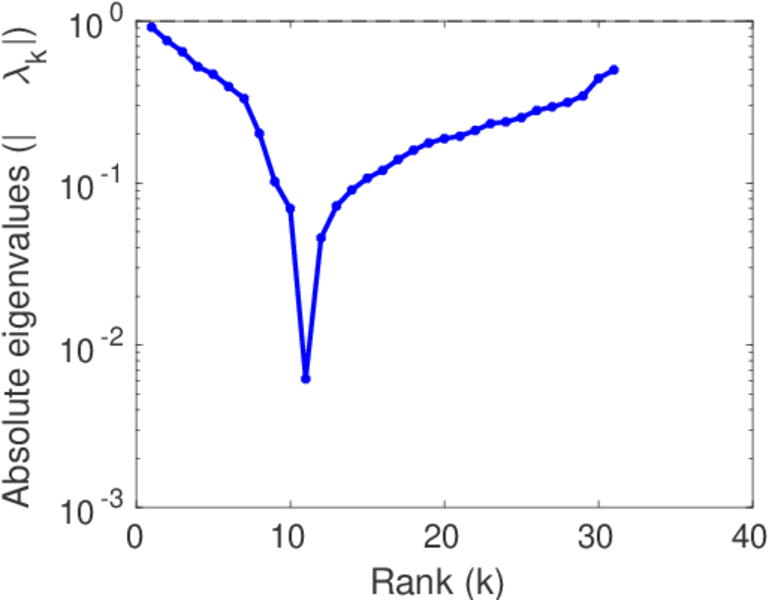
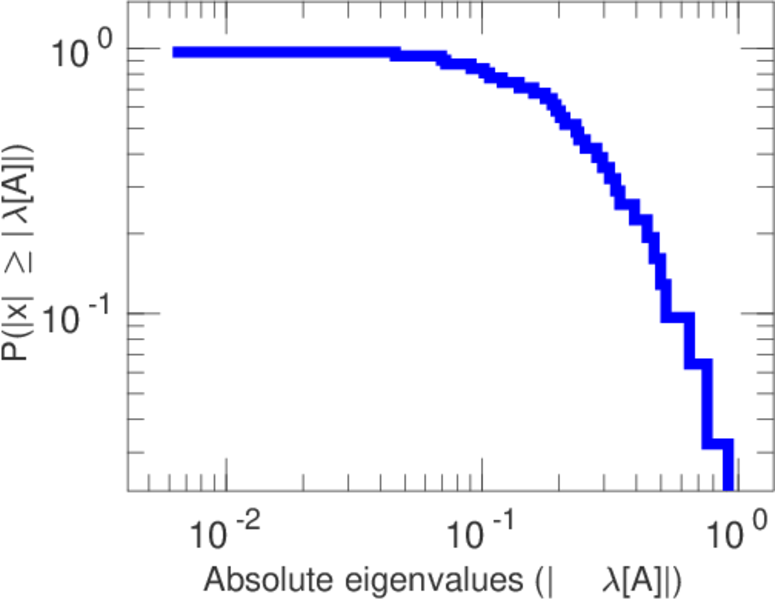
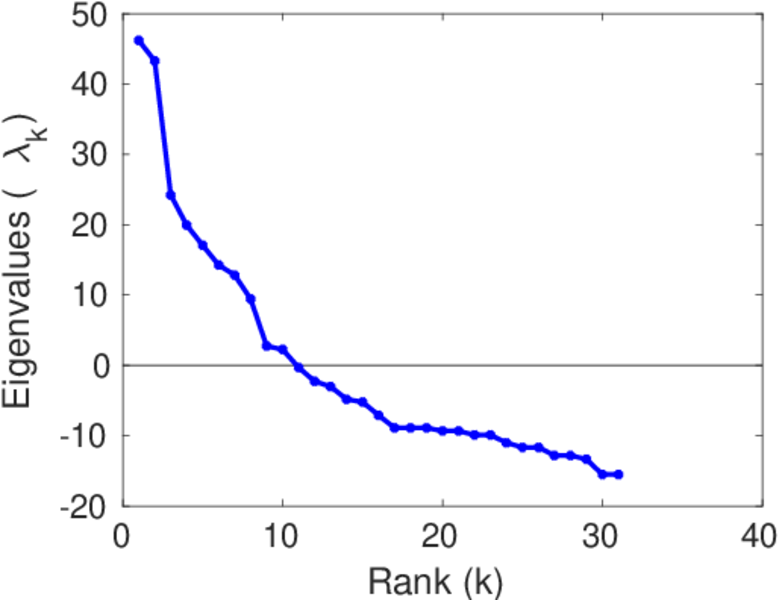
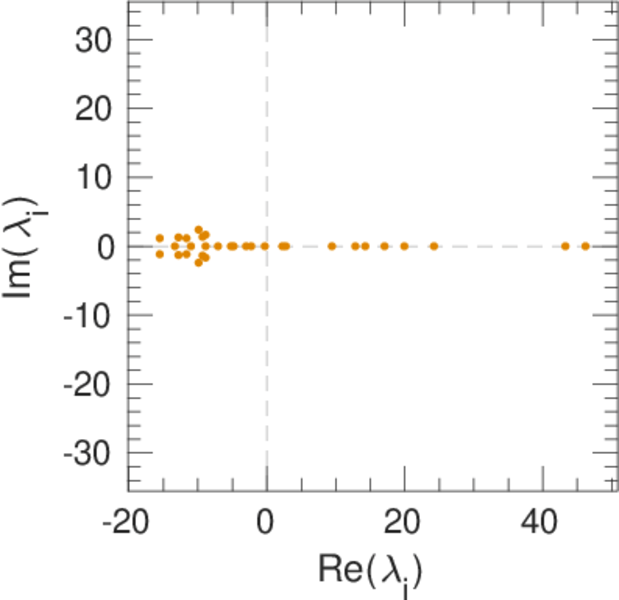
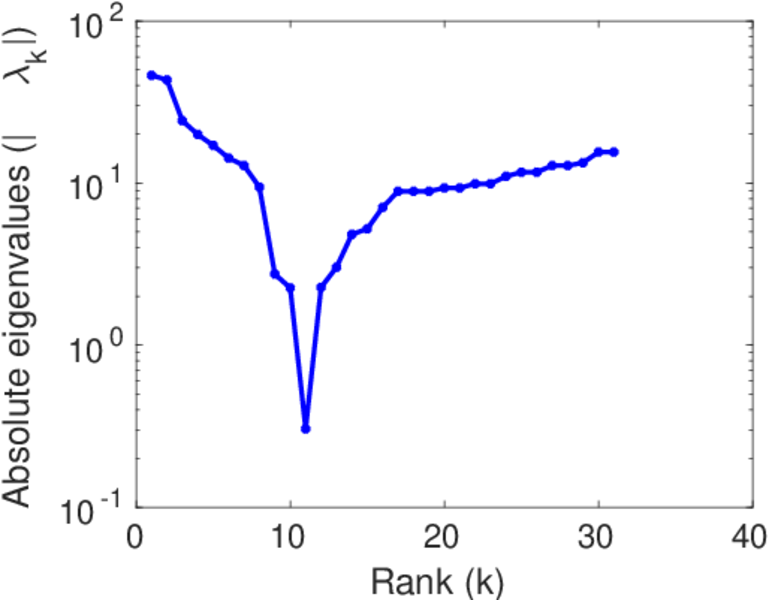
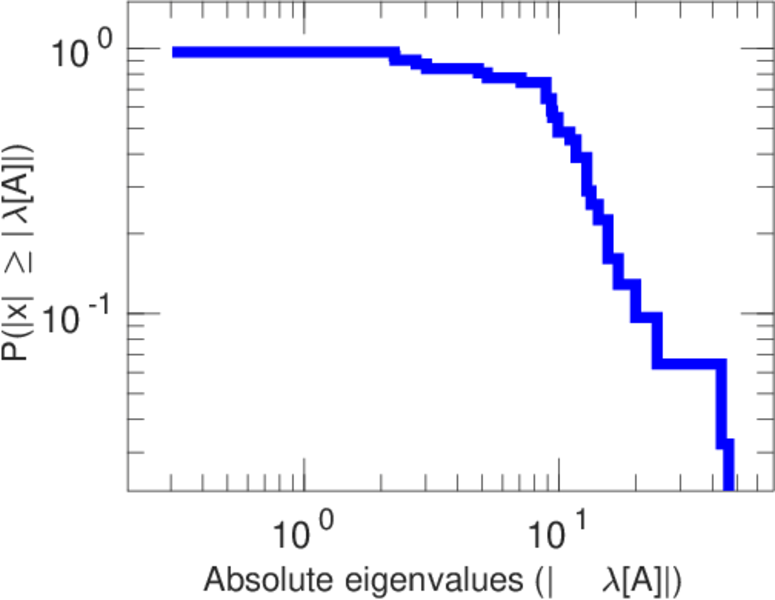
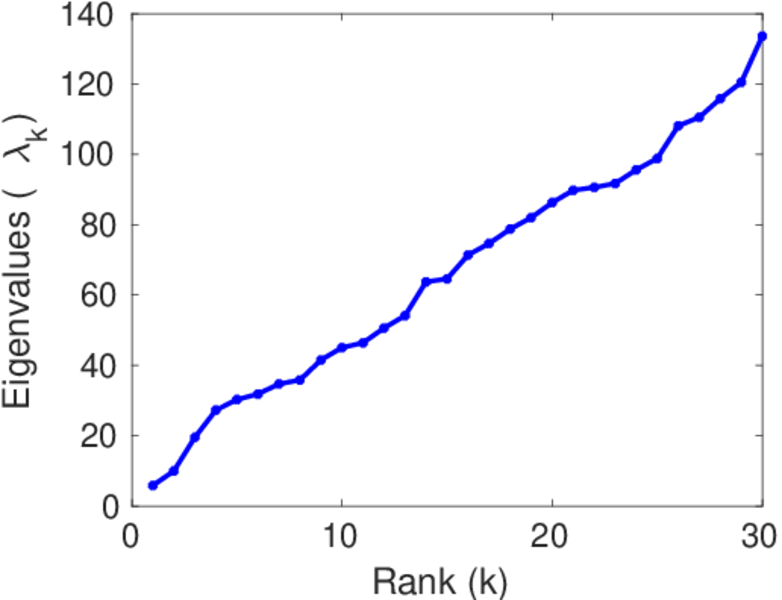
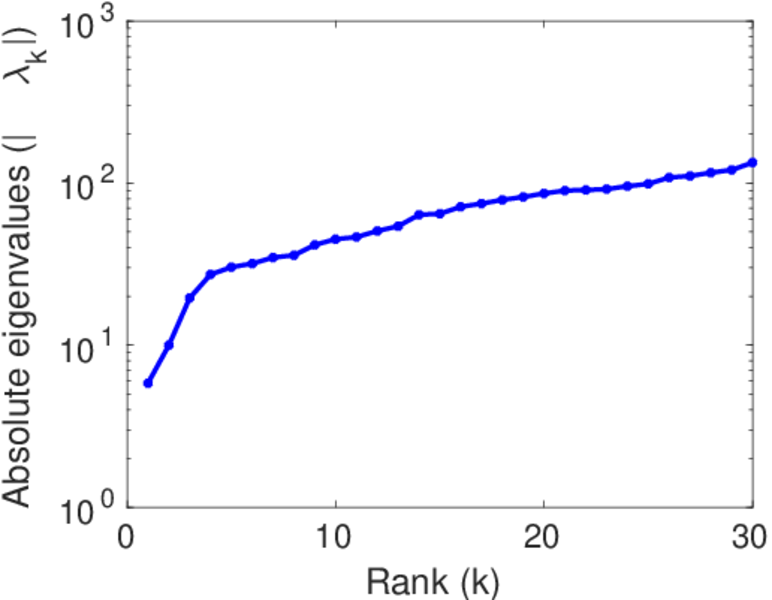
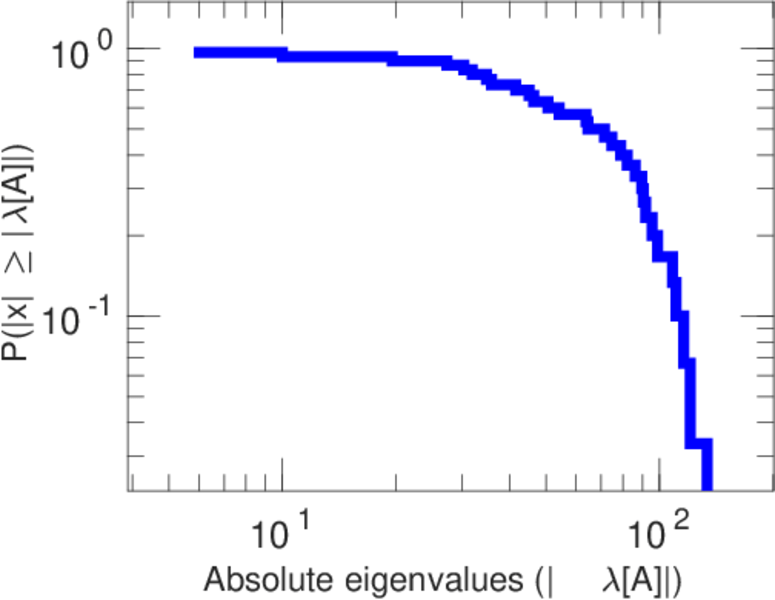
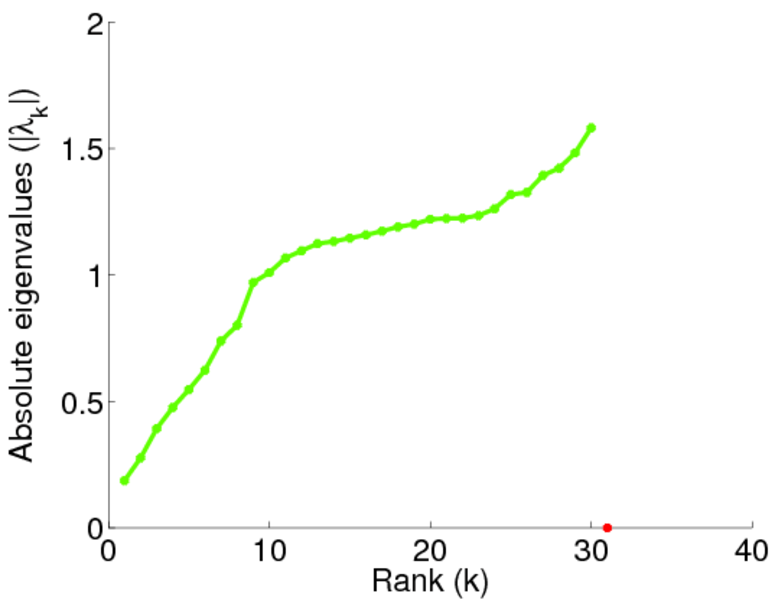
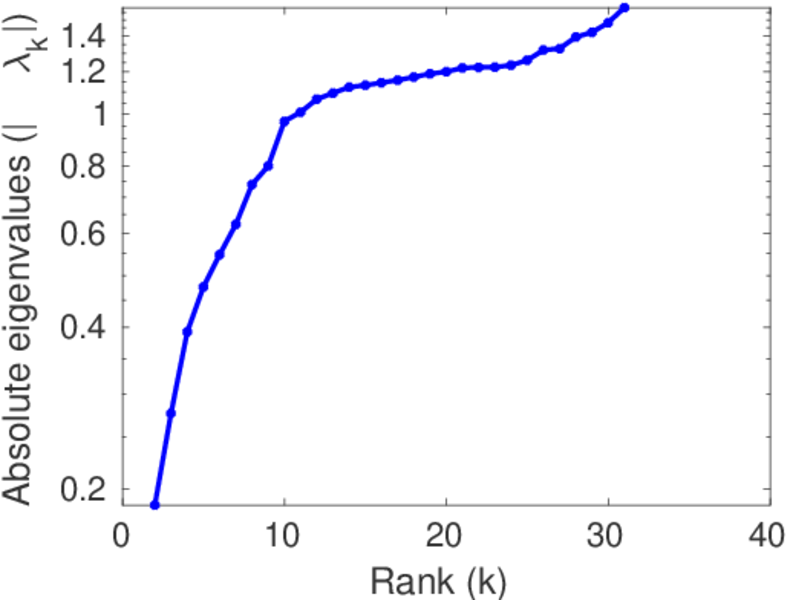
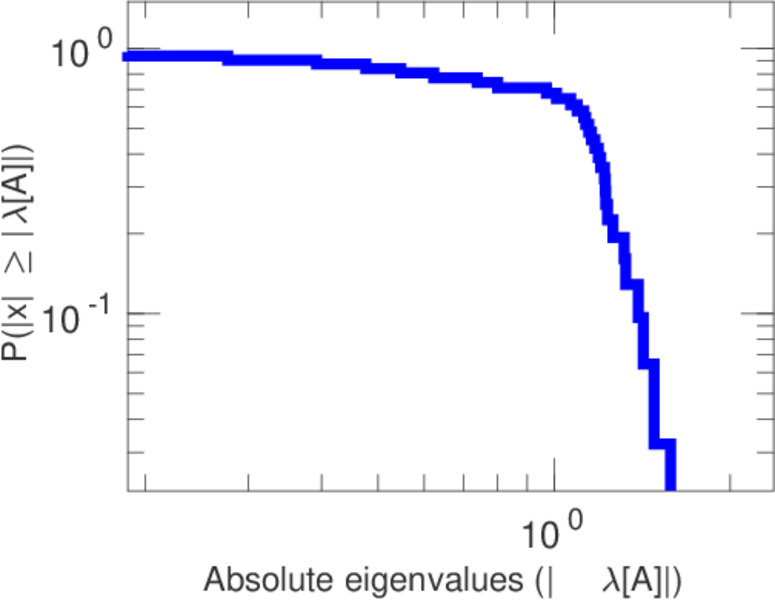
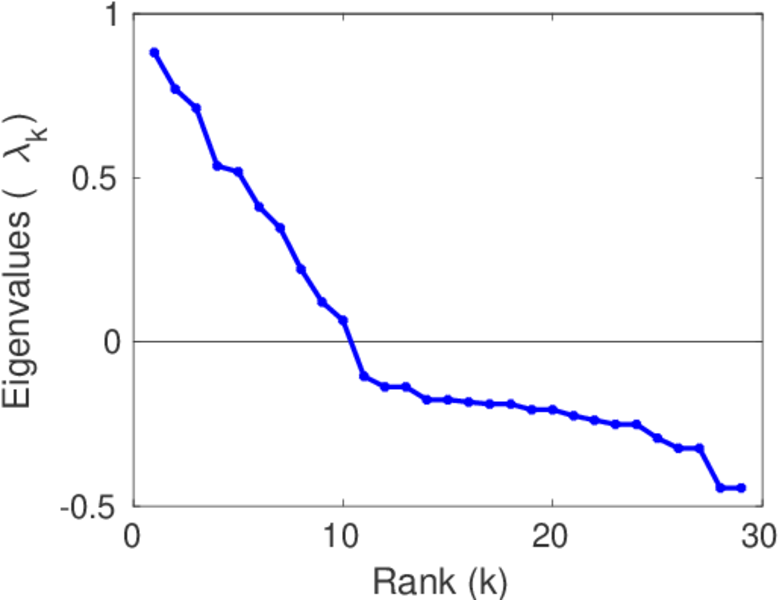
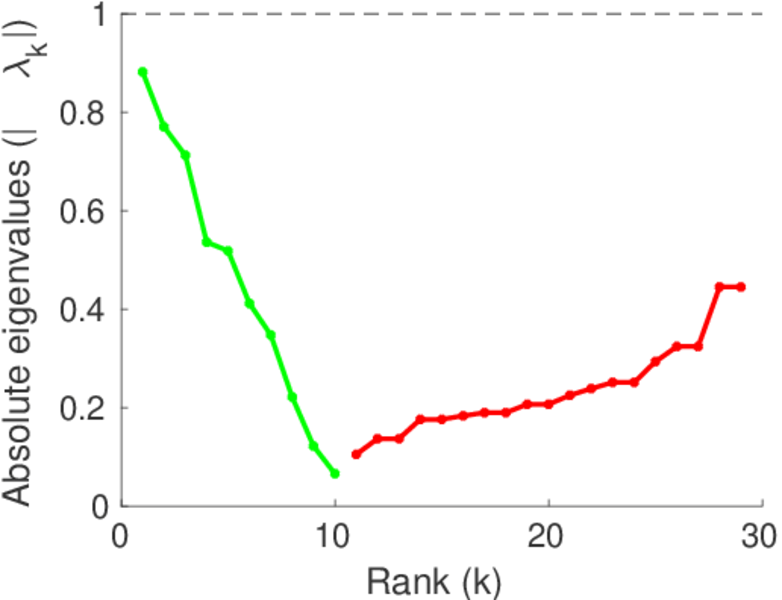
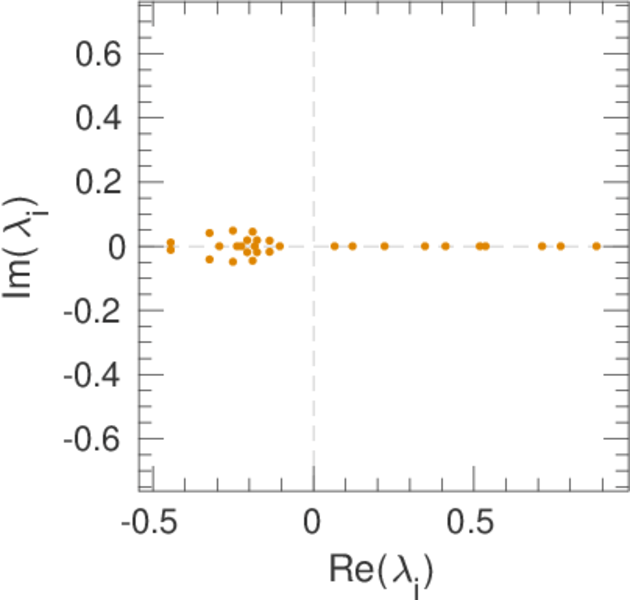
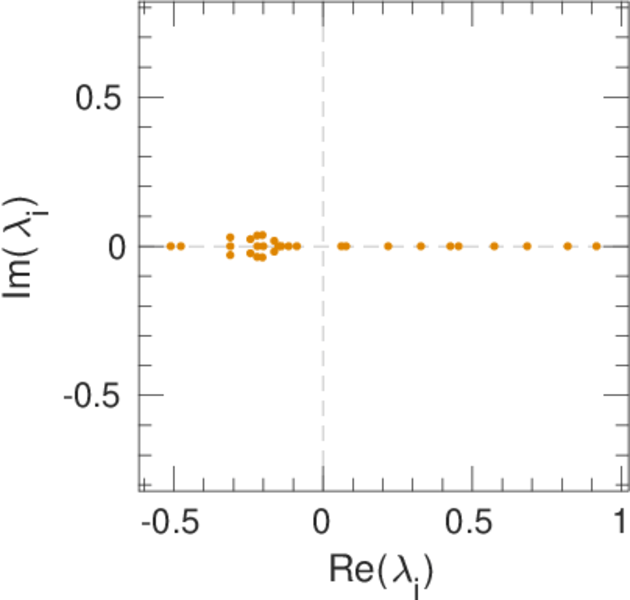
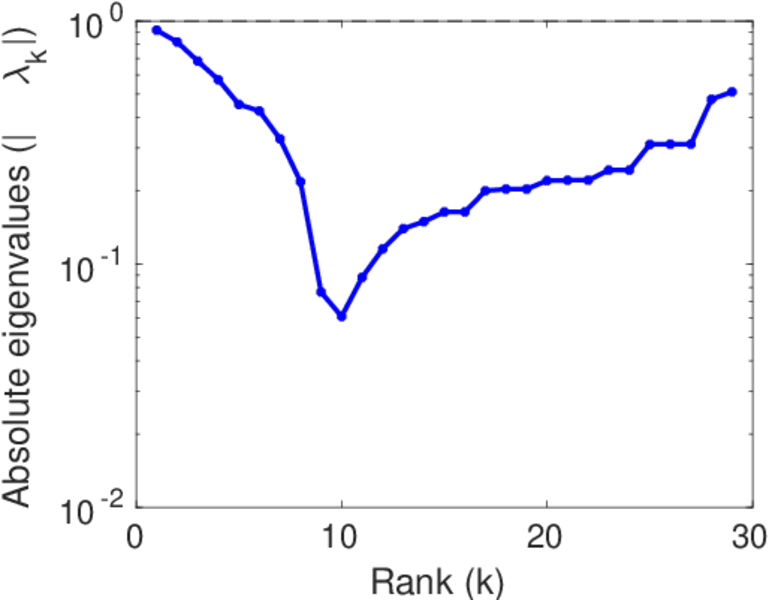
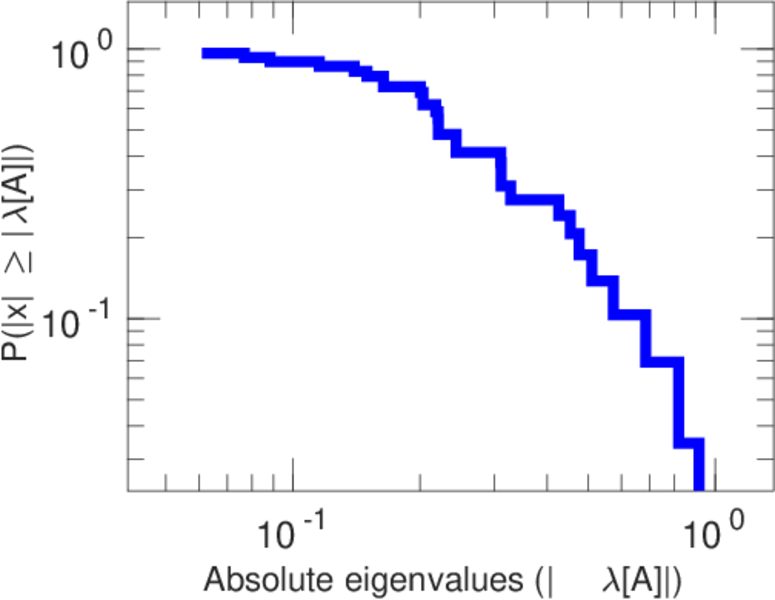
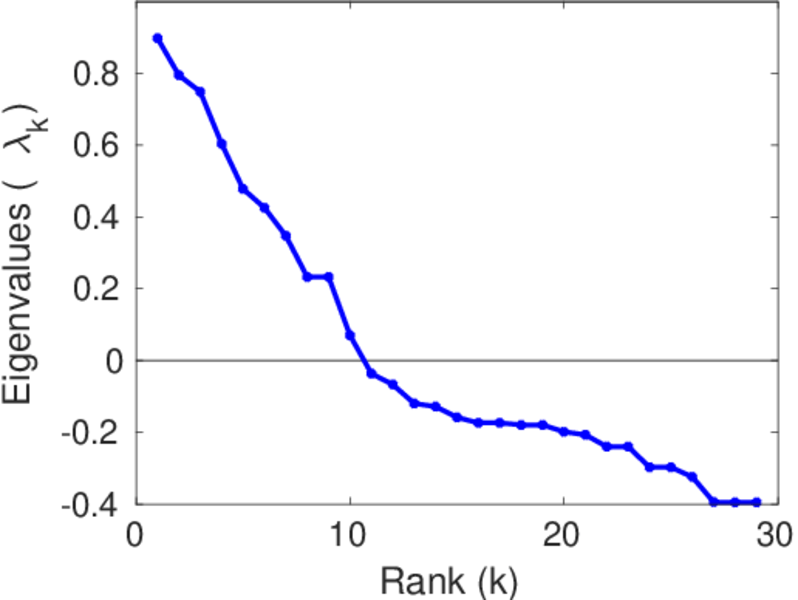
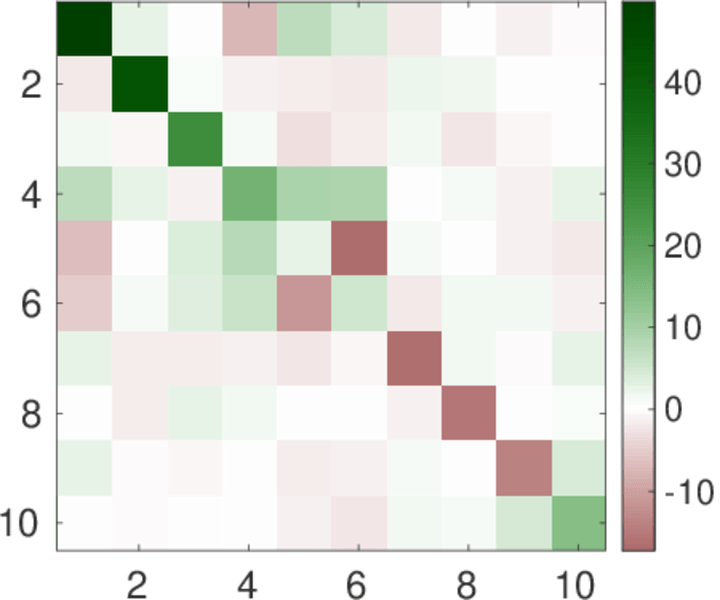
This directed network contains friendship ratings between 32 university freshmen who mostly did not know each other before starting university. Each student was asked to rate the other student at seven different time points. Note that the origin of the timestamps is not accurately known but the distance between two timestamps is correct. A node represents a student and an edge between two students shows that the left rated the right one The edge weights show how good their friendship is in the eye of the left node. The weight ranges from −1 for risk of getting into conflict to +3 for best friend.

Metadata

CodeMv
Internal namemoreno_vdb
NameDutch college
Data sourcehttp://moreno.ss.uci.edu/data.html#vdb
AvailabilityDataset is available for download
Consistency checkDataset passed all tests
Category
Human social network
Node meaningStudent
Edge meaningRating
Network formatUnipartite, directed
Edge typeSigned, possibly weighted, multiple edges
Temporal data Edges are annotated with timestamps
ReciprocalContains reciprocal edges
Directed cyclesContains directed cycles
LoopsDoes not contain loops
Zero weights Edges may have weight zero

Statistics

Size n =32
Volume m =3,062
Unique edge count m̿ =354
Loop count l =0
Wedge count s =11,098
Claw count z =77,121
Cross count x =532,180
Triangle count t =3,343
Square count q =7,783
4-Tour count T4 =77,198
Maximum degree dmax =290
Maximum outdegree d+max =174
Maximum indegree dmax =138
Average degree d =191.375
Fill p =0.380 645
Average edge multiplicity m̃ =8.649 72
Size of LCC N =32
Size of LSCC Ns =31
Relative size of LSCC Nrs =0.968 750
Diameter δ =2
50-Percentile effective diameter δ0.5 =0.577 202
90-Percentile effective diameter δ0.9 =1.349 17
Median distance δM =1
Mean distance δm =1.126 49
Gini coefficient G =0.203 116
Balanced inequality ratio P =0.399 718
Outdegree balanced inequality ratio P+ =0.384 181
Indegree balanced inequality ratio P =0.387 006
Relative edge distribution entropy Her =0.981 214
Power law exponent γ =2.409 97
Tail power law exponent γt =7.101 00
Tail power law exponent with p γ3 =7.101 00
p-value p =0.416 000
Outdegree tail power law exponent with p γ3,o =8.991 00
Outdegree p-value po =0.444 000
Indegree tail power law exponent with p γ3,i =8.991 00
Indegree p-value pi =0.379 000
Degree assortativity ρ =−0.058 982 1
Degree assortativity p-value pρ =0.203 752
In/outdegree correlation ρ± =+0.646 475
Clustering coefficient c =0.903 676
Directed clustering coefficient c± =0.562 074
Spectral norm α =99.606 0
Operator 2-norm ν =53.172 5
Cyclic eigenvalue π =46.193 2
Algebraic connectivity a =10.896 4
Spectral separation 1[A] / λ2[A]| =1.155 14
Reciprocity y =0.683 616
Non-bipartivity bA =0.745 563
Normalized non-bipartivity bN =0.666 392
Algebraic non-bipartivity χ =5.864 12
Spectral bipartite frustration bK =0.097 525 5
Negativity ζ =0.076 271 2
Algebraic conflict ξ =2.520 79
Triadic conflict τ =0.156 077
Spectral signed frustration φ =0.043 607 4
Controllability C =0
Relative controllability Cr =0.000 00

Plots

Fruchterman–Reingold graph drawing

Degree distribution

Cumulative degree distribution

Lorenz curve

Spectral distribution of the adjacency matrix

Spectral distribution of the normalized adjacency matrix

Spectral distribution of the Laplacian

Spectral graph drawing based on the adjacency matrix

Spectral graph drawing based on the Laplacian

Spectral graph drawing based on the normalized adjacency matrix

Degree assortativity

Zipf plot

Hop distribution

Double Laplacian graph drawing

Delaunay graph drawing

In/outdegree scatter plot

Item rating evolution

Edge weight/multiplicity distribution

Clustering coefficient distribution

Average neighbor degree distribution

Temporal distribution

Temporal hop distribution

Diameter/density evolution

Signed temporal distribution

Rating class evolution

SynGraphy

Inter-event distribution

Node-level inter-event distribution

Matrix decompositions plots

Downloads

References

[1] Jérôme Kunegis. KONECT – The Koblenz Network Collection. In Proc. Int. Conf. on World Wide Web Companion, pages 1343–1350, 2013. [ http ]
[2] Gerhard G. Van de Bunt, Marijtje A. J. Van Duijn, and Tom A. B. Snijders. Friendship networks through time: An actor-oriented dynamic statistical network model. Comput. and Math. Organization Theory, 5(2):167–192, 1999.