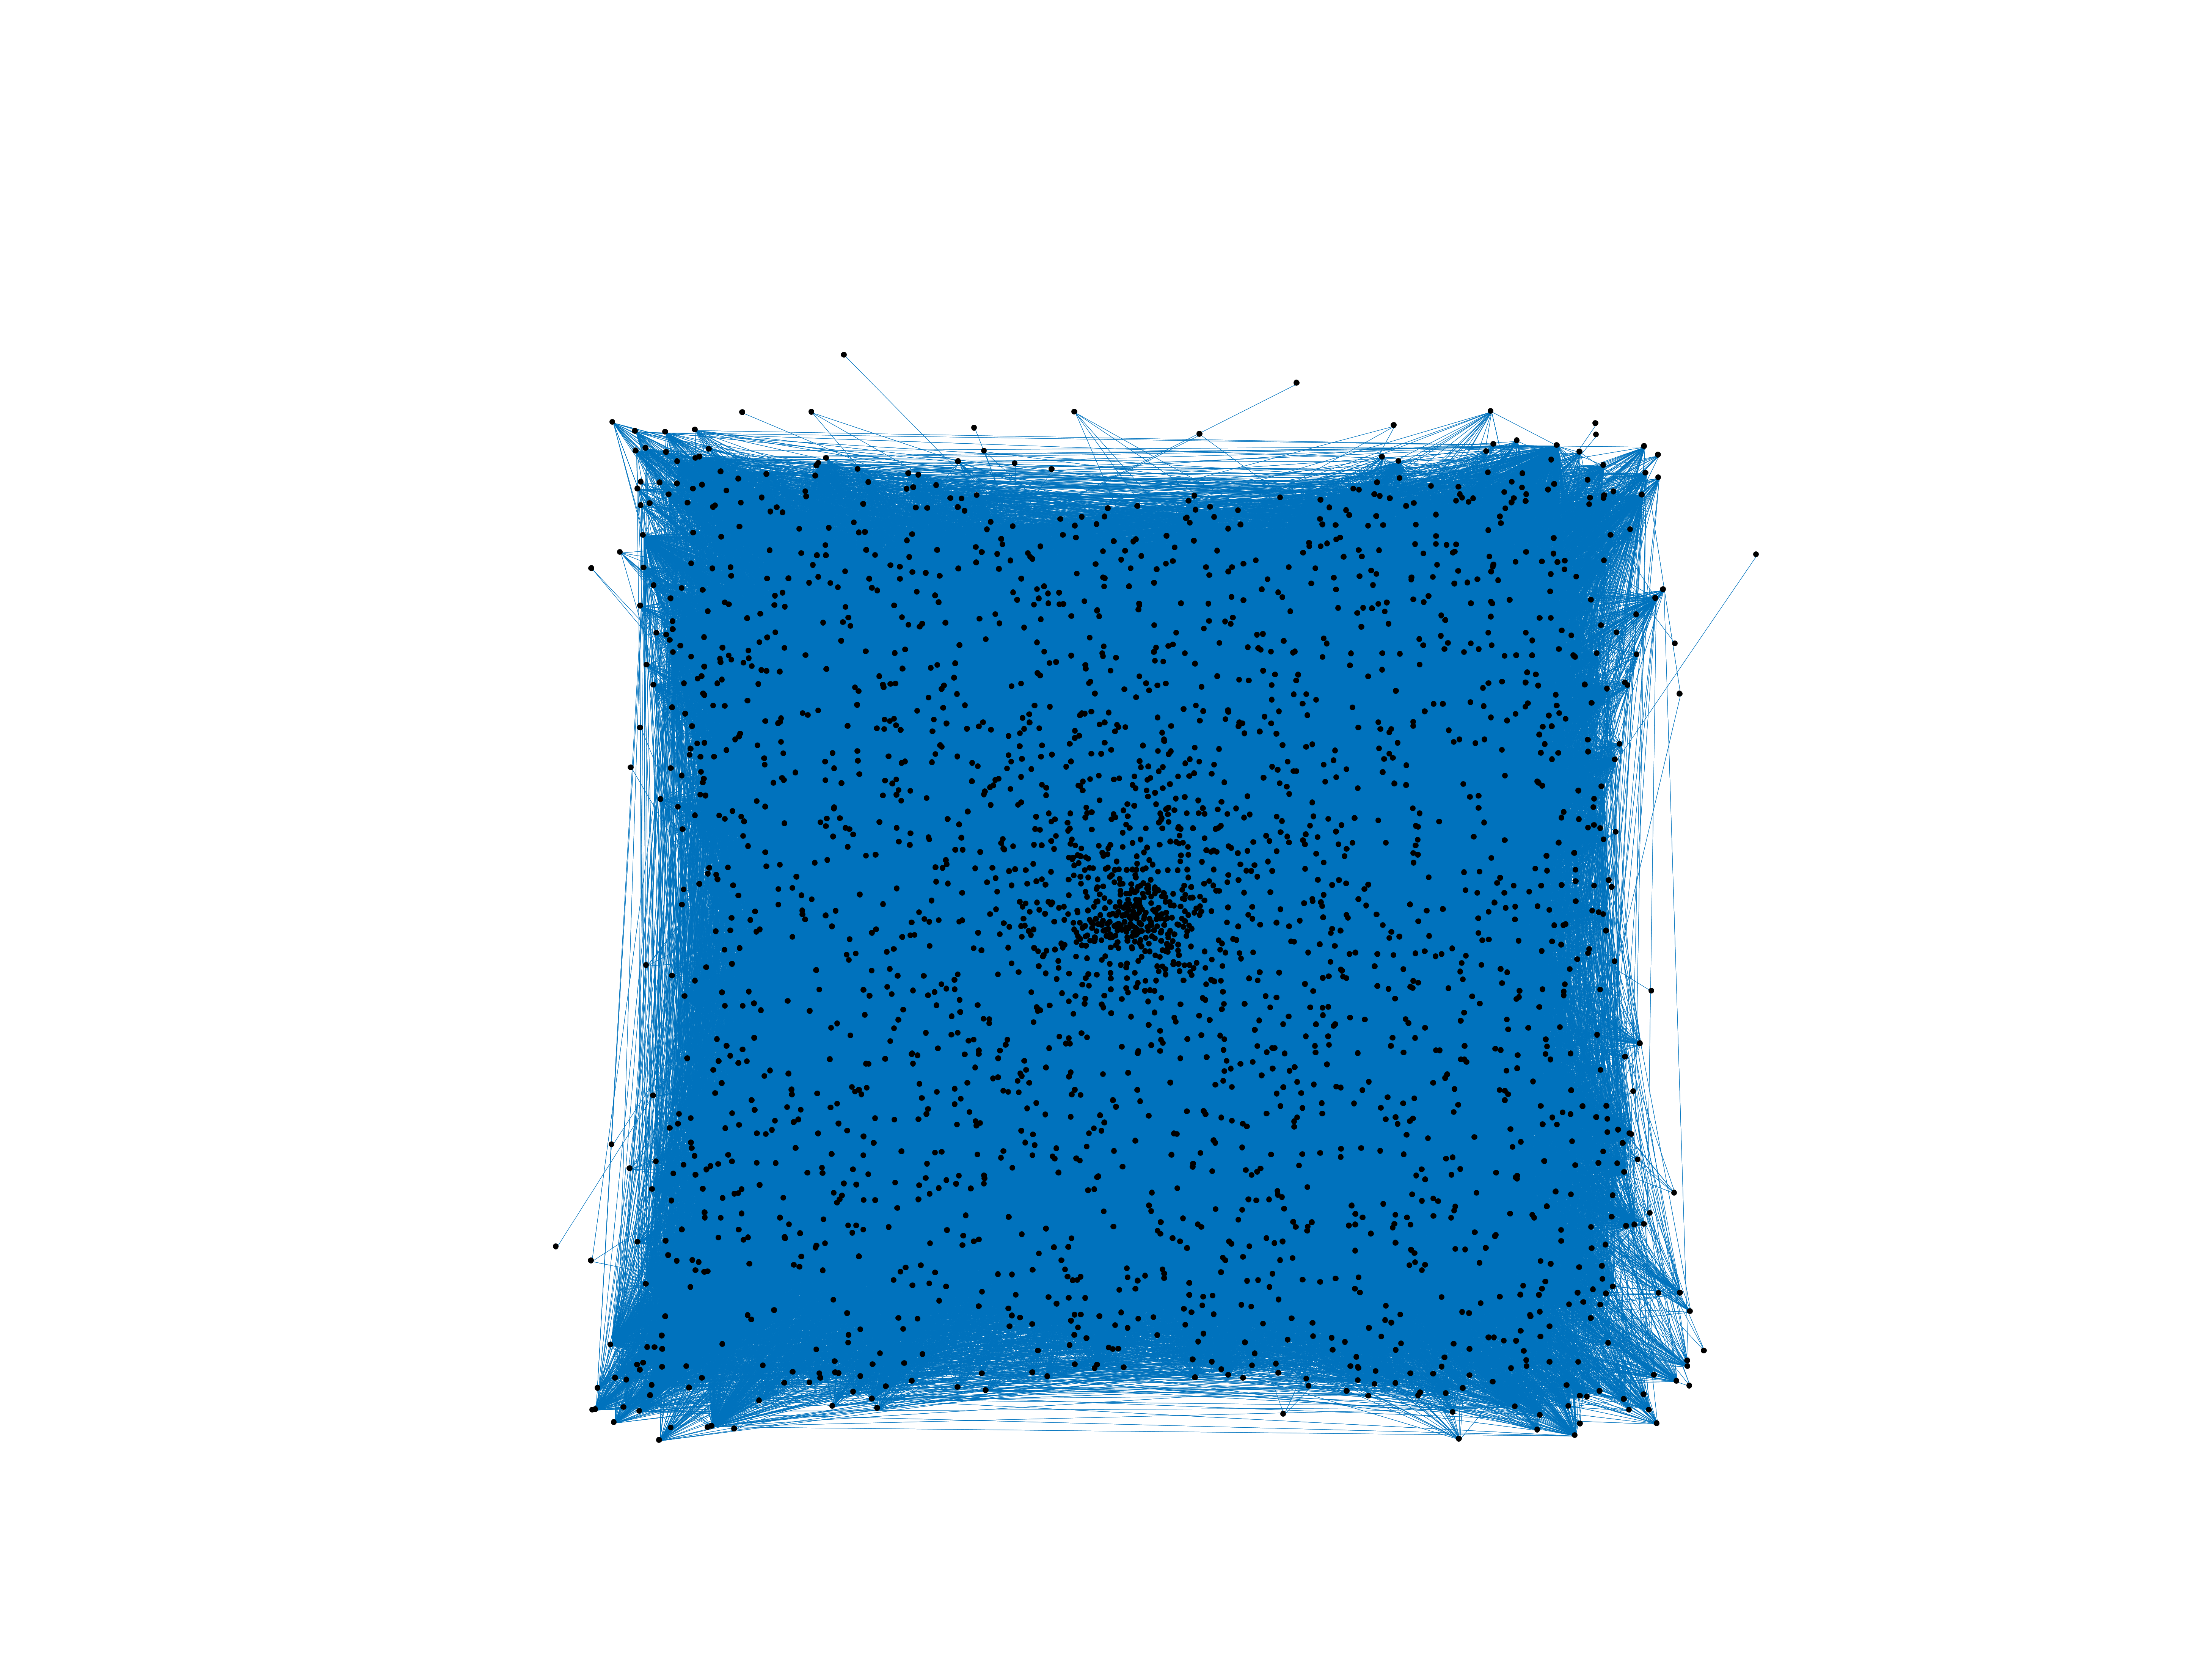
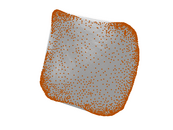
MovieLens 100k
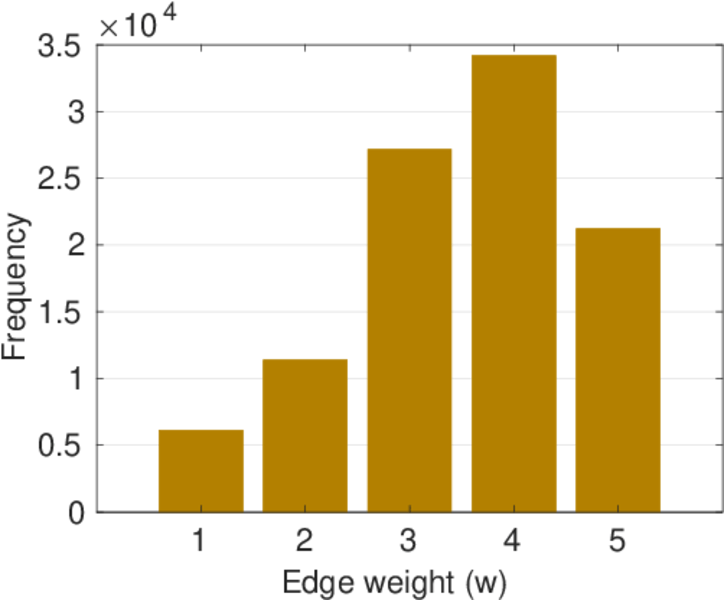
This bipartite network consists of 100,000 user–movie ratings from
http://movielens.umn.edu/. Left nodes are users and right nodes are movies. An
edge between a user and a movie represents a rating of the movie by the user.
Metadata
Statistics
| Size | n = | 2,625
|
| Left size | n1 = | 943
|
| Right size | n2 = | 1,682
|
| Volume | m = | 100,000
|
| Wedge count | s = | 18,367,254
|
| Claw count | z = | 1,702,768,149
|
| Cross count | x = | 151,956,070,551
|
| Square count | q = | 220,548,028
|
| 4-Tour count | T4 = | 1,838,200,228
|
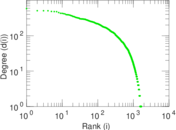
| Maximum degree | dmax = | 737
|
| Maximum left degree | d1max = | 737
|
| Maximum right degree | d2max = | 583
|
| Average degree | d = | 76.190 5
|
| Average left degree | d1 = | 106.045
|
| Average right degree | d2 = | 59.453 0
|
| Fill | p = | 0.063 046 7
|
| Size of LCC | N = | 2,625
|
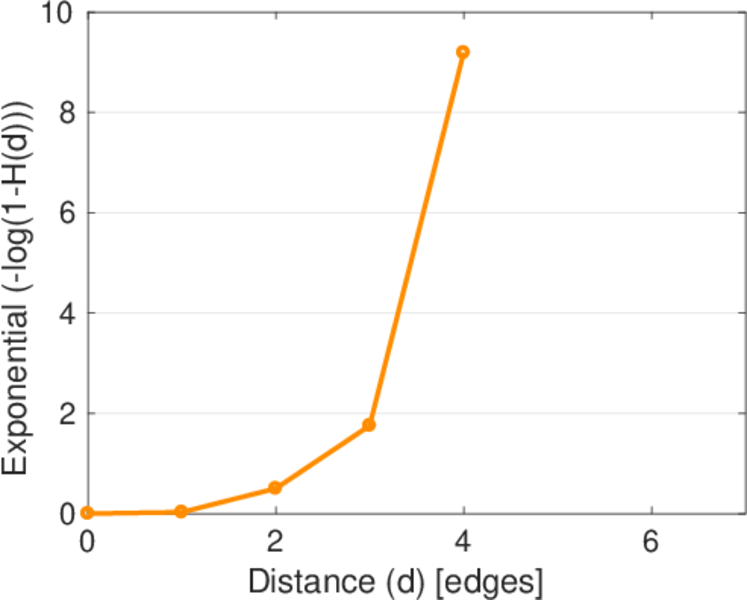
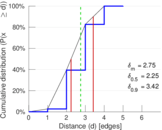
| Diameter | δ = | 5
|
| 50-Percentile effective diameter | δ0.5 = | 2.245 03
|
| 90-Percentile effective diameter | δ0.9 = | 3.422 10
|
| Median distance | δM = | 3
|
| Mean distance | δm = | 2.751 80
|
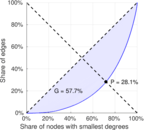
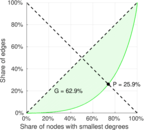
| Gini coefficient | G = | 0.597 836
|
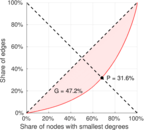
| Balanced inequality ratio | P = | 0.275 130
|
| Left balanced inequality ratio | P1 = | 0.316 090
|
| Right balanced inequality ratio | P2 = | 0.259 320
|
| Relative edge distribution entropy | Her = | 0.926 887
|
| Power law exponent | γ = | 1.285 18
|
| Tail power law exponent | γt = | 1.991 00
|
| Tail power law exponent with p | γ3 = | 1.991 00
|
| p-value | p = | 0.000 00
|
| Left tail power law exponent with p | γ3,1 = | 1.771 00
|
| Left p-value | p1 = | 0.000 00
|
| Right tail power law exponent with p | γ3,2 = | 2.181 00
|
| Right p-value | p2 = | 0.000 00
|
| Degree assortativity | ρ = | −0.215 721
|
| Degree assortativity p-value | pρ = | 0.000 00
|
| Spectral norm | α = | 57.801 5
|
| Algebraic connectivity | a = | 0.021 479 4
|
| Spectral separation | |λ1[A] / λ2[A]| = | 1.120 21
|
| Negativity | ζ = | 0.444 620
|
| Controllability | C = | 739
|
| Relative controllability | Cr = | 0.281 524
|
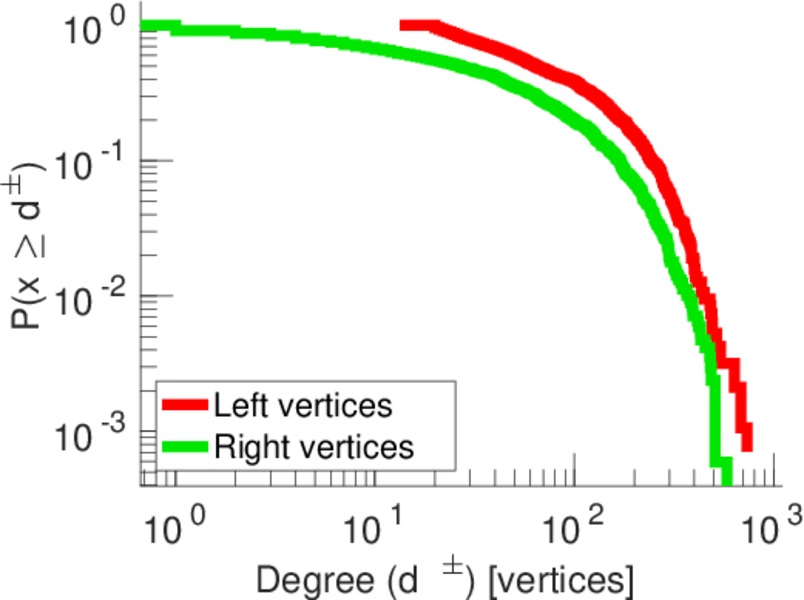
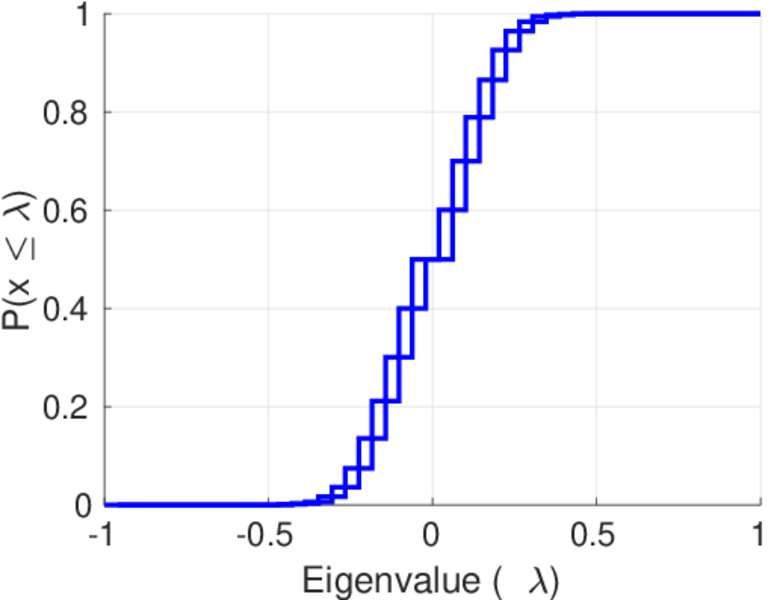
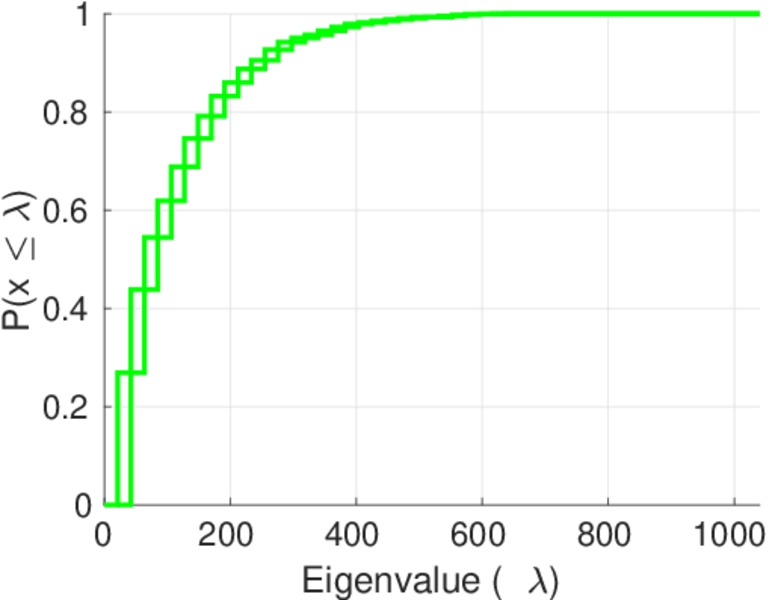
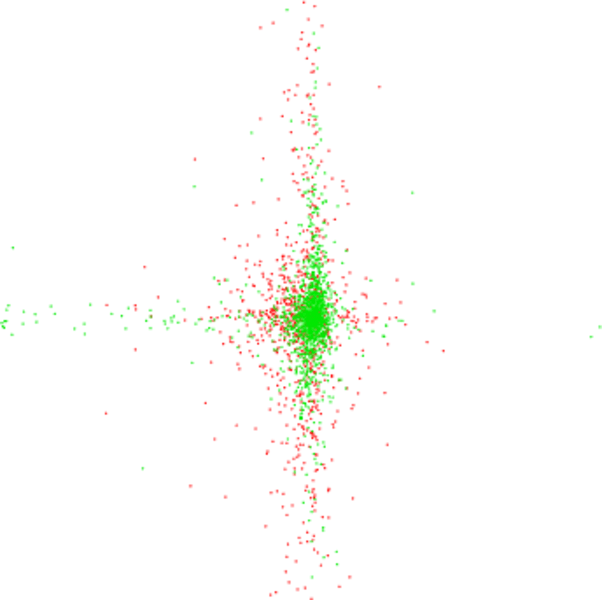
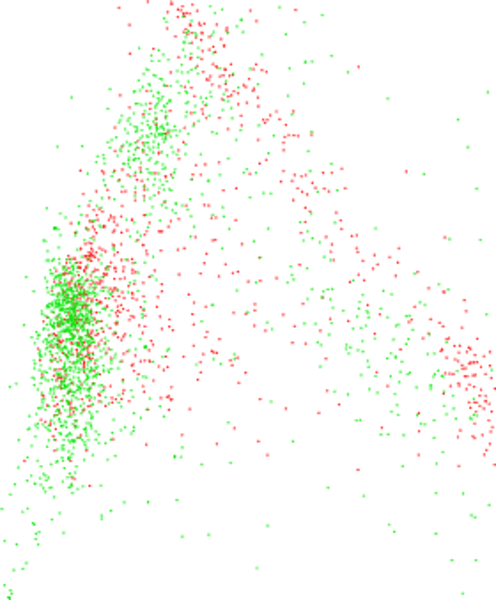
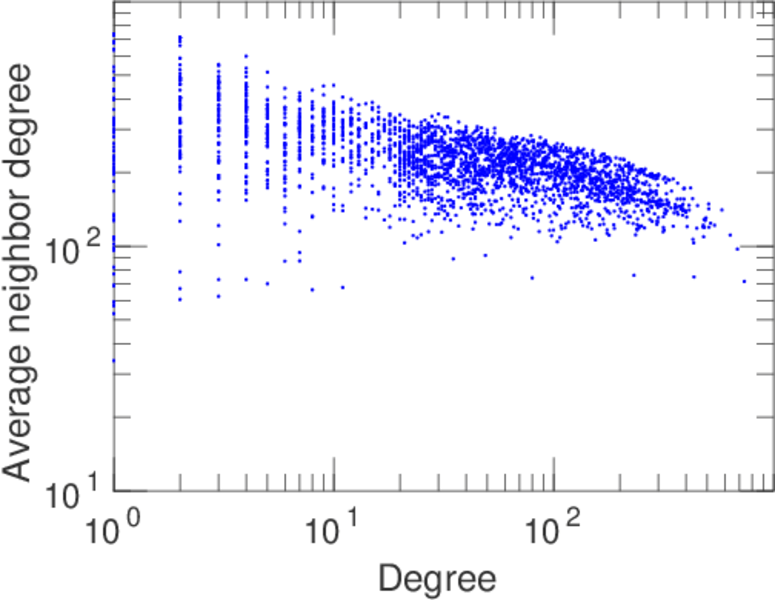
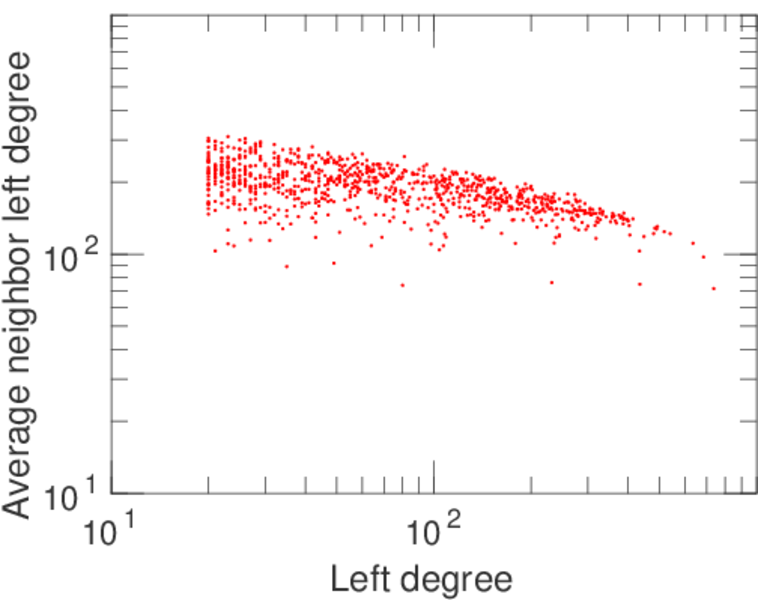
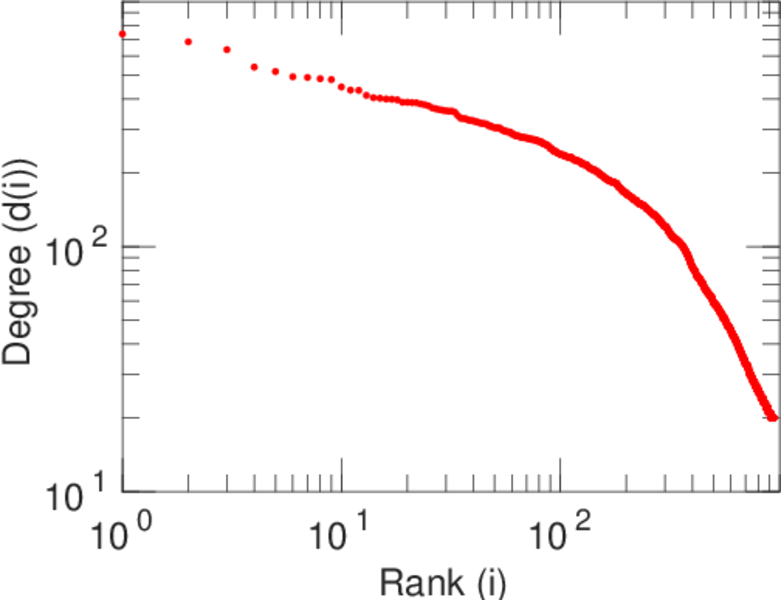
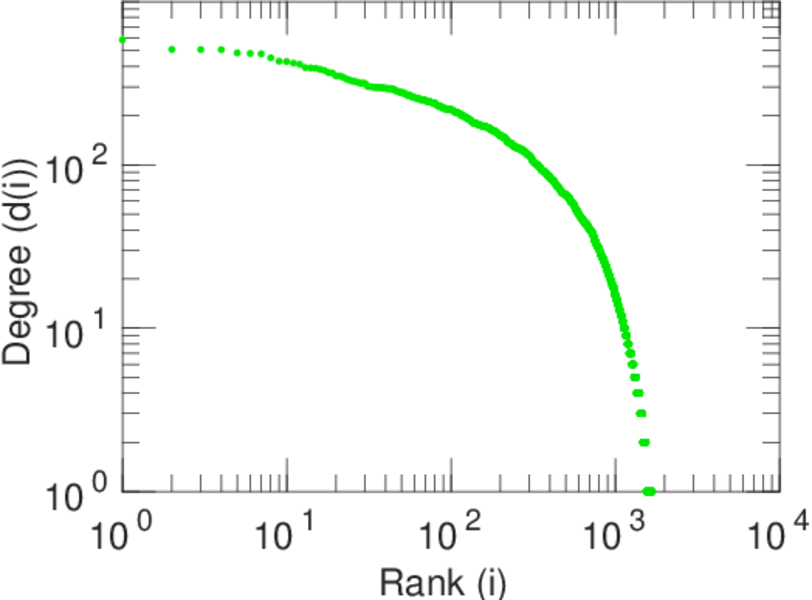
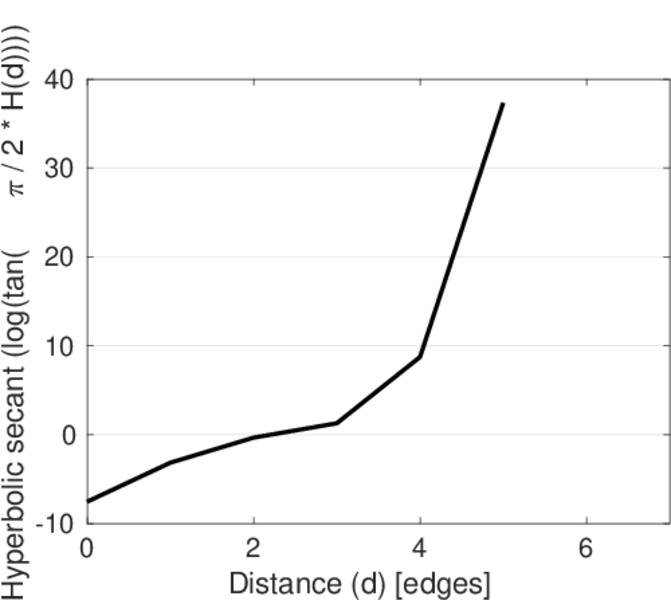
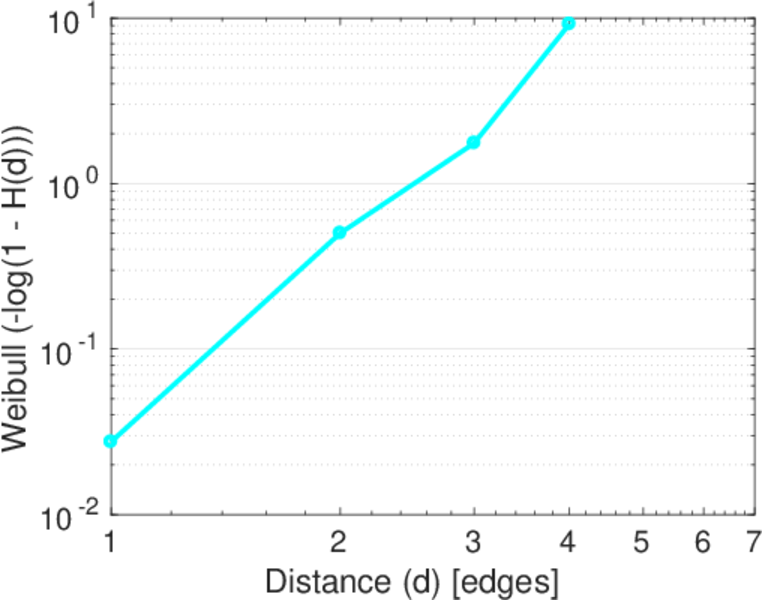
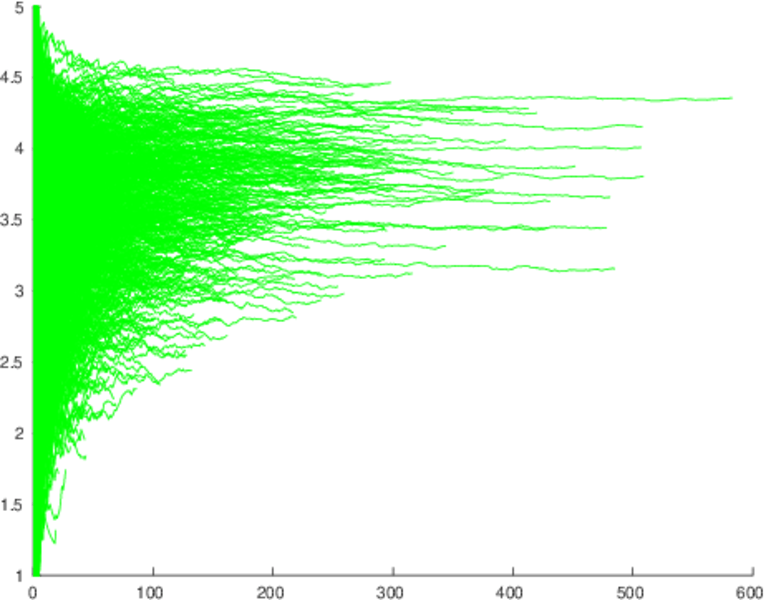
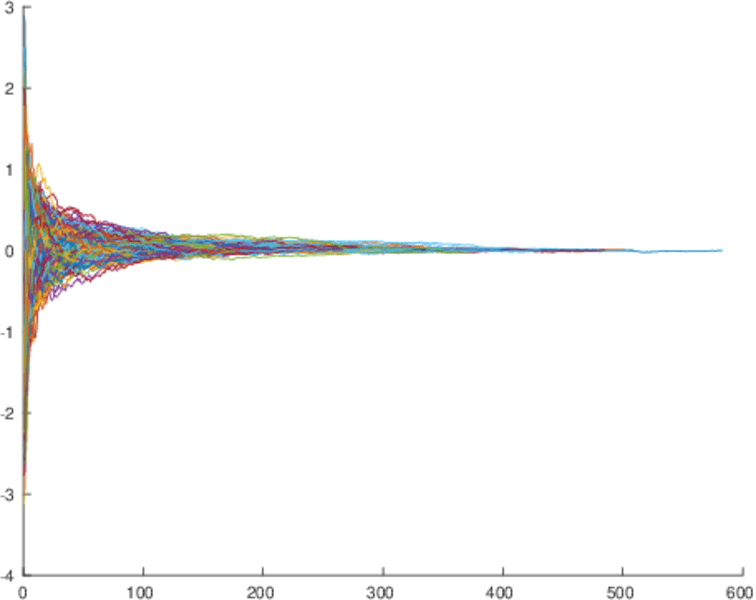
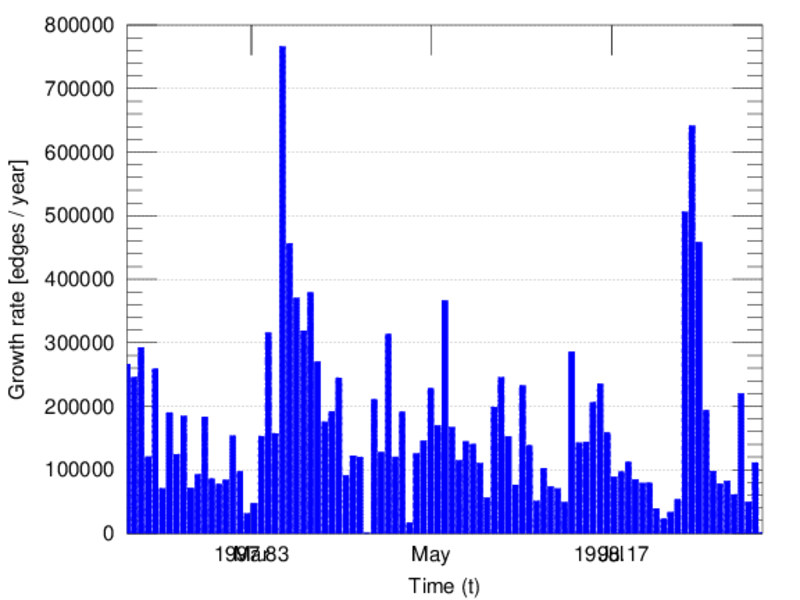
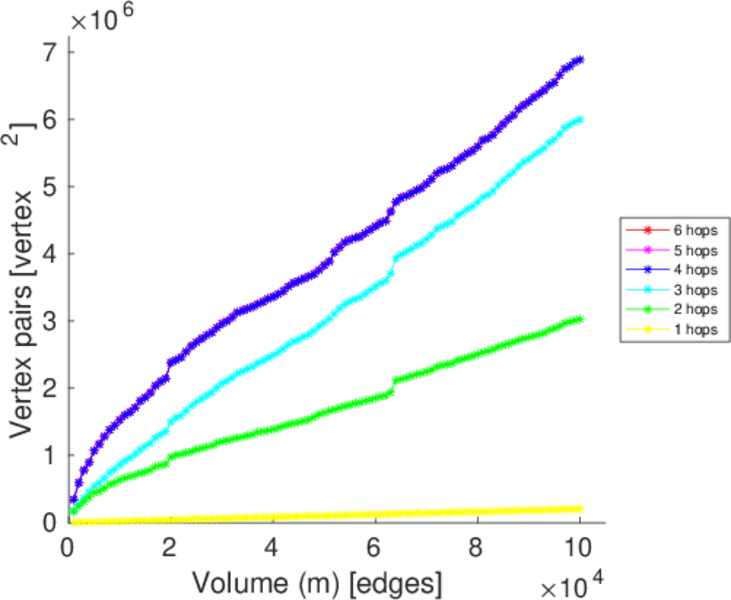
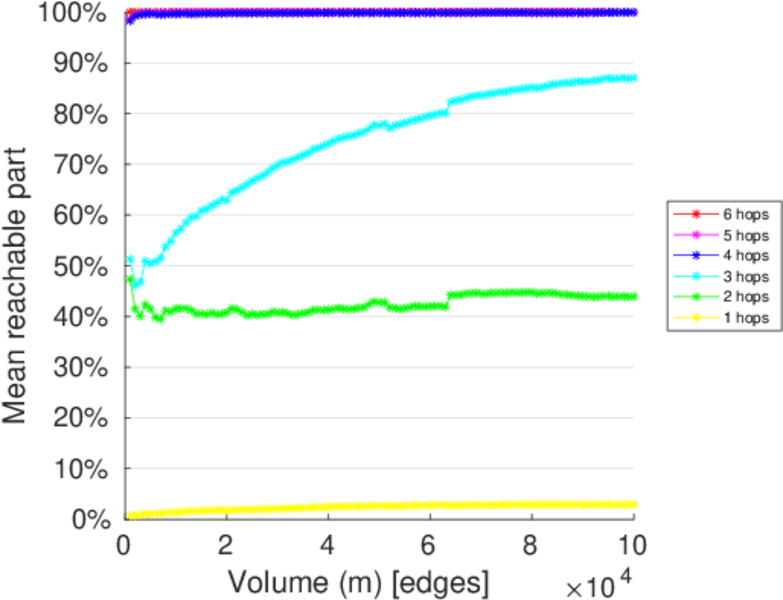
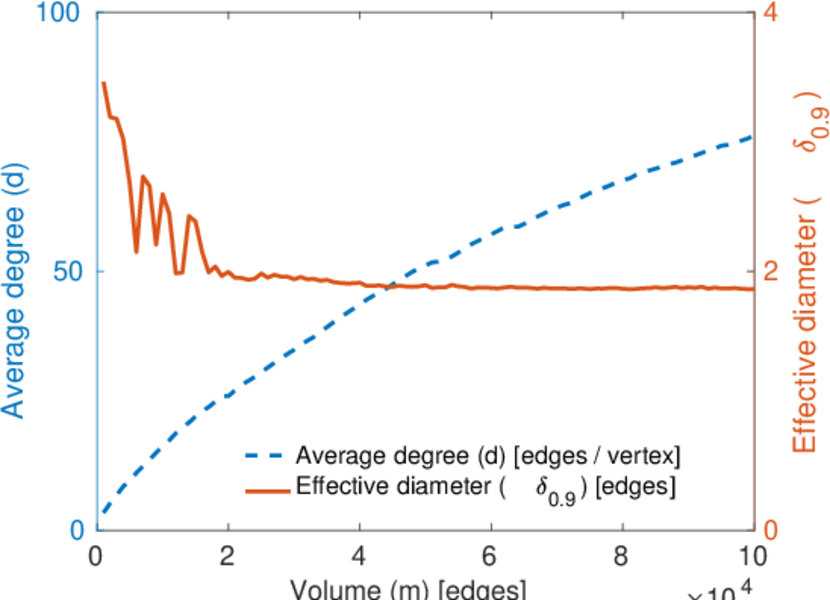
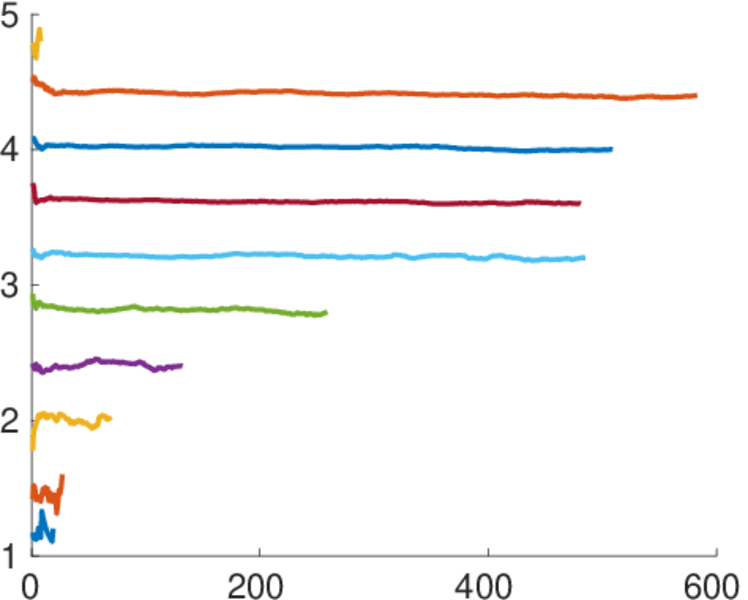
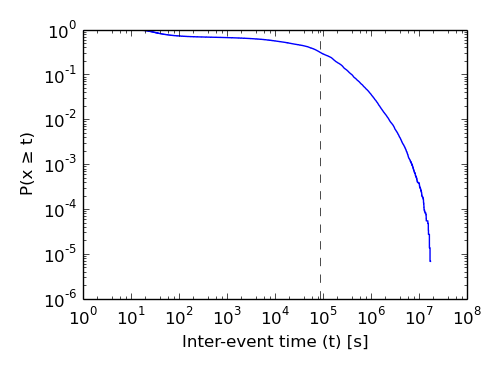
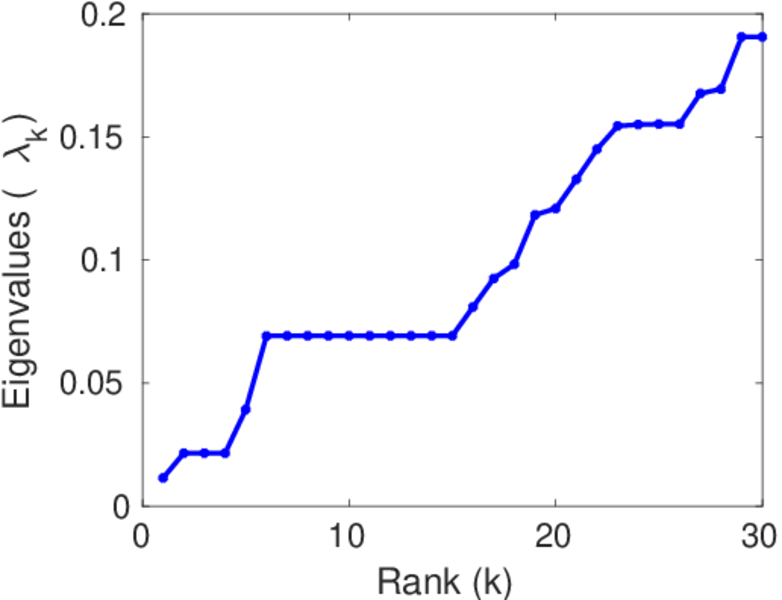
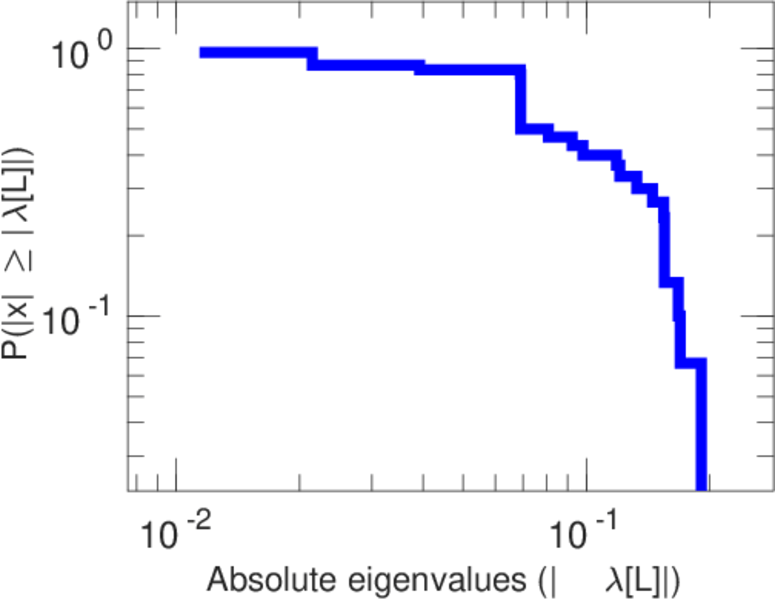
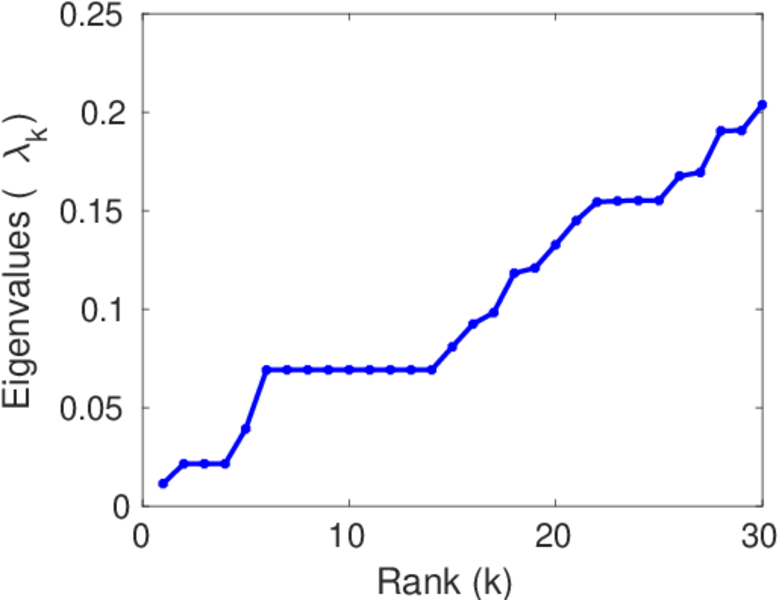
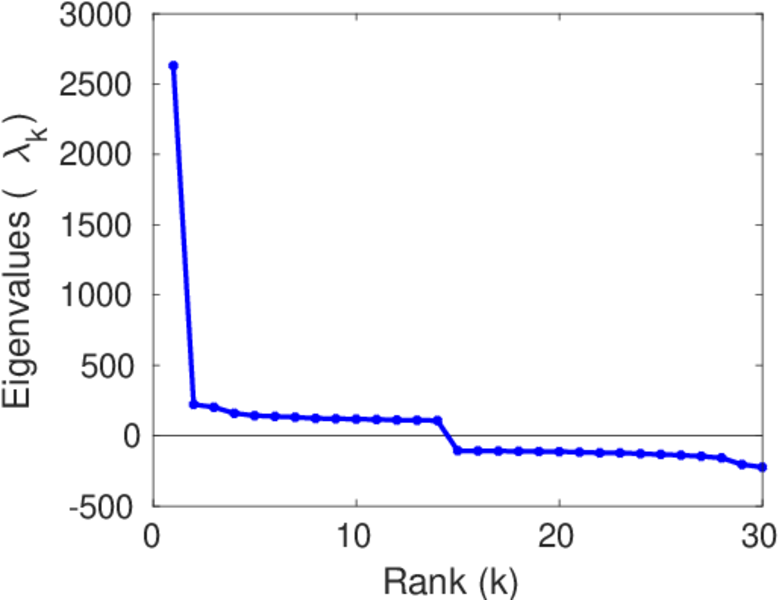
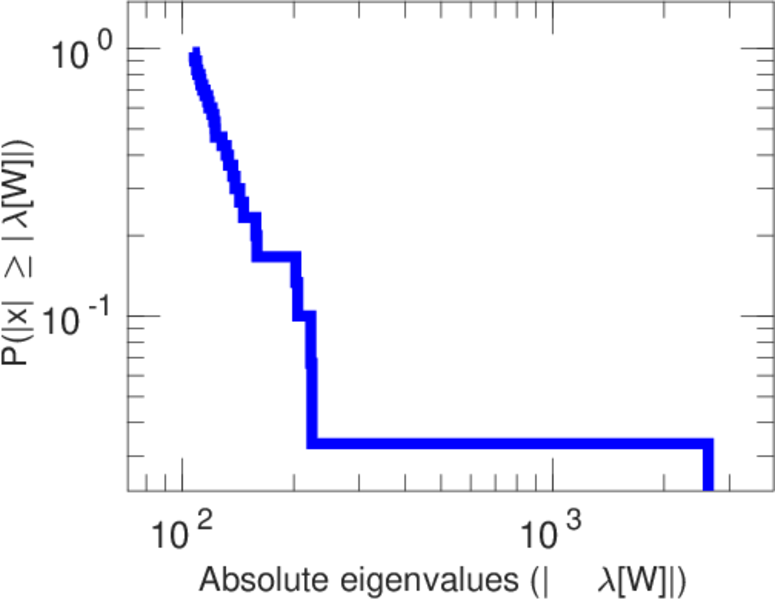
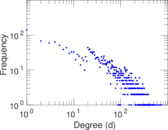
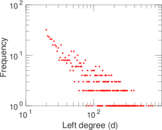
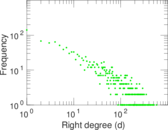
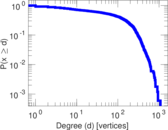
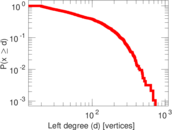
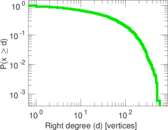
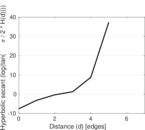
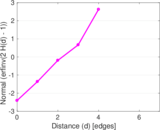
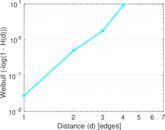
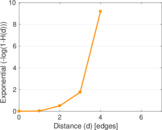
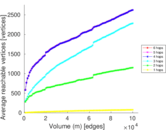
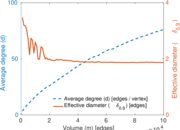
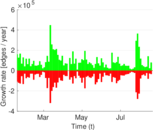
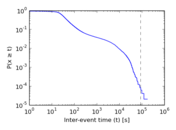
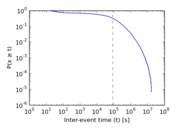
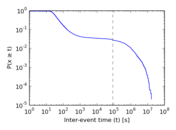
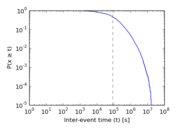
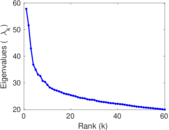
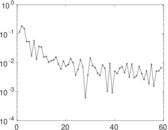
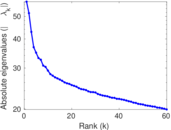
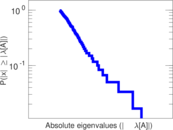
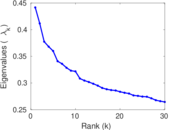
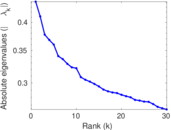
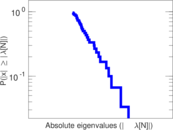
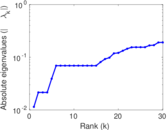
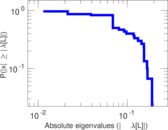
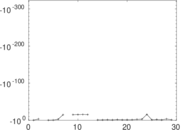
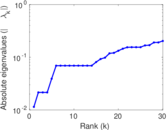
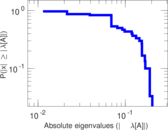
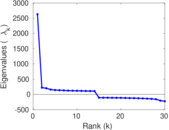
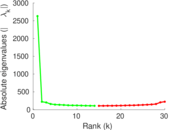
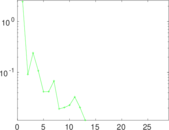
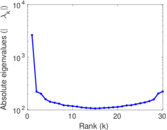
Plots


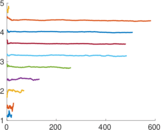
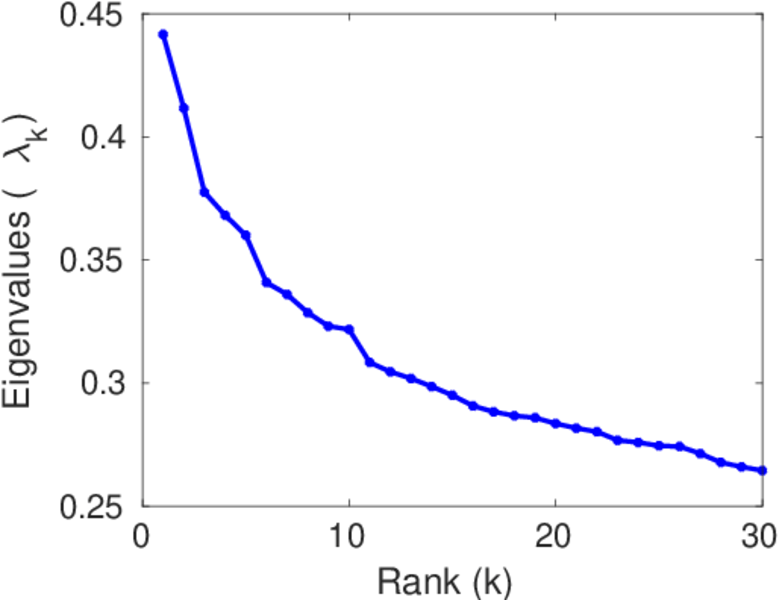
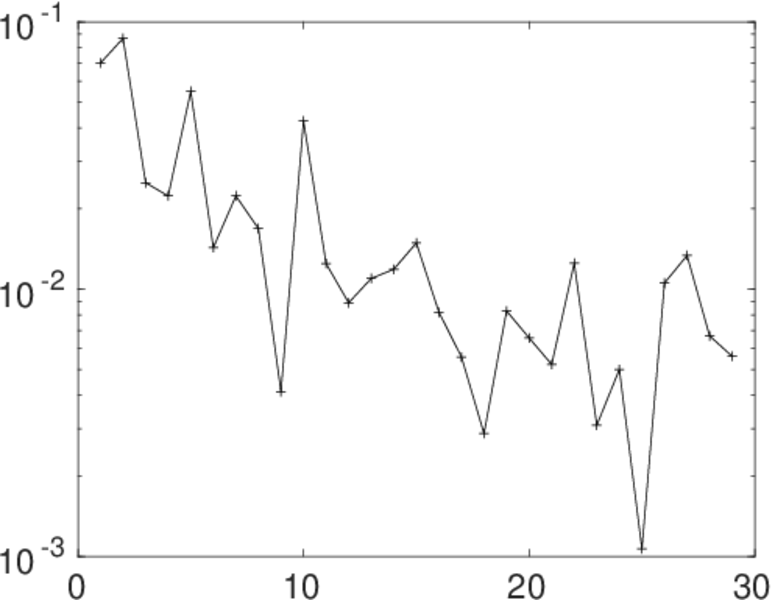
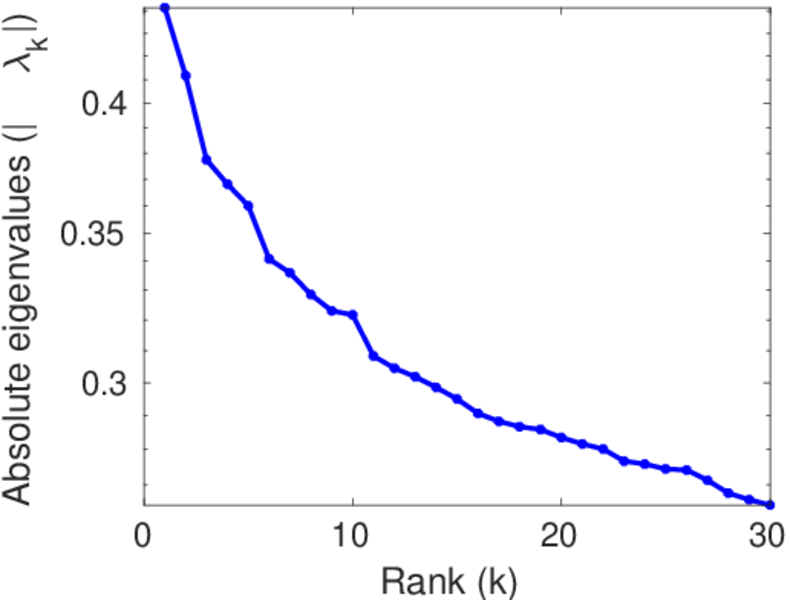
Matrix decompositions plots


Downloads
References
|
[1]
|
Jérôme Kunegis.
KONECT – The Koblenz Network Collection.
In Proc. Int. Conf. on World Wide Web Companion, pages
1343–1350, 2013.
[ http ]
|
|
[2]
|
GroupLens Research.
MovieLens data sets.
http://www.grouplens.org/node/73, October 2006.
|
 KONECT ‣ Networks ‣
Buy Me a Coffee
KONECT ‣ Networks ‣
Buy Me a Coffee