MovieLens 10M
This bipartite network contains ten million movie ratings from
http://movielens.umn.edu/. Left nodes are users and right nodes are movies. An
edge between a user and a movie indicates that the user has rated the movie
with the rating value attached to the edge.
Metadata
Statistics
| Size | n = | 80,555
|
| Left size | n1 = | 69,878
|
| Right size | n2 = | 10,677
|
| Volume | m = | 10,000,054
|
| Wedge count | s = | 40,053,435,221
|
| Claw count | z = | 192,388,462,626,632
|
| Cross count | x = | 992,182,227,743,663,616
|
| Square count | q = | 1,197,019,065,804
|
| 4-Tour count | T4 = | 9,736,390,797,092
|
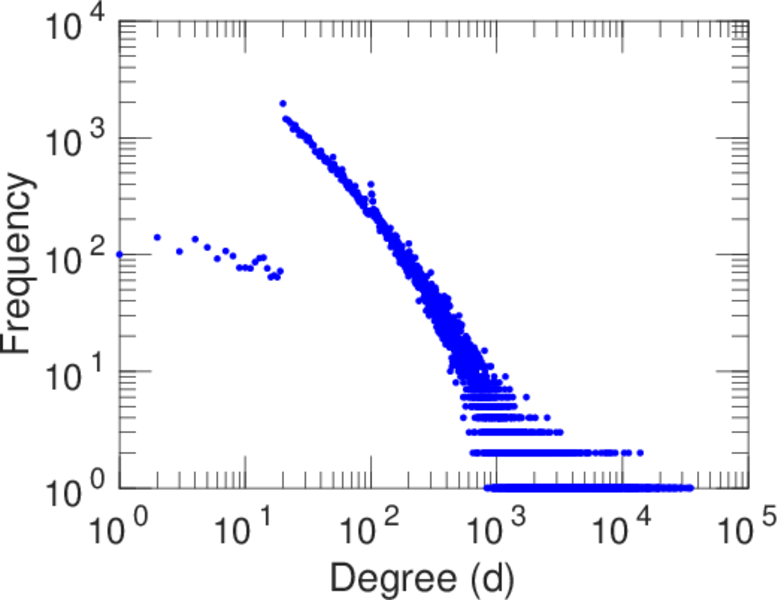
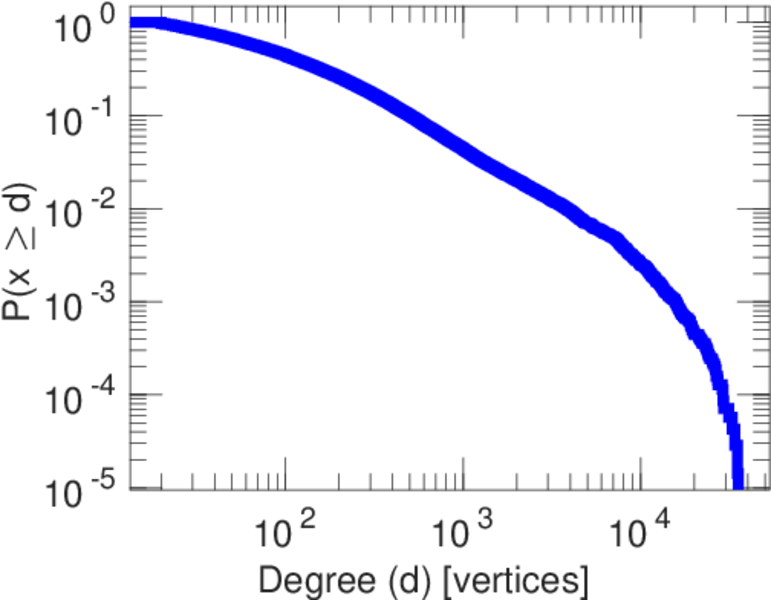
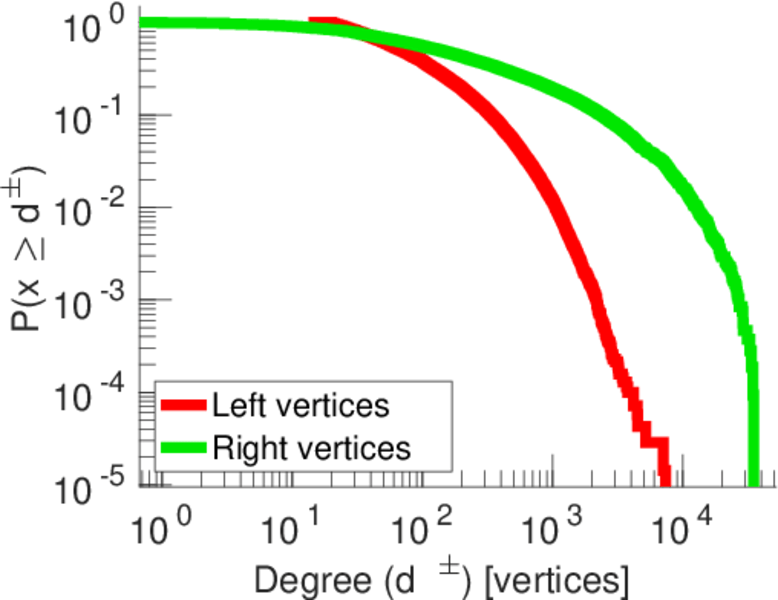
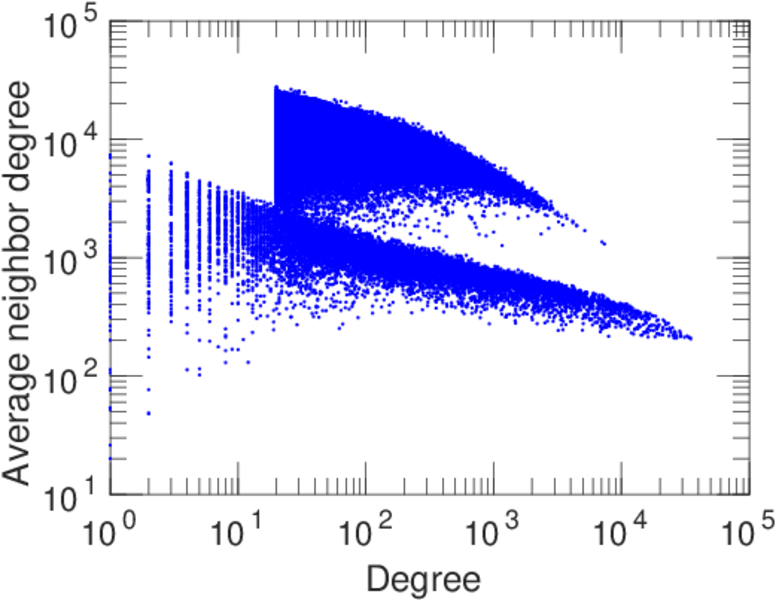
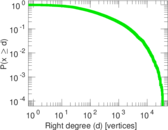
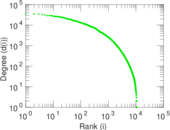
| Maximum degree | dmax = | 34,864
|
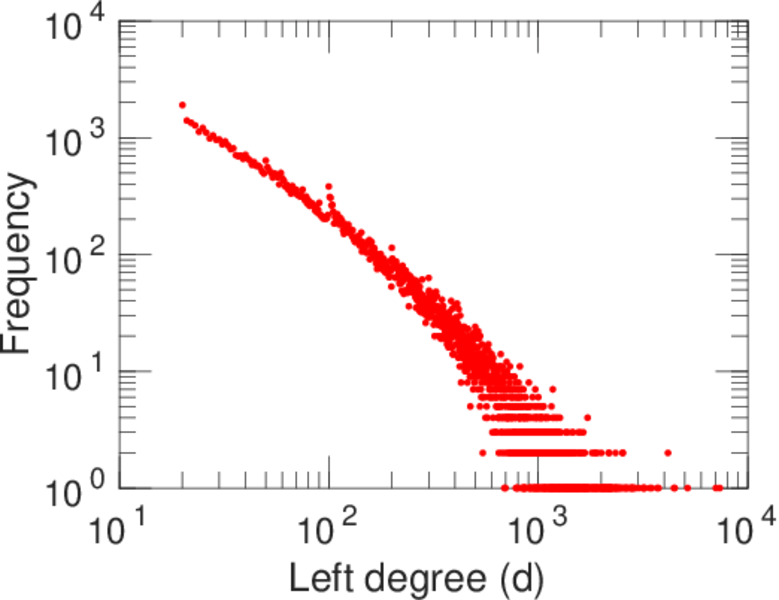
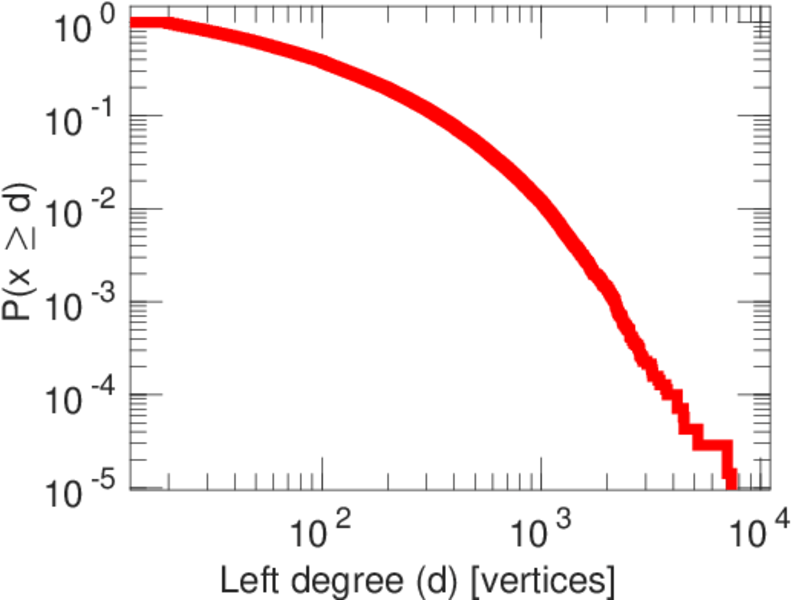
| Maximum left degree | d1max = | 7,359
|
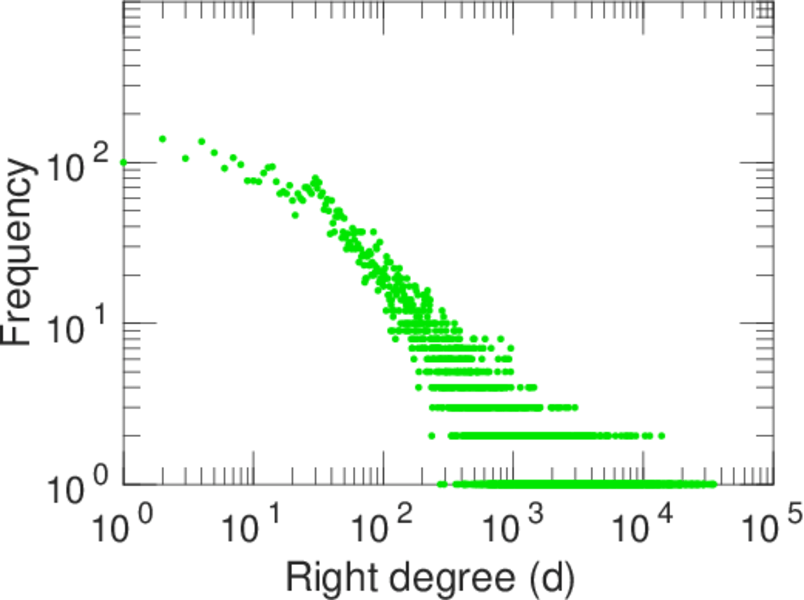
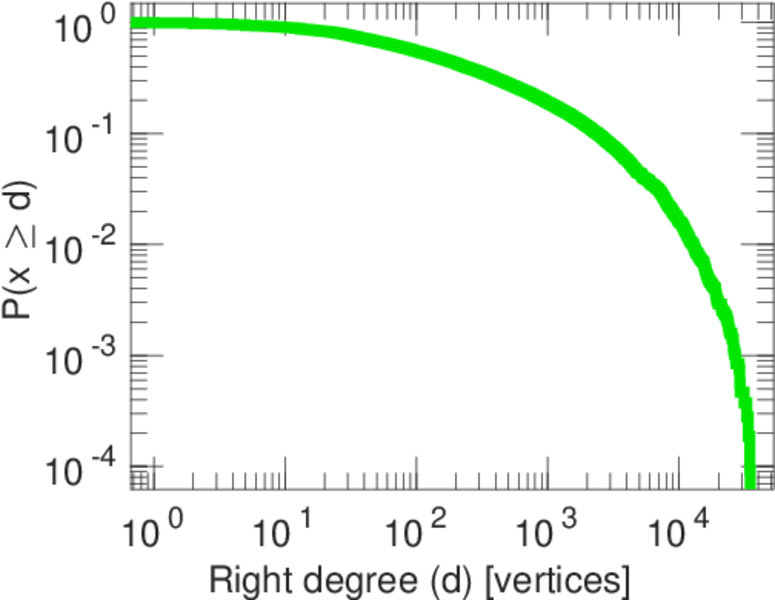
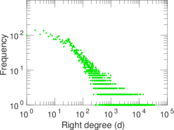
| Maximum right degree | d2max = | 34,864
|
| Average degree | d = | 248.279
|
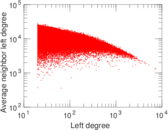
| Average left degree | d1 = | 143.107
|
| Average right degree | d2 = | 936.598
|
| Fill | p = | 0.013 403 3
|
| Size of LCC | N = | 80,555
|
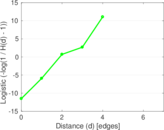
| Diameter | δ = | 6
|
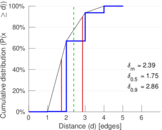
| 50-Percentile effective diameter | δ0.5 = | 1.745 33
|
| 90-Percentile effective diameter | δ0.9 = | 2.862 55
|
| Median distance | δM = | 2
|
| Mean distance | δm = | 2.390 74
|
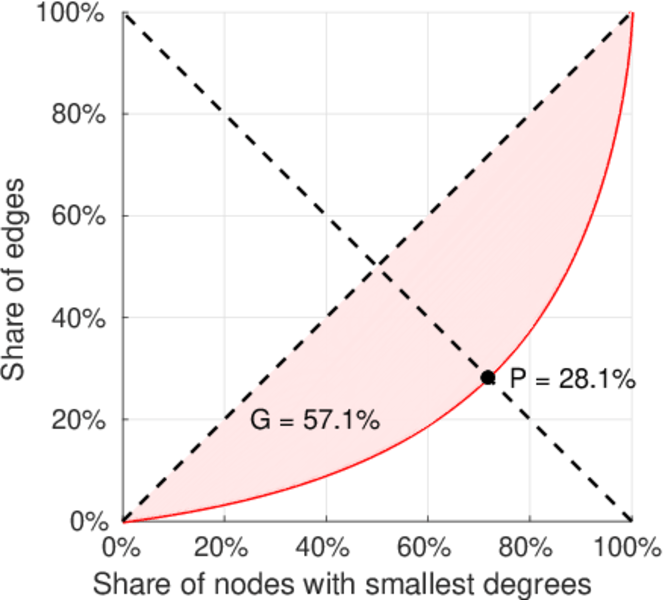
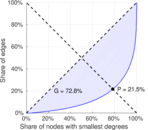
| Gini coefficient | G = | 0.728 263
|
| Balanced inequality ratio | P = | 0.214 399
|
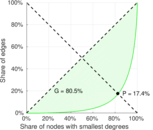
| Left balanced inequality ratio | P1 = | 0.280 829
|
| Right balanced inequality ratio | P2 = | 0.174 351
|
| Relative edge distribution entropy | Her = | 0.875 075
|
| Power law exponent | γ = | 1.223 83
|
| Tail power law exponent | γt = | 1.841 00
|
| Degree assortativity | ρ = | −0.243 136
|
| Degree assortativity p-value | pρ = | 0.000 00
|
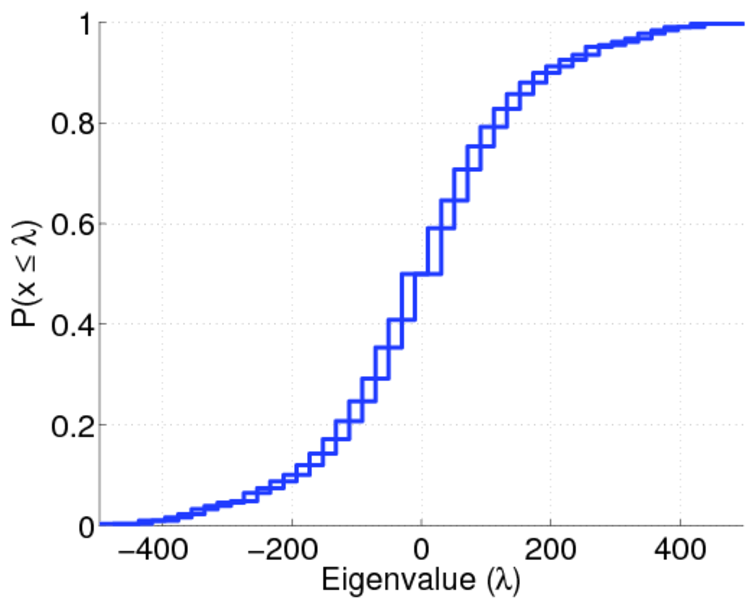
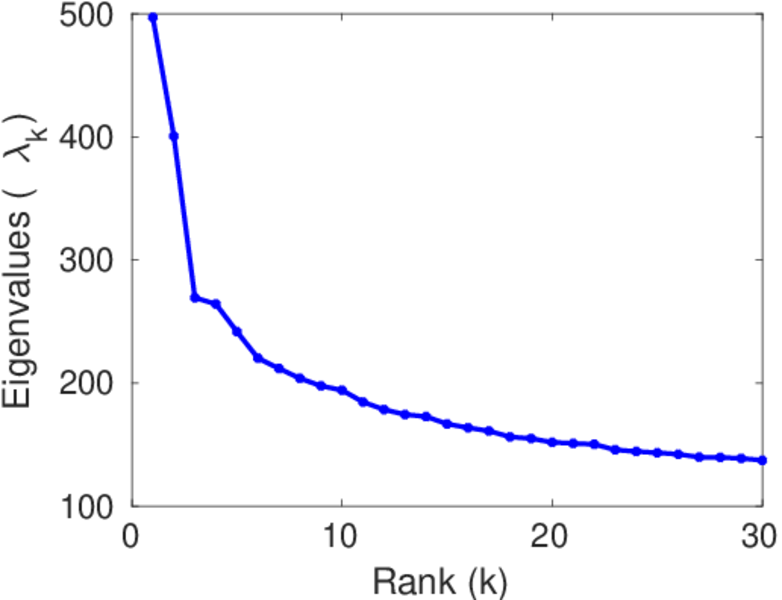
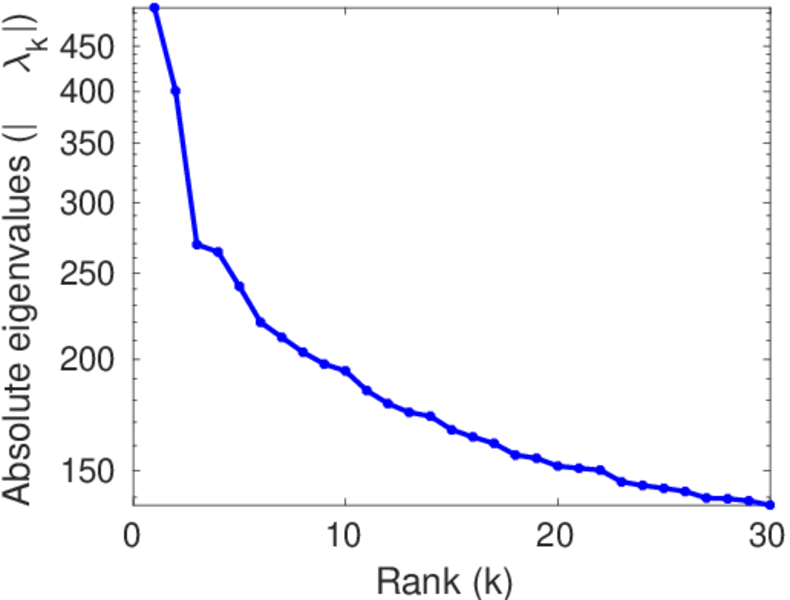
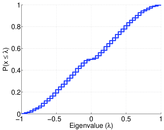
| Spectral norm | α = | 496.970
|
| Algebraic connectivity | a = | 0.015 709 5
|
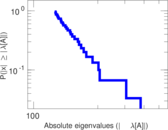
| Spectral separation | |λ1[A] / λ2[A]| = | 1.240 89
|
| Negativity | ζ = | 0.453 414
|
| Algebraic conflict | ξ = | 0.947 072
|
| Spectral signed frustration | φ = | 0.000 953 637
|
| Controllability | C = | 59,515
|
| Relative controllability | Cr = | 0.738 812
|
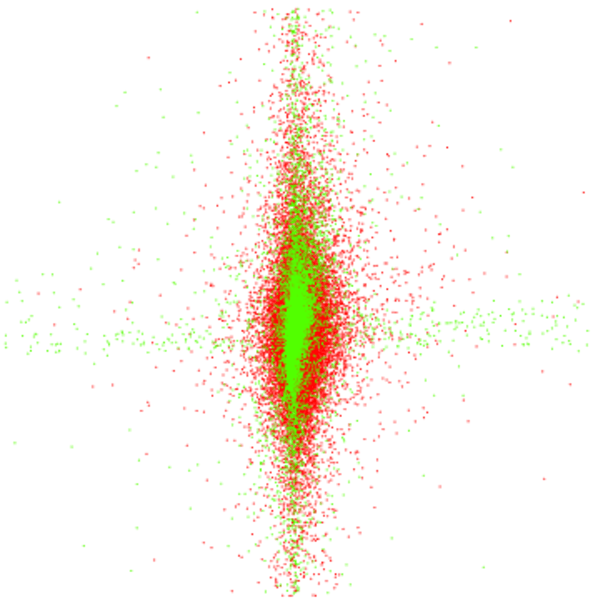
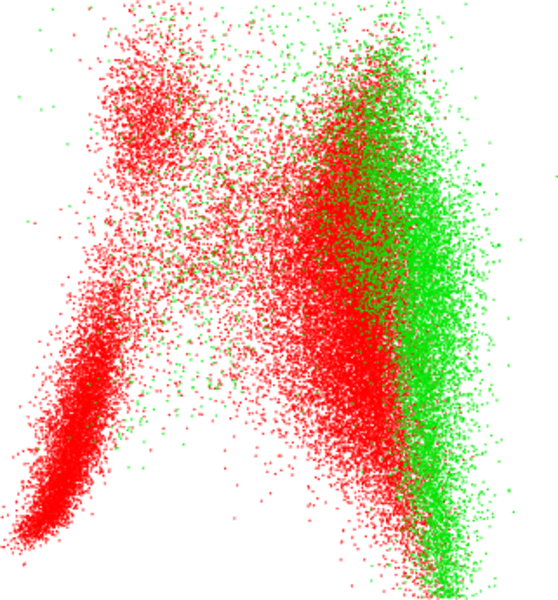
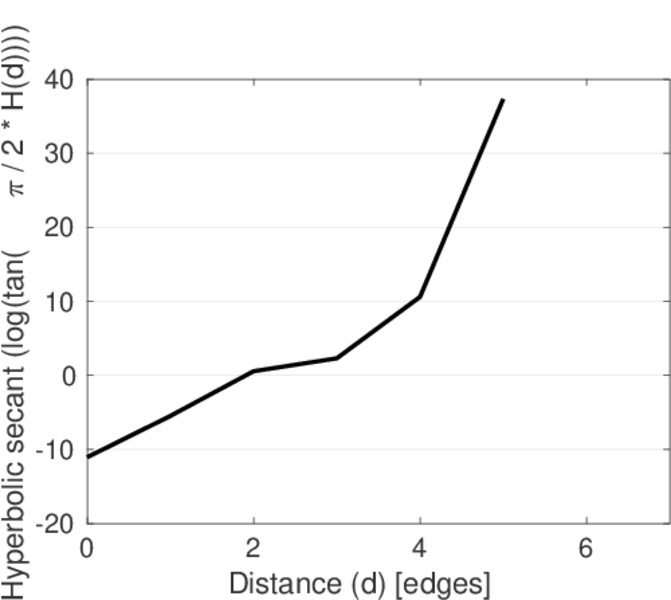
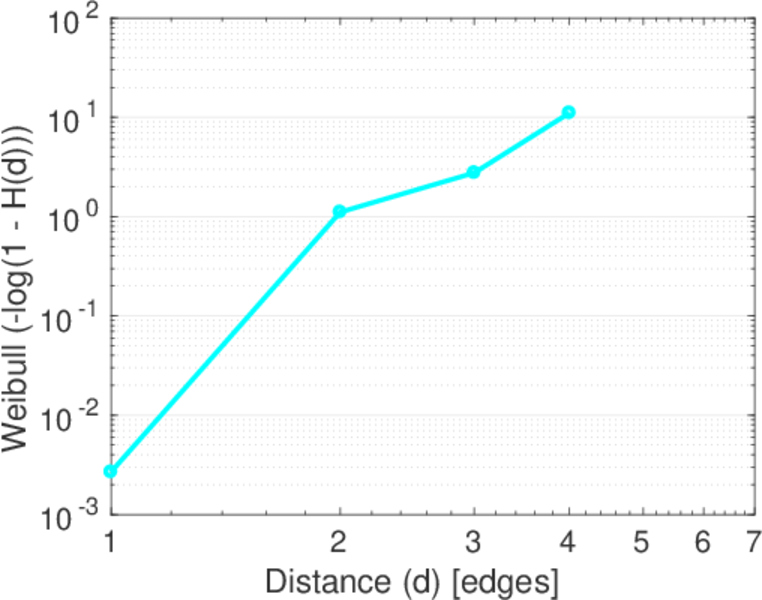
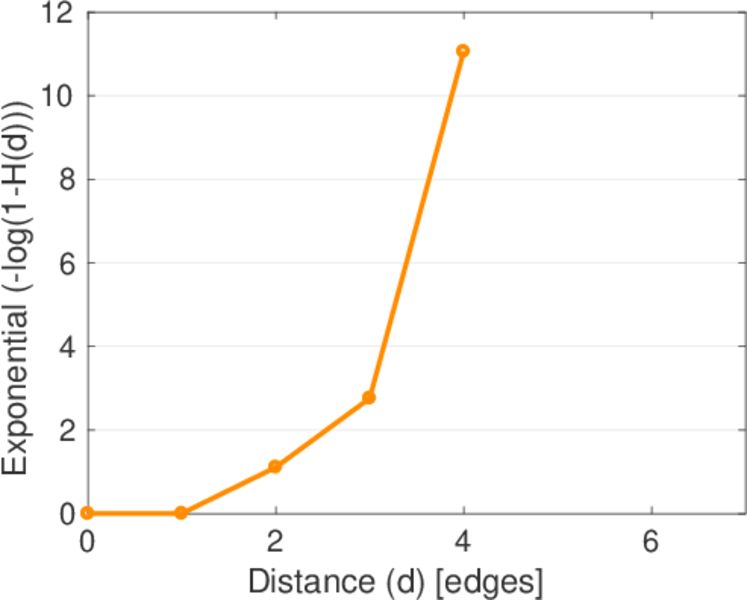
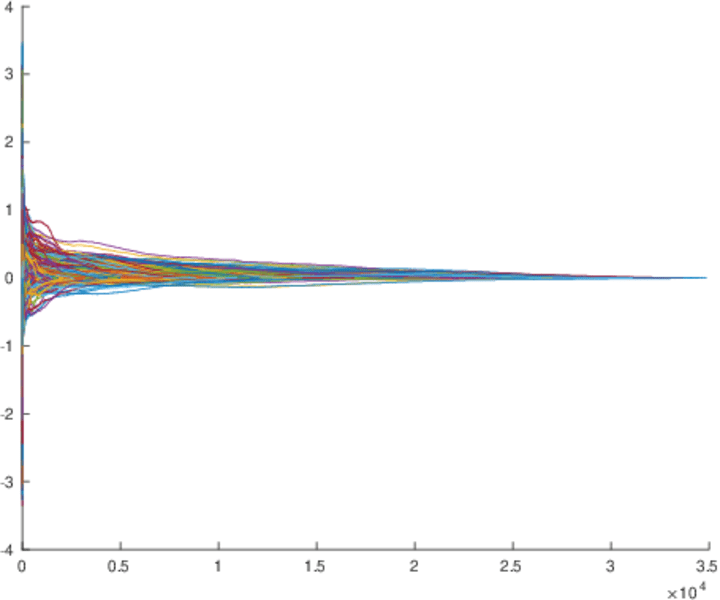
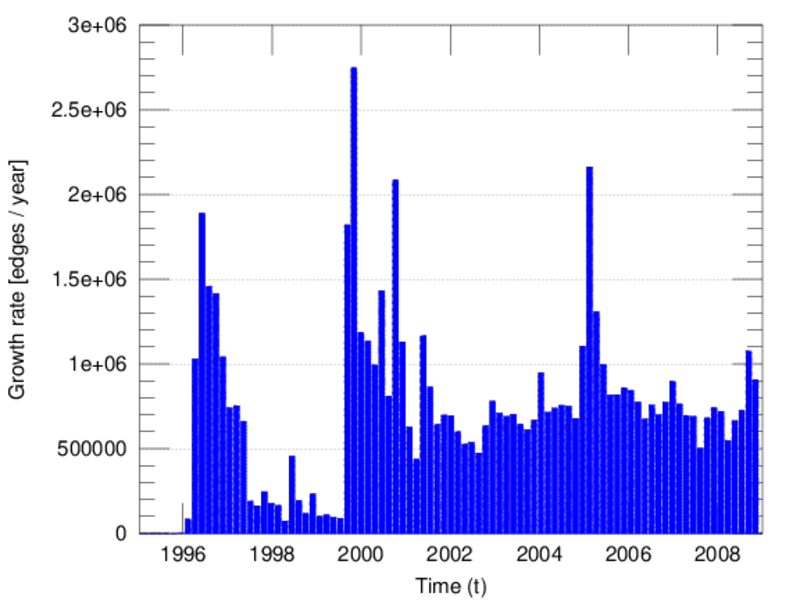
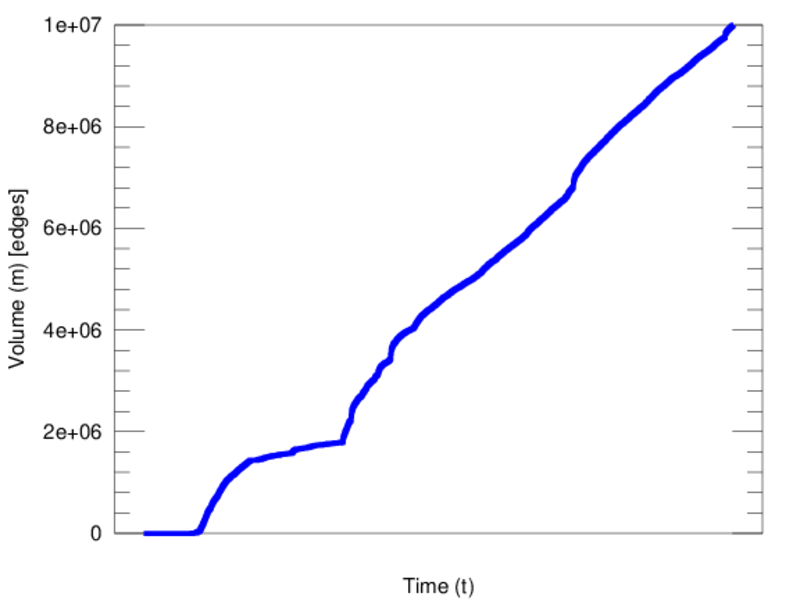
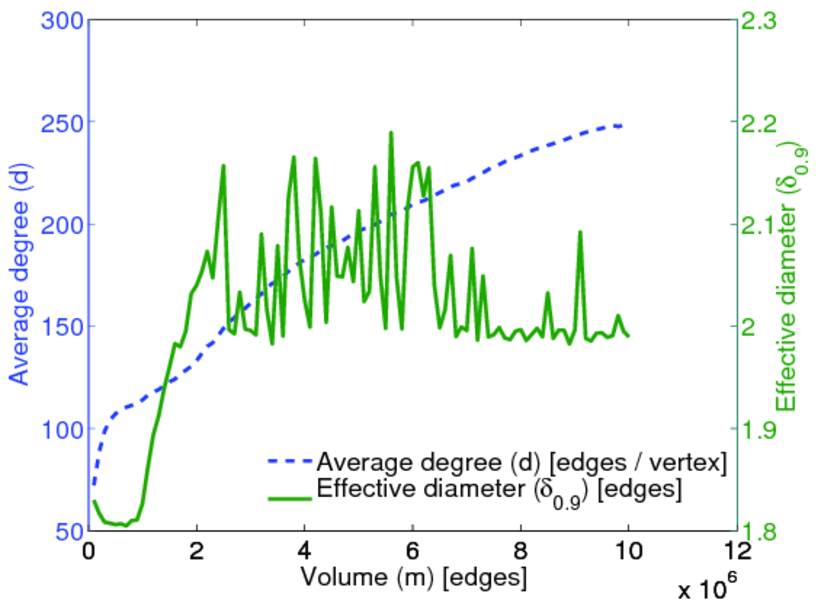
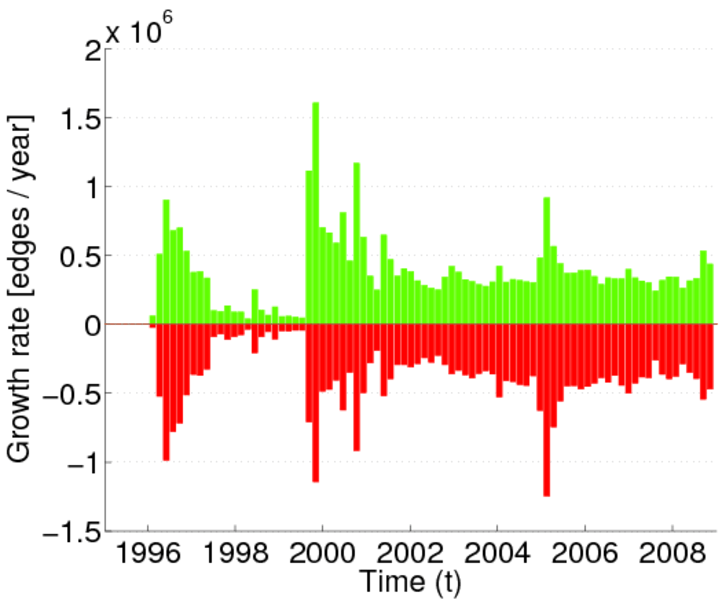
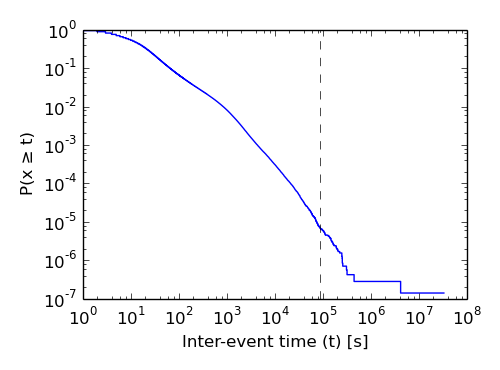
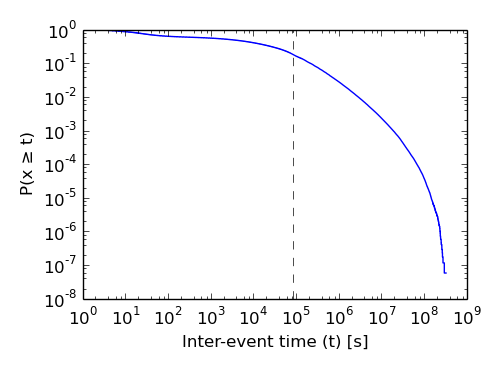
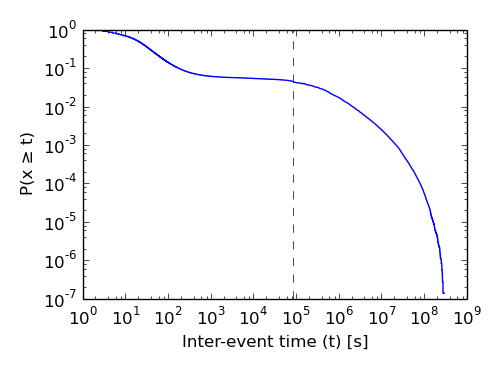
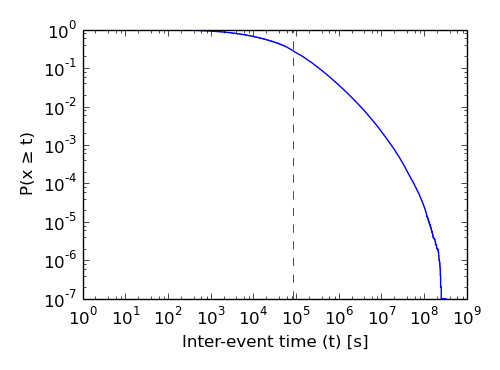
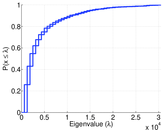
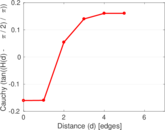
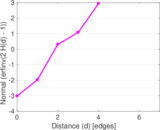
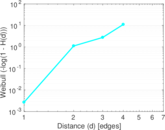
Plots


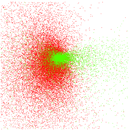
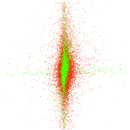
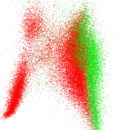


Matrix decompositions plots


Downloads
References
|
[1]
|
Jérôme Kunegis.
KONECT – The Koblenz Network Collection.
In Proc. Int. Conf. on World Wide Web Companion, pages
1343–1350, 2013.
[ http ]
|
|
[2]
|
GroupLens Research.
MovieLens data sets.
http://www.grouplens.org/node/73, October 2006.
|
 KONECT ‣ Networks ‣
Buy Me a Coffee
KONECT ‣ Networks ‣
Buy Me a Coffee