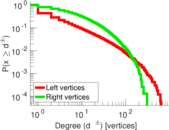
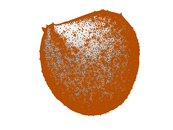
MovieLens tag–item
This bipartite network consists of 100,000 tags applied to 10,000 movies from
http://movielens.umn.edu/. Left nodes are tags and right nodes are movies. An
edge shows that a tag was applied to a movie.
Metadata
Statistics
| Size | n = | 24,129
|
| Left size | n1 = | 16,528
|
| Right size | n2 = | 7,601
|
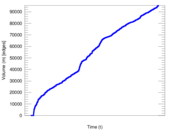
| Volume | m = | 95,580
|
| Unique edge count | m̿ = | 71,154
|
| Wedge count | s = | 3,229,651
|
| Claw count | z = | 205,226,828
|
| Cross count | x = | 18,155,774,783
|
| Square count | q = | 959,491
|
| 4-Tour count | T4 = | 20,740,224
|
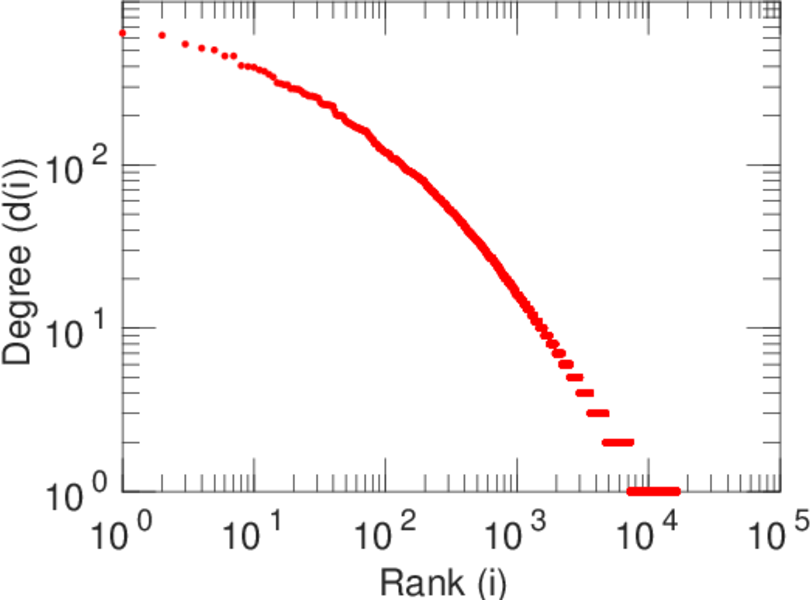
| Maximum degree | dmax = | 641
|
| Maximum left degree | d1max = | 641
|
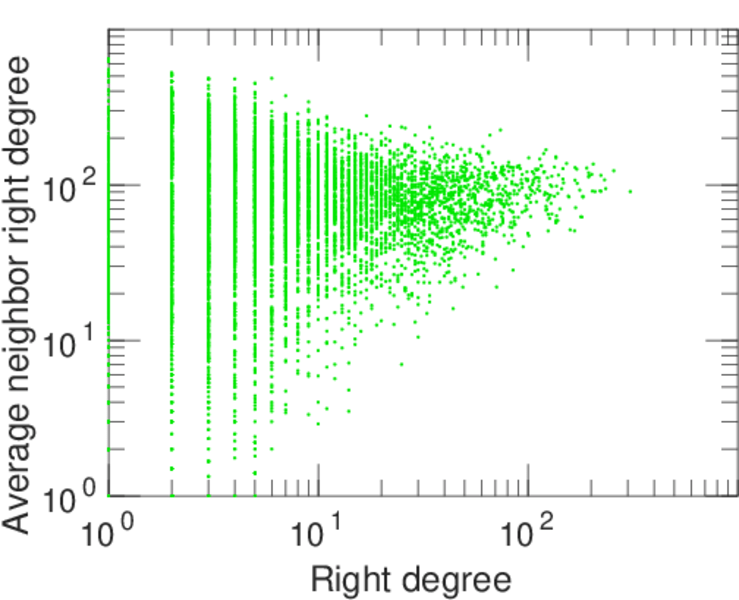
| Maximum right degree | d2max = | 308
|
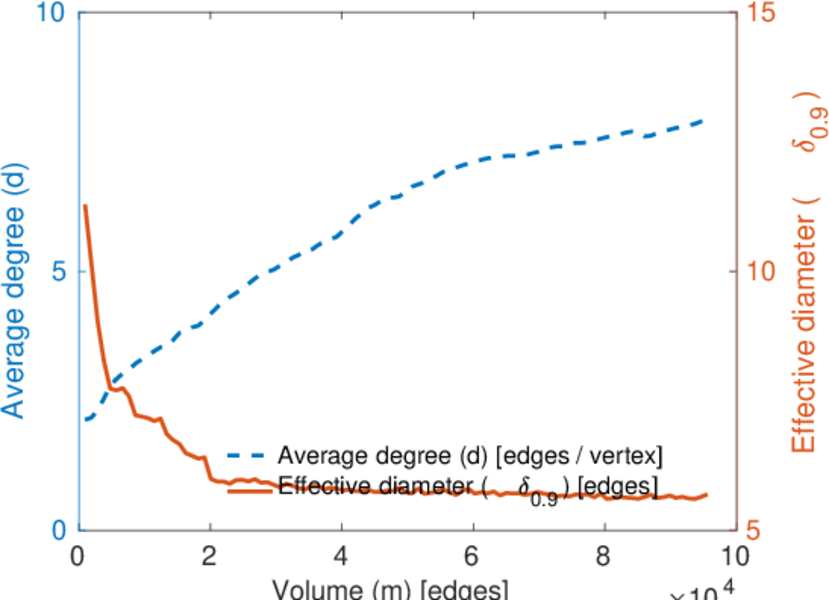
| Average degree | d = | 7.922 42
|
| Average left degree | d1 = | 5.782 91
|
| Average right degree | d2 = | 12.574 7
|
| Fill | p = | 0.000 566 380
|
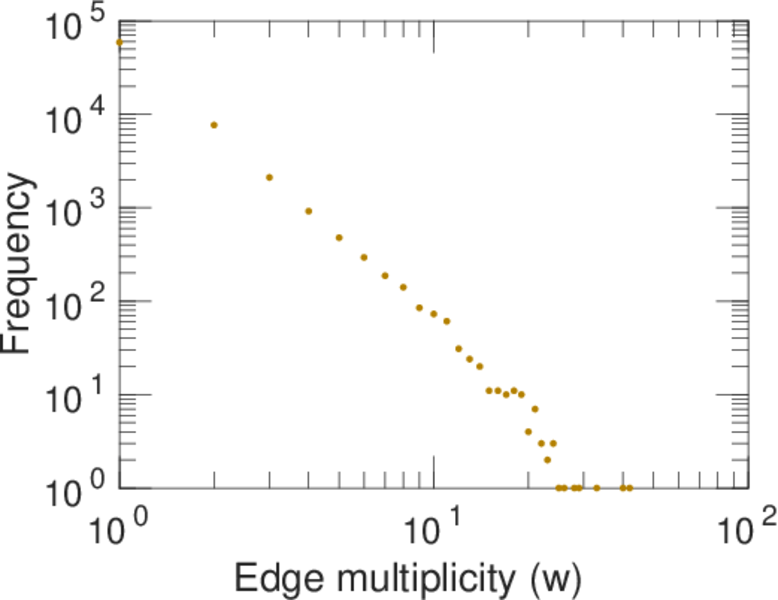
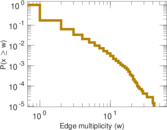
| Average edge multiplicity | m̃ = | 1.343 28
|
| Size of LCC | N = | 23,760
|
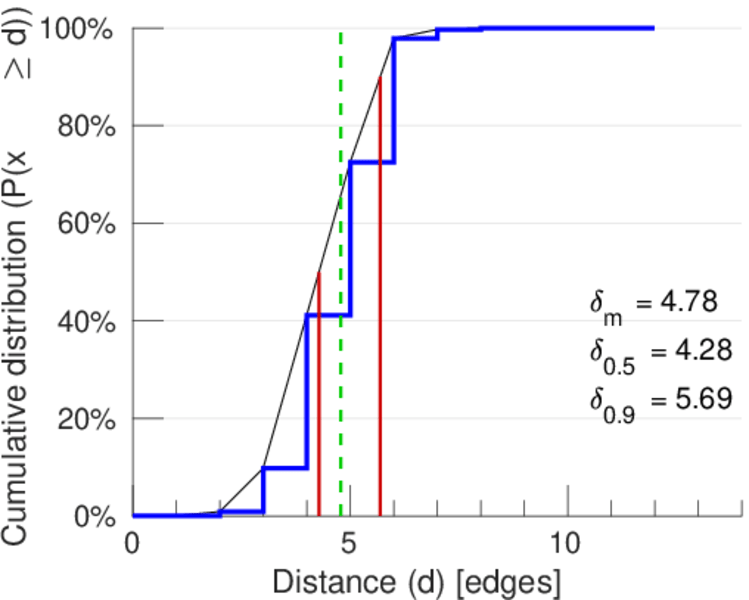
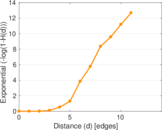
| Diameter | δ = | 14
|
| 50-Percentile effective diameter | δ0.5 = | 4.282 43
|
| 90-Percentile effective diameter | δ0.9 = | 5.690 08
|
| Median distance | δM = | 5
|
| Mean distance | δm = | 4.781 08
|
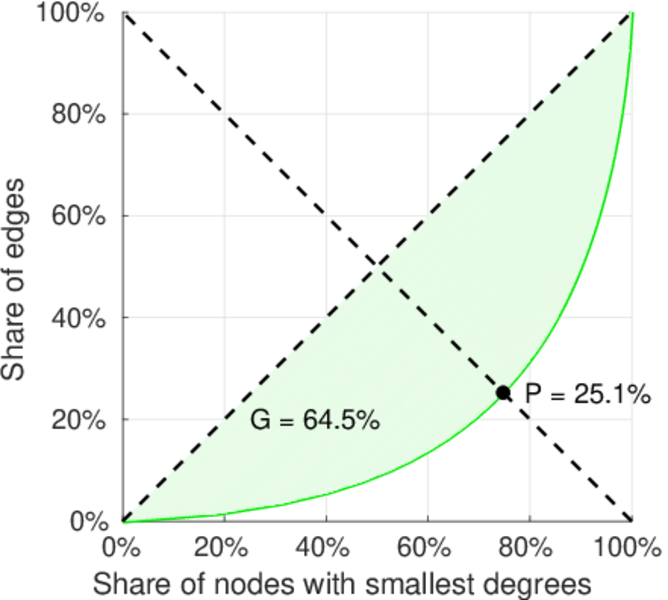
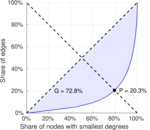
| Gini coefficient | G = | 0.743 230
|
| Balanced inequality ratio | P = | 0.202 307
|
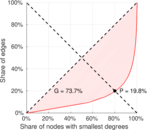
| Left balanced inequality ratio | P1 = | 0.198 347
|
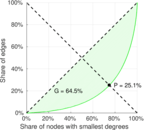
| Right balanced inequality ratio | P2 = | 0.250 983
|
| Relative edge distribution entropy | Her = | 0.894 530
|
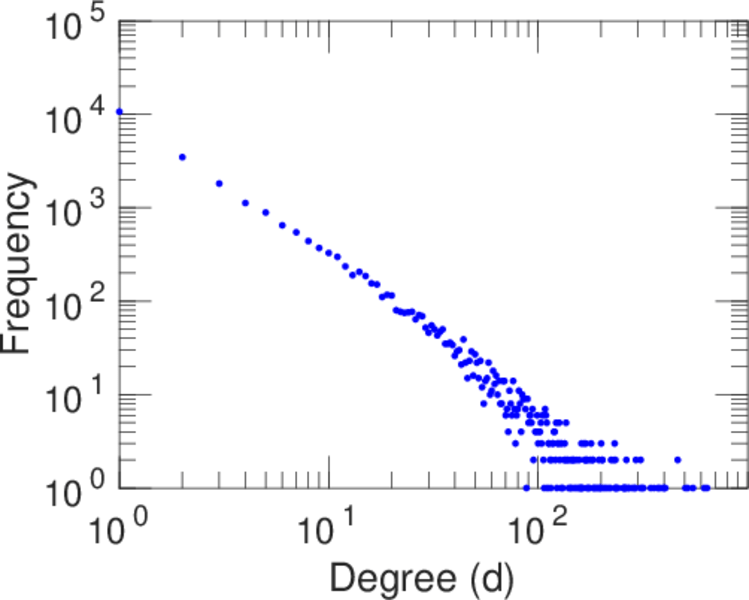
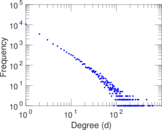
| Power law exponent | γ = | 2.122 38
|
| Tail power law exponent | γt = | 3.141 00
|
| Tail power law exponent with p | γ3 = | 3.141 00
|
| p-value | p = | 0.170 000
|
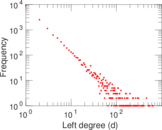
| Left tail power law exponent with p | γ3,1 = | 1.981 00
|
| Left p-value | p1 = | 0.000 00
|
| Right tail power law exponent with p | γ3,2 = | 4.201 00
|
| Right p-value | p2 = | 0.067 000 0
|
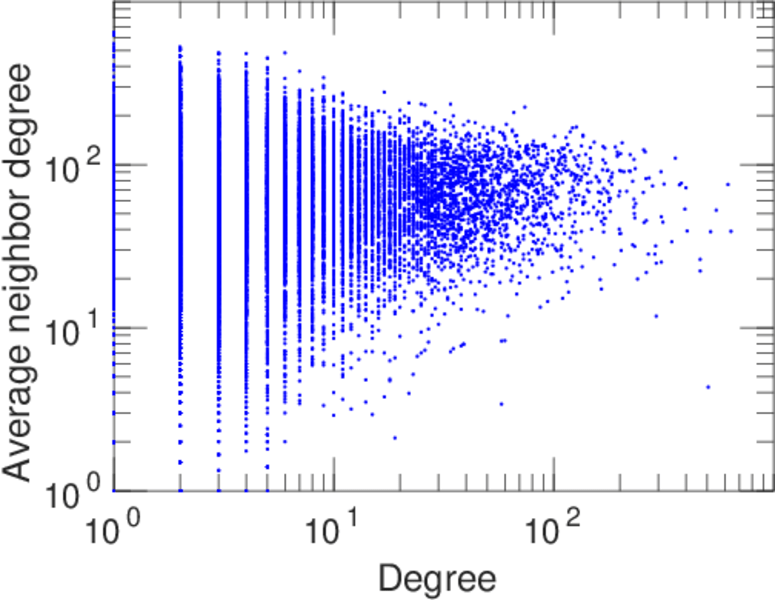
| Degree assortativity | ρ = | −0.085 398 3
|
| Degree assortativity p-value | pρ = | 2.834 24 × 10−115
|
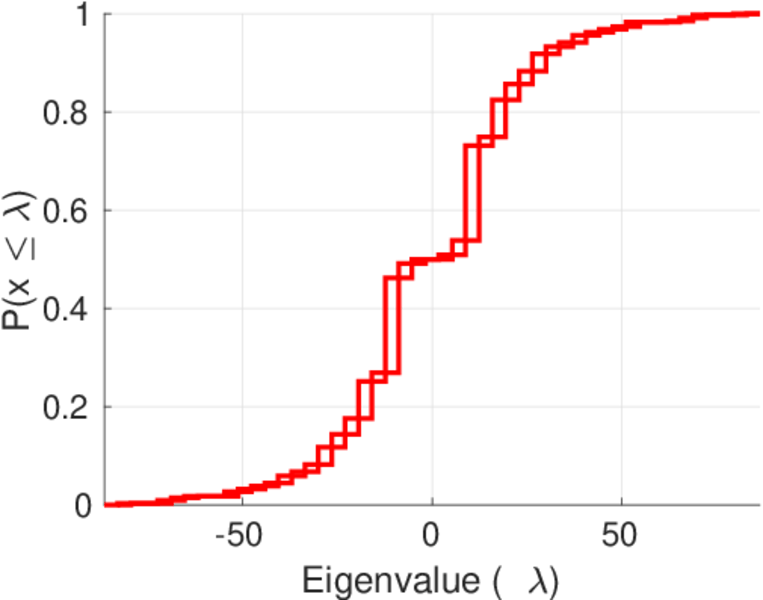
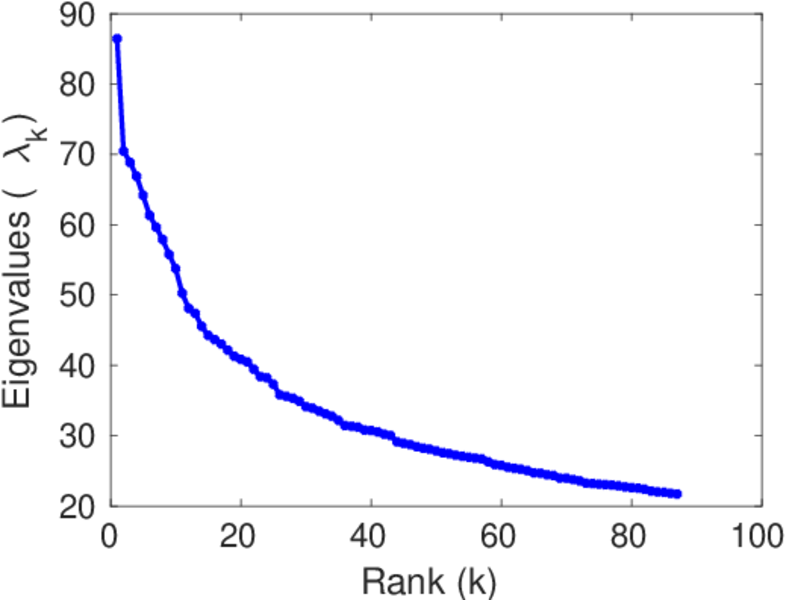
| Spectral norm | α = | 86.440 1
|
| Algebraic connectivity | a = | 0.044 767 2
|
| Spectral separation | |λ1[A] / λ2[A]| = | 1.226 55
|
| Controllability | C = | 12,418
|
| Relative controllability | Cr = | 0.514 650
|
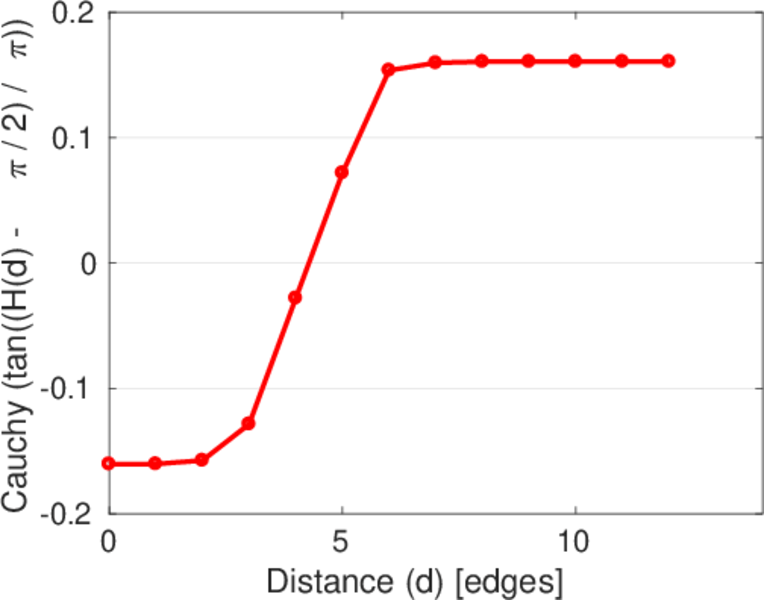
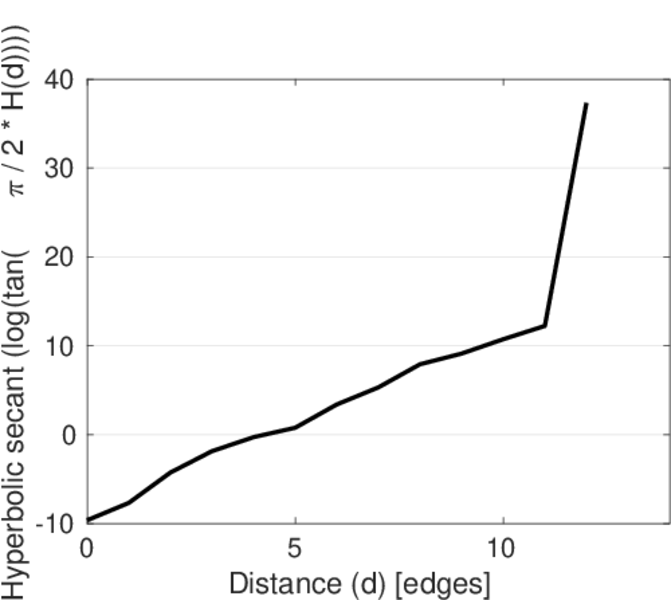
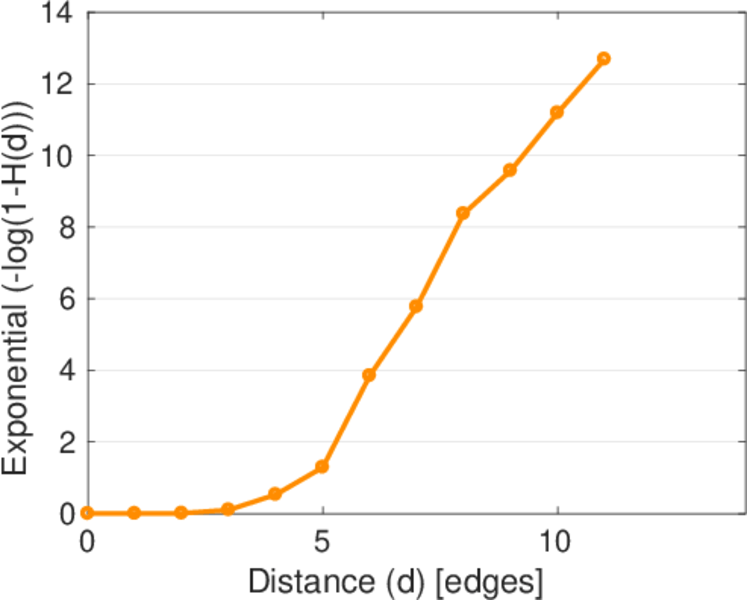
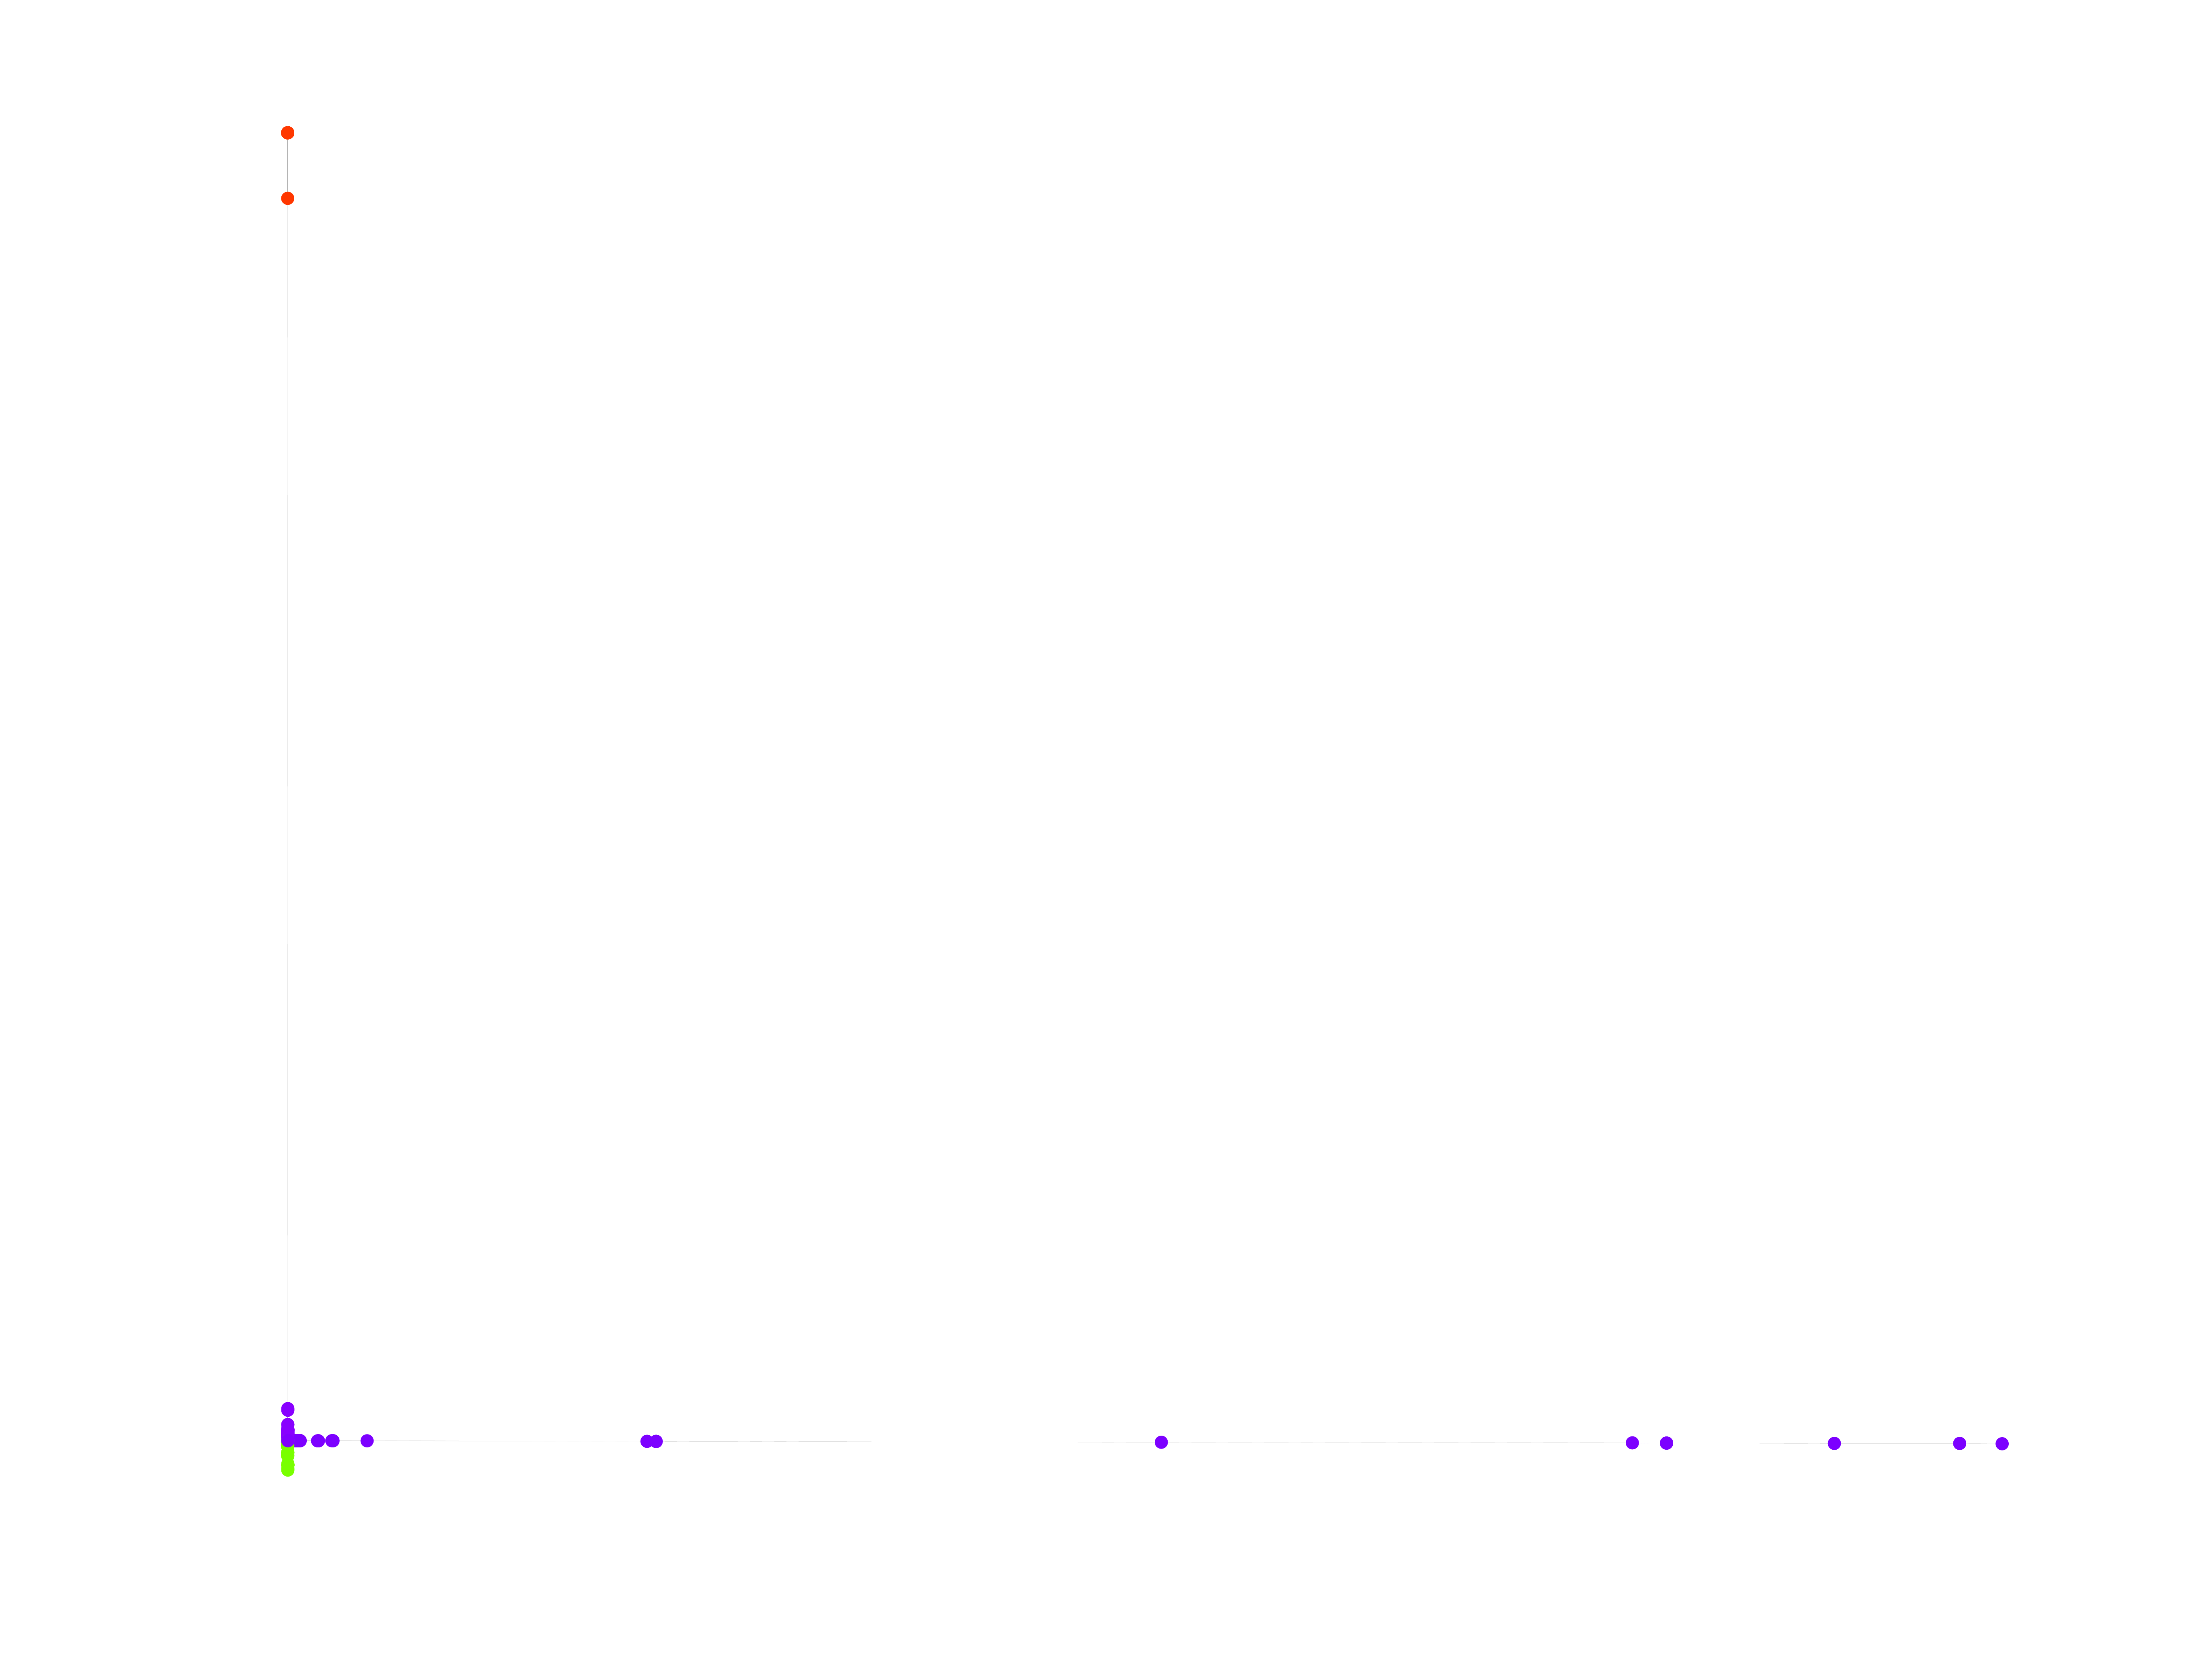
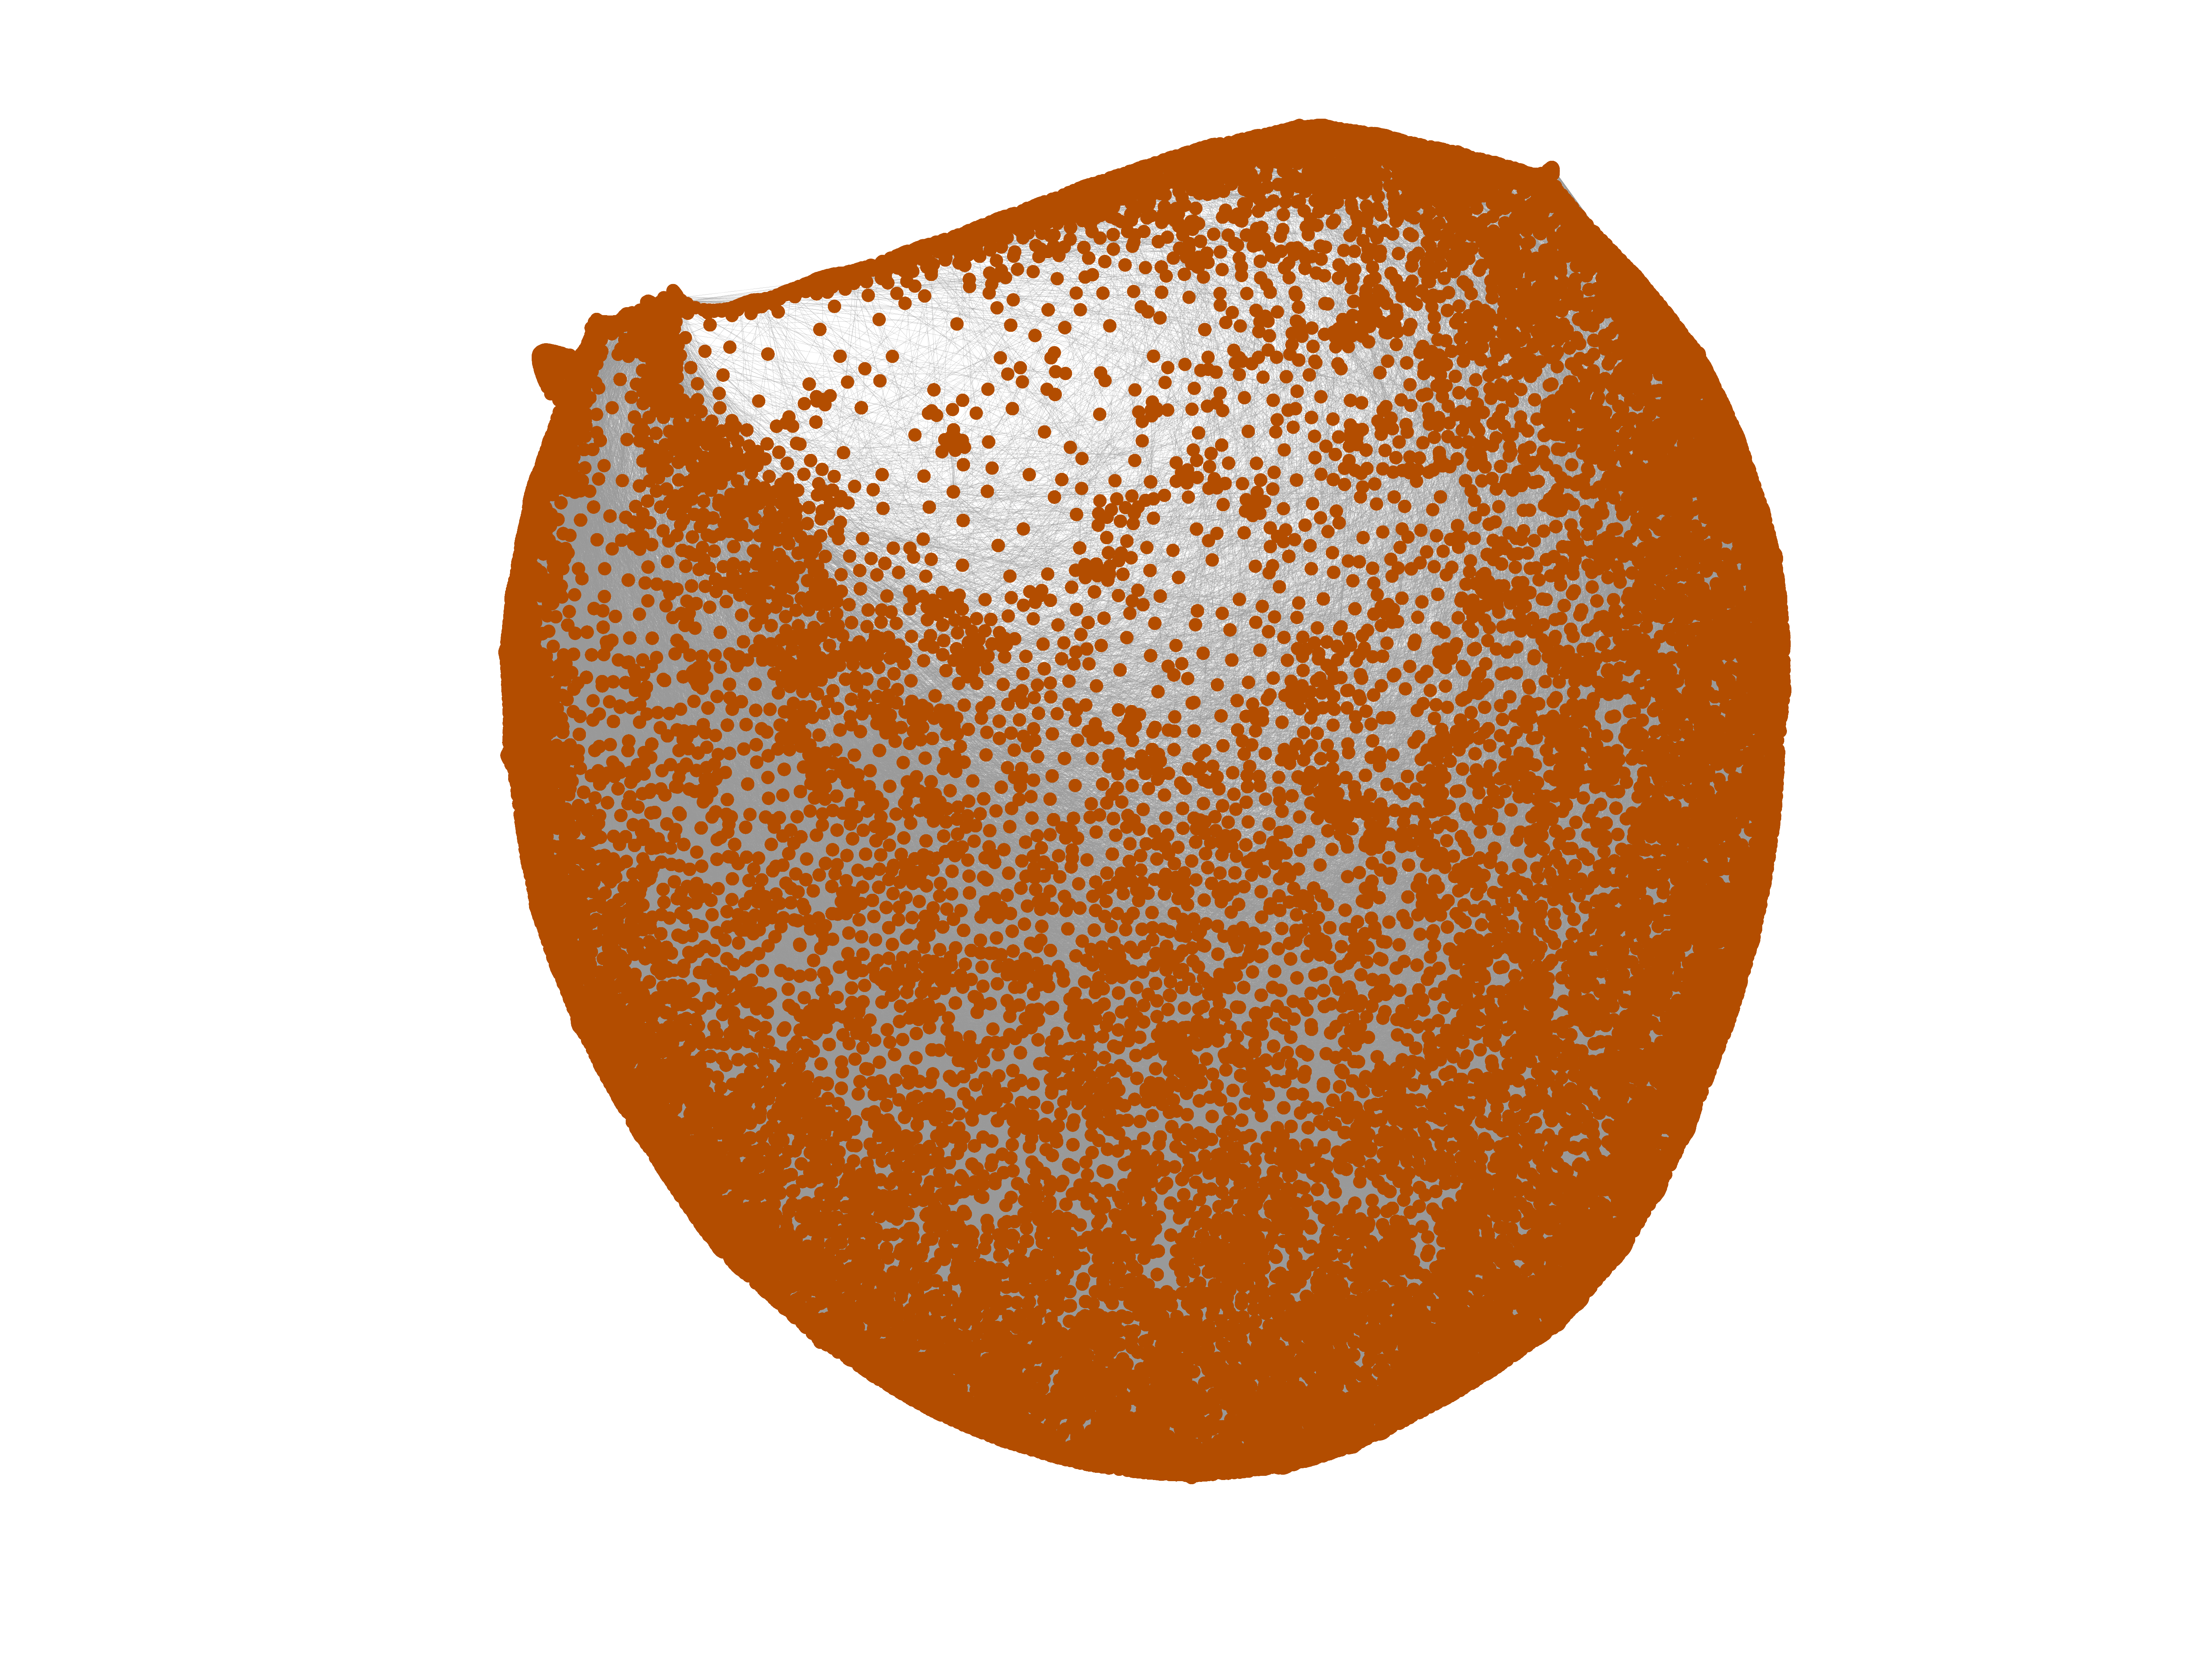
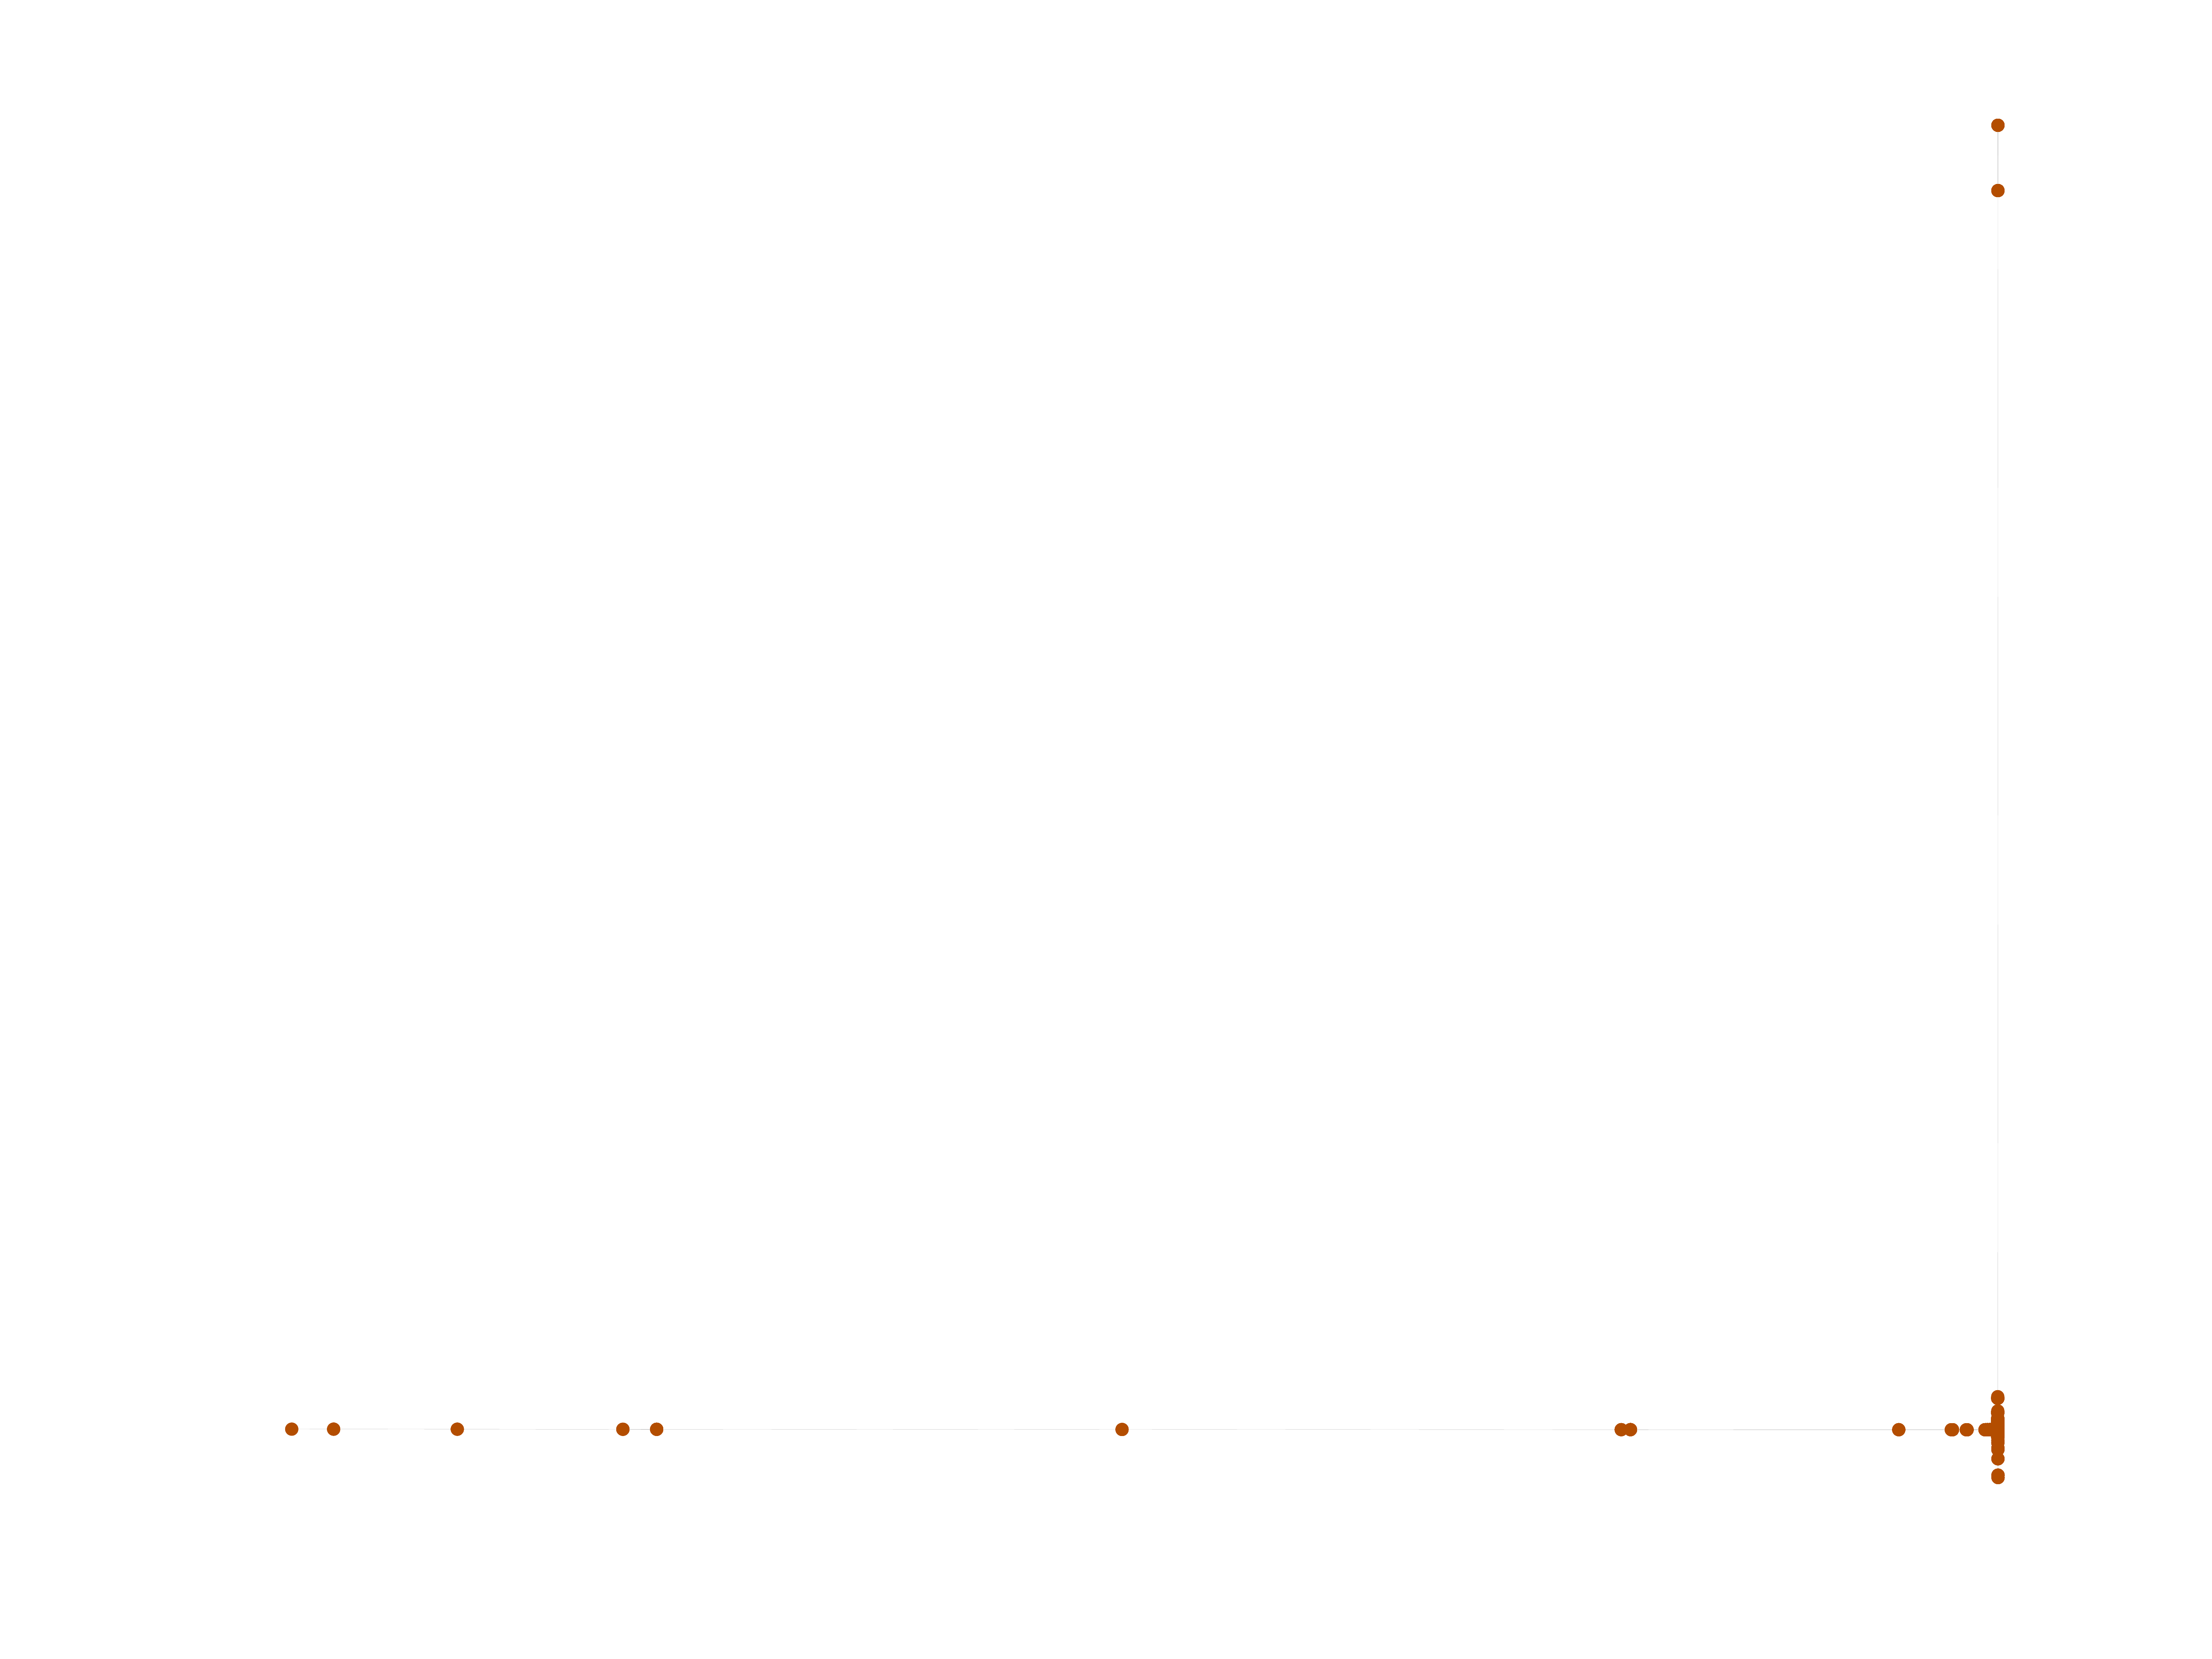
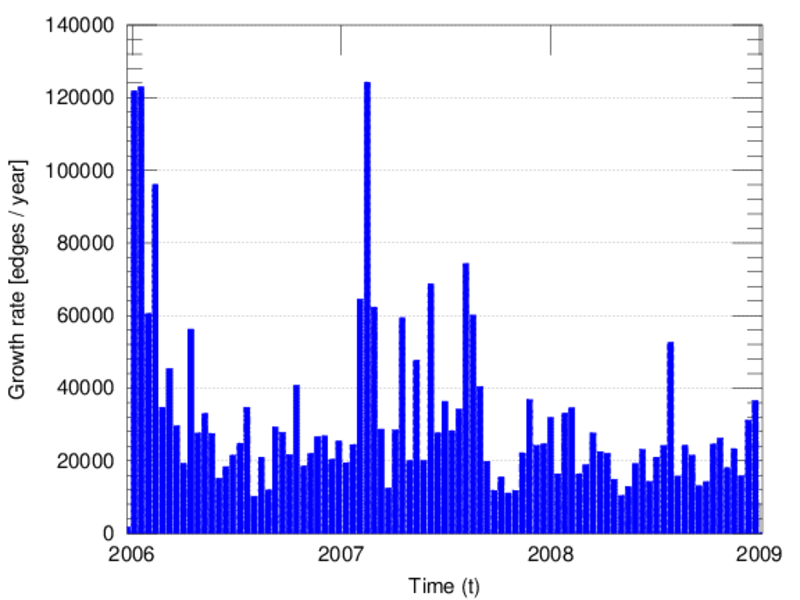
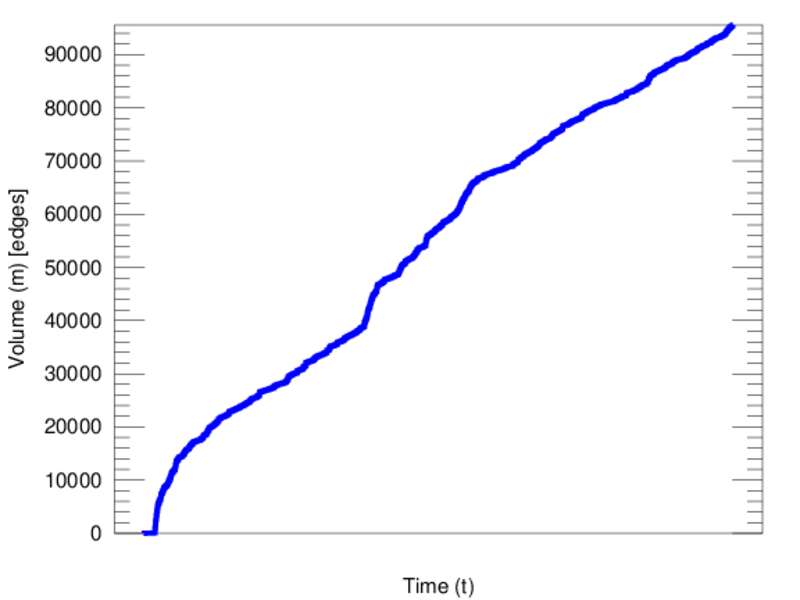
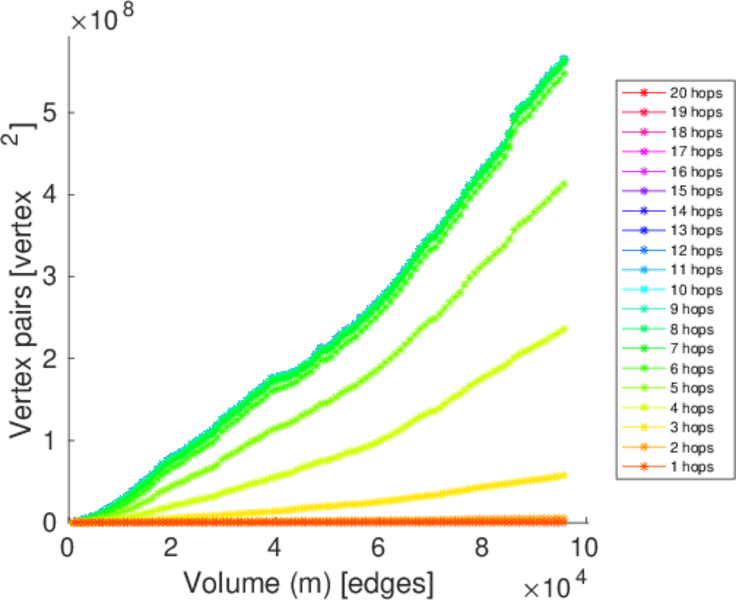
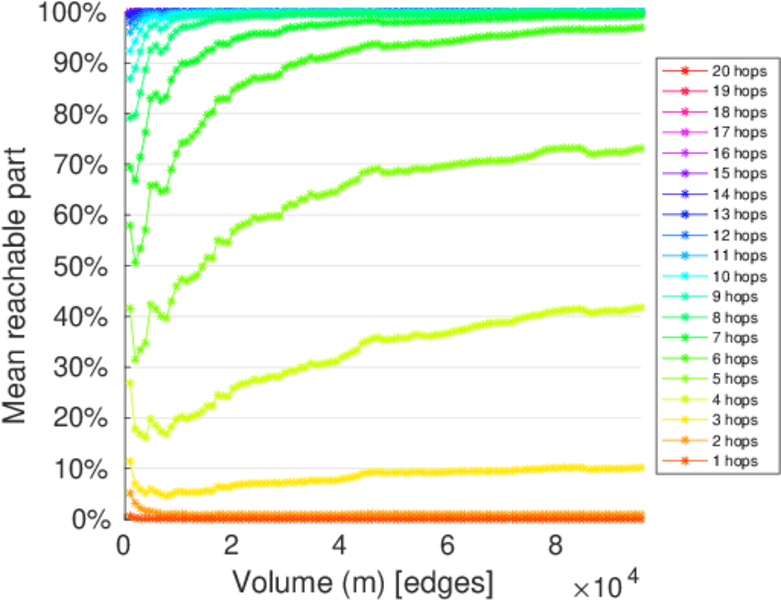
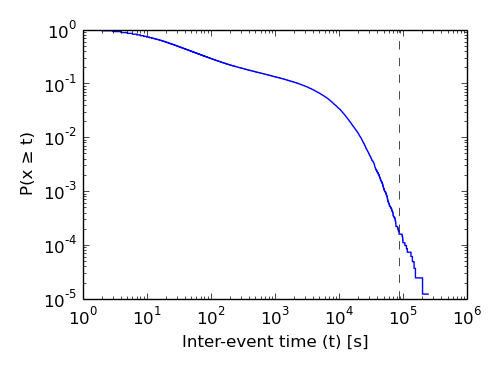
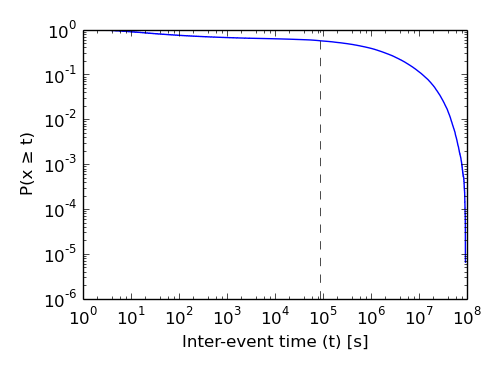
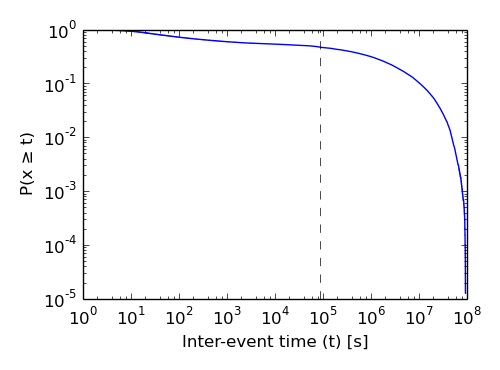
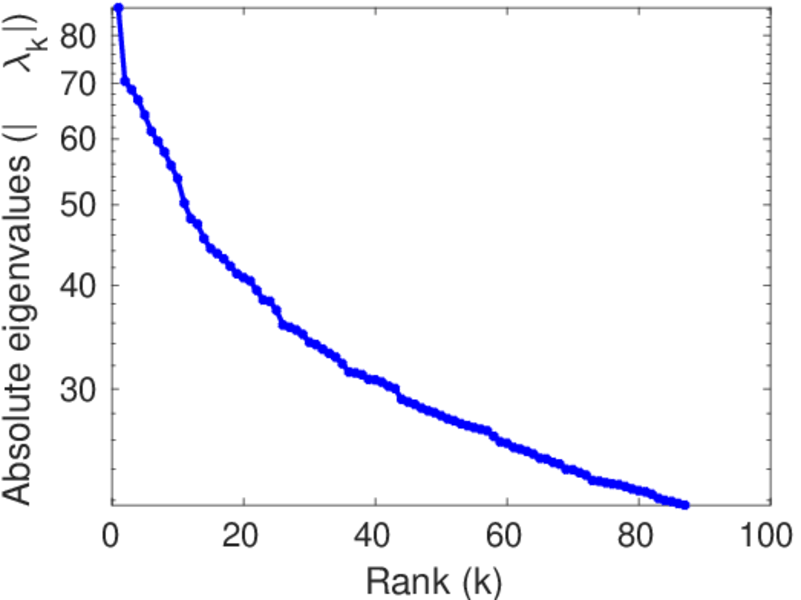
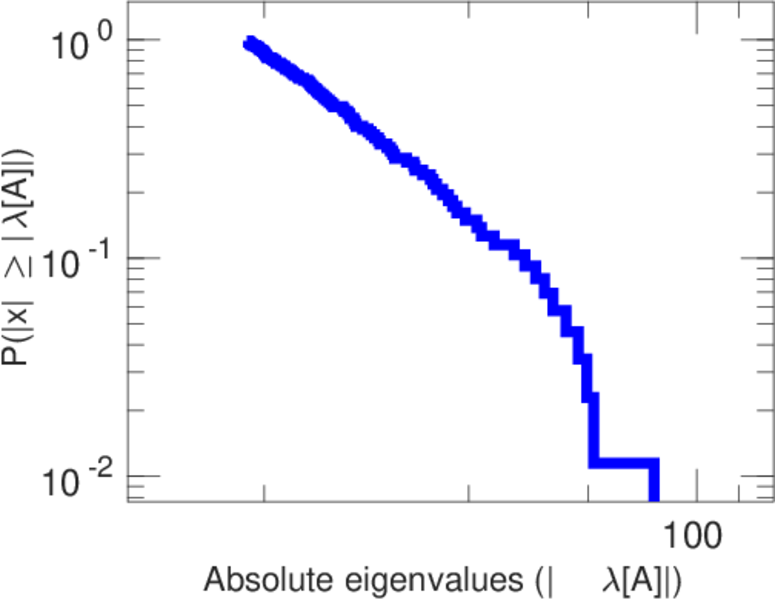
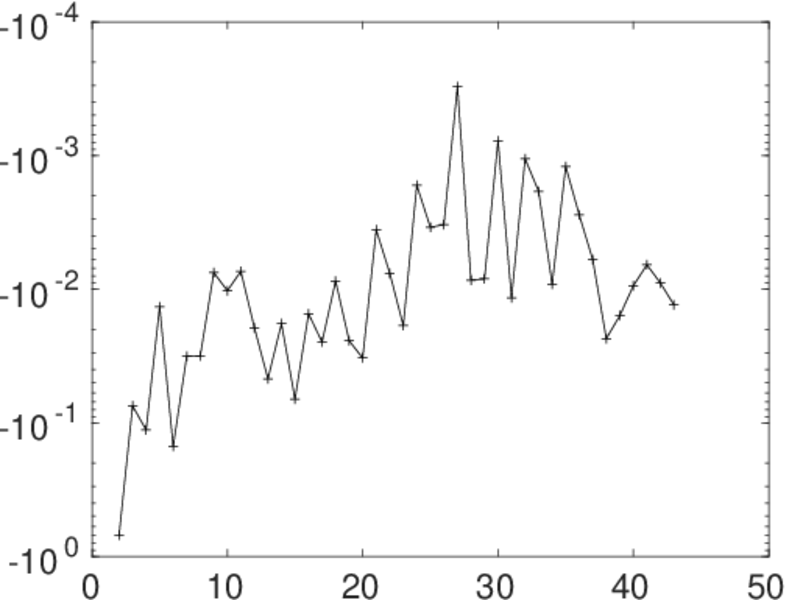
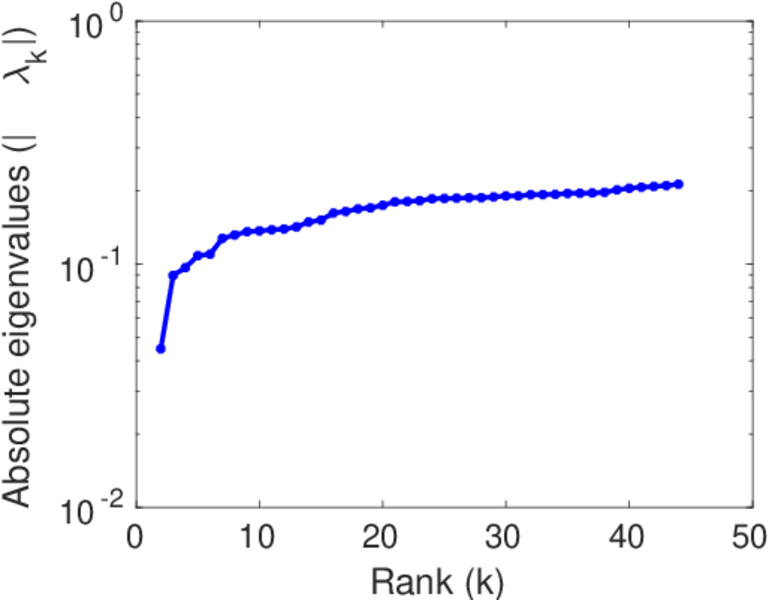
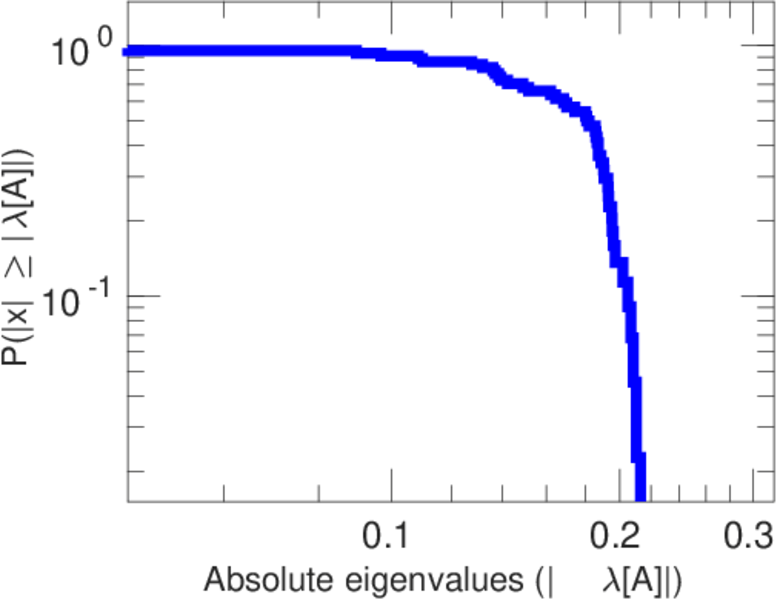
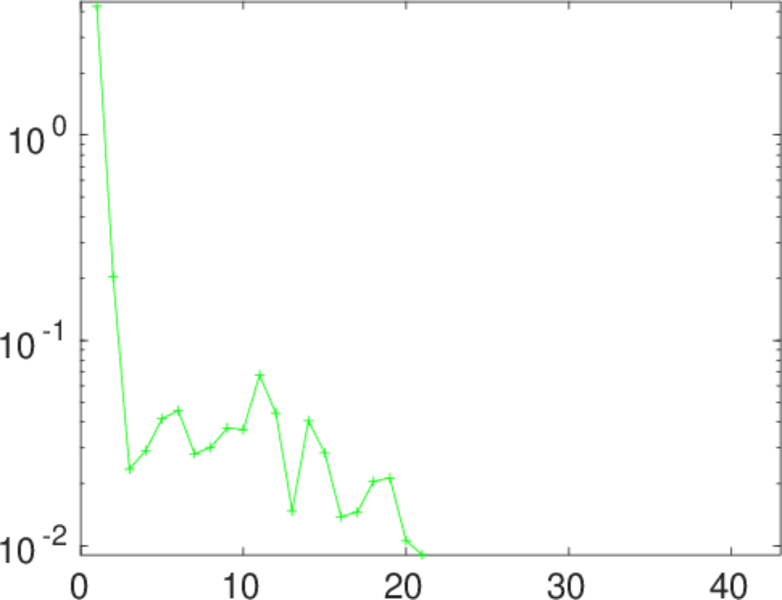
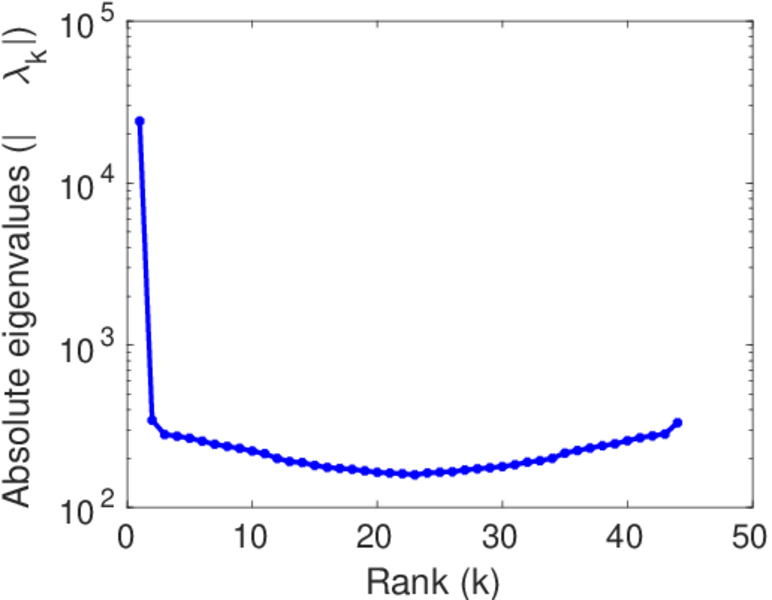
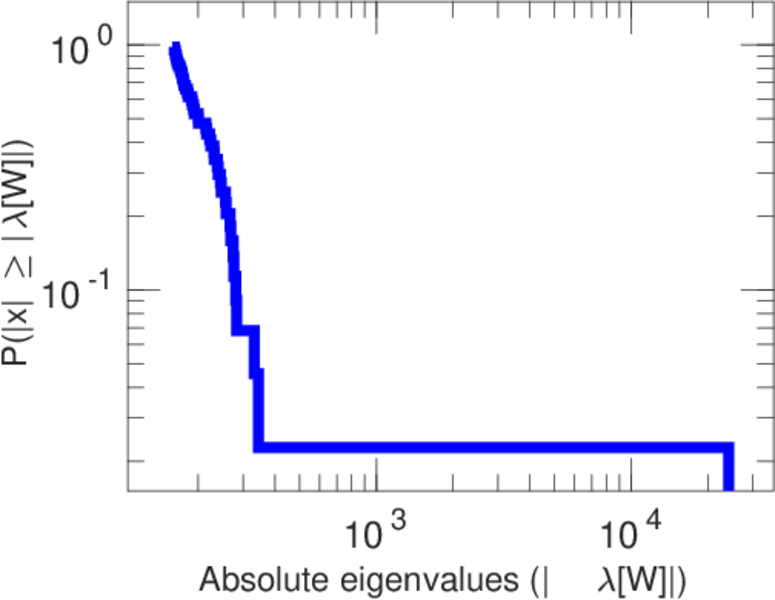
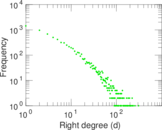
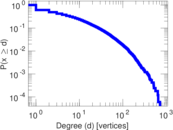
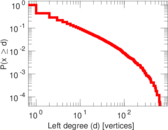
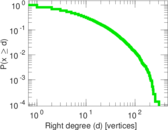
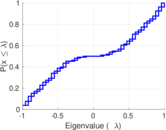
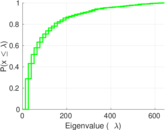
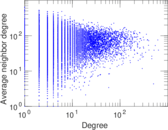
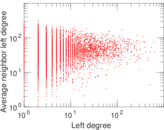
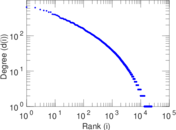
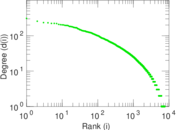
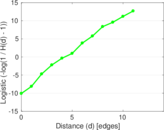
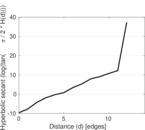
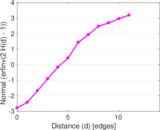
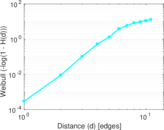
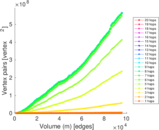
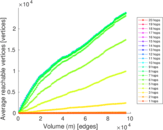
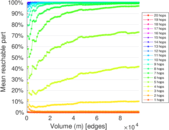
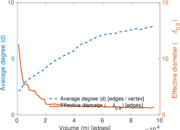
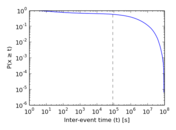
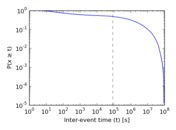
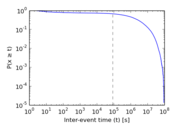
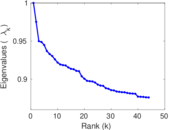
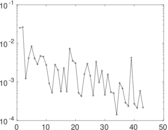
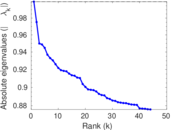
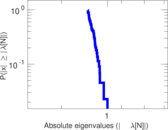
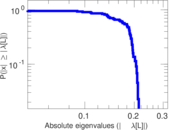
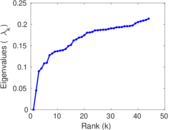
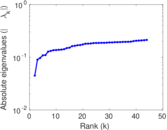
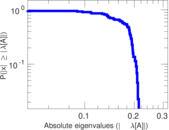
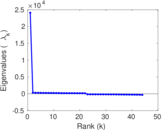
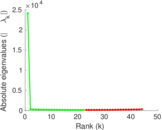
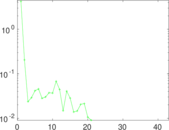
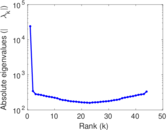
Plots


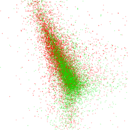
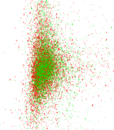


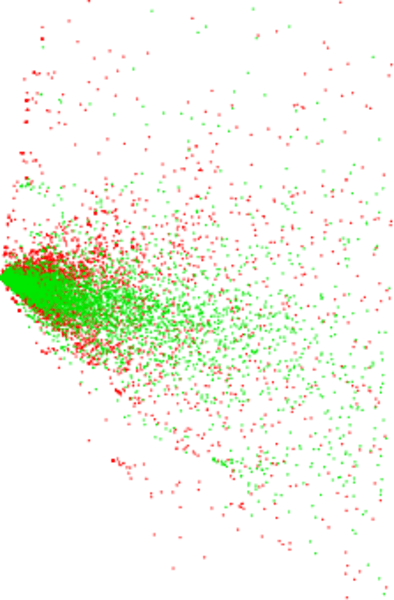
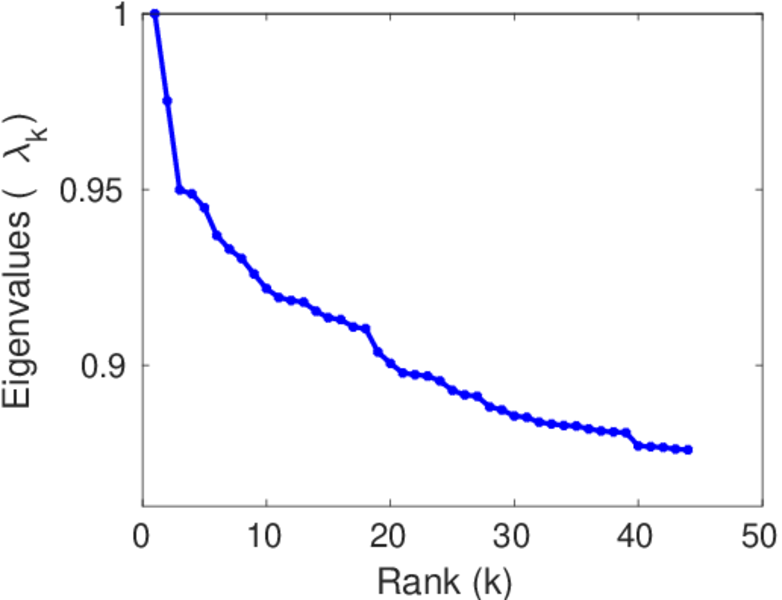
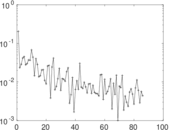
Matrix decompositions plots


Downloads
References
|
[1]
|
Jérôme Kunegis.
KONECT – The Koblenz Network Collection.
In Proc. Int. Conf. on World Wide Web Companion, pages
1343–1350, 2013.
[ http ]
|
|
[2]
|
GroupLens Research.
MovieLens data sets.
http://www.grouplens.org/node/73, October 2006.
|
 KONECT ‣ Networks ‣
Buy Me a Coffee
KONECT ‣ Networks ‣
Buy Me a Coffee