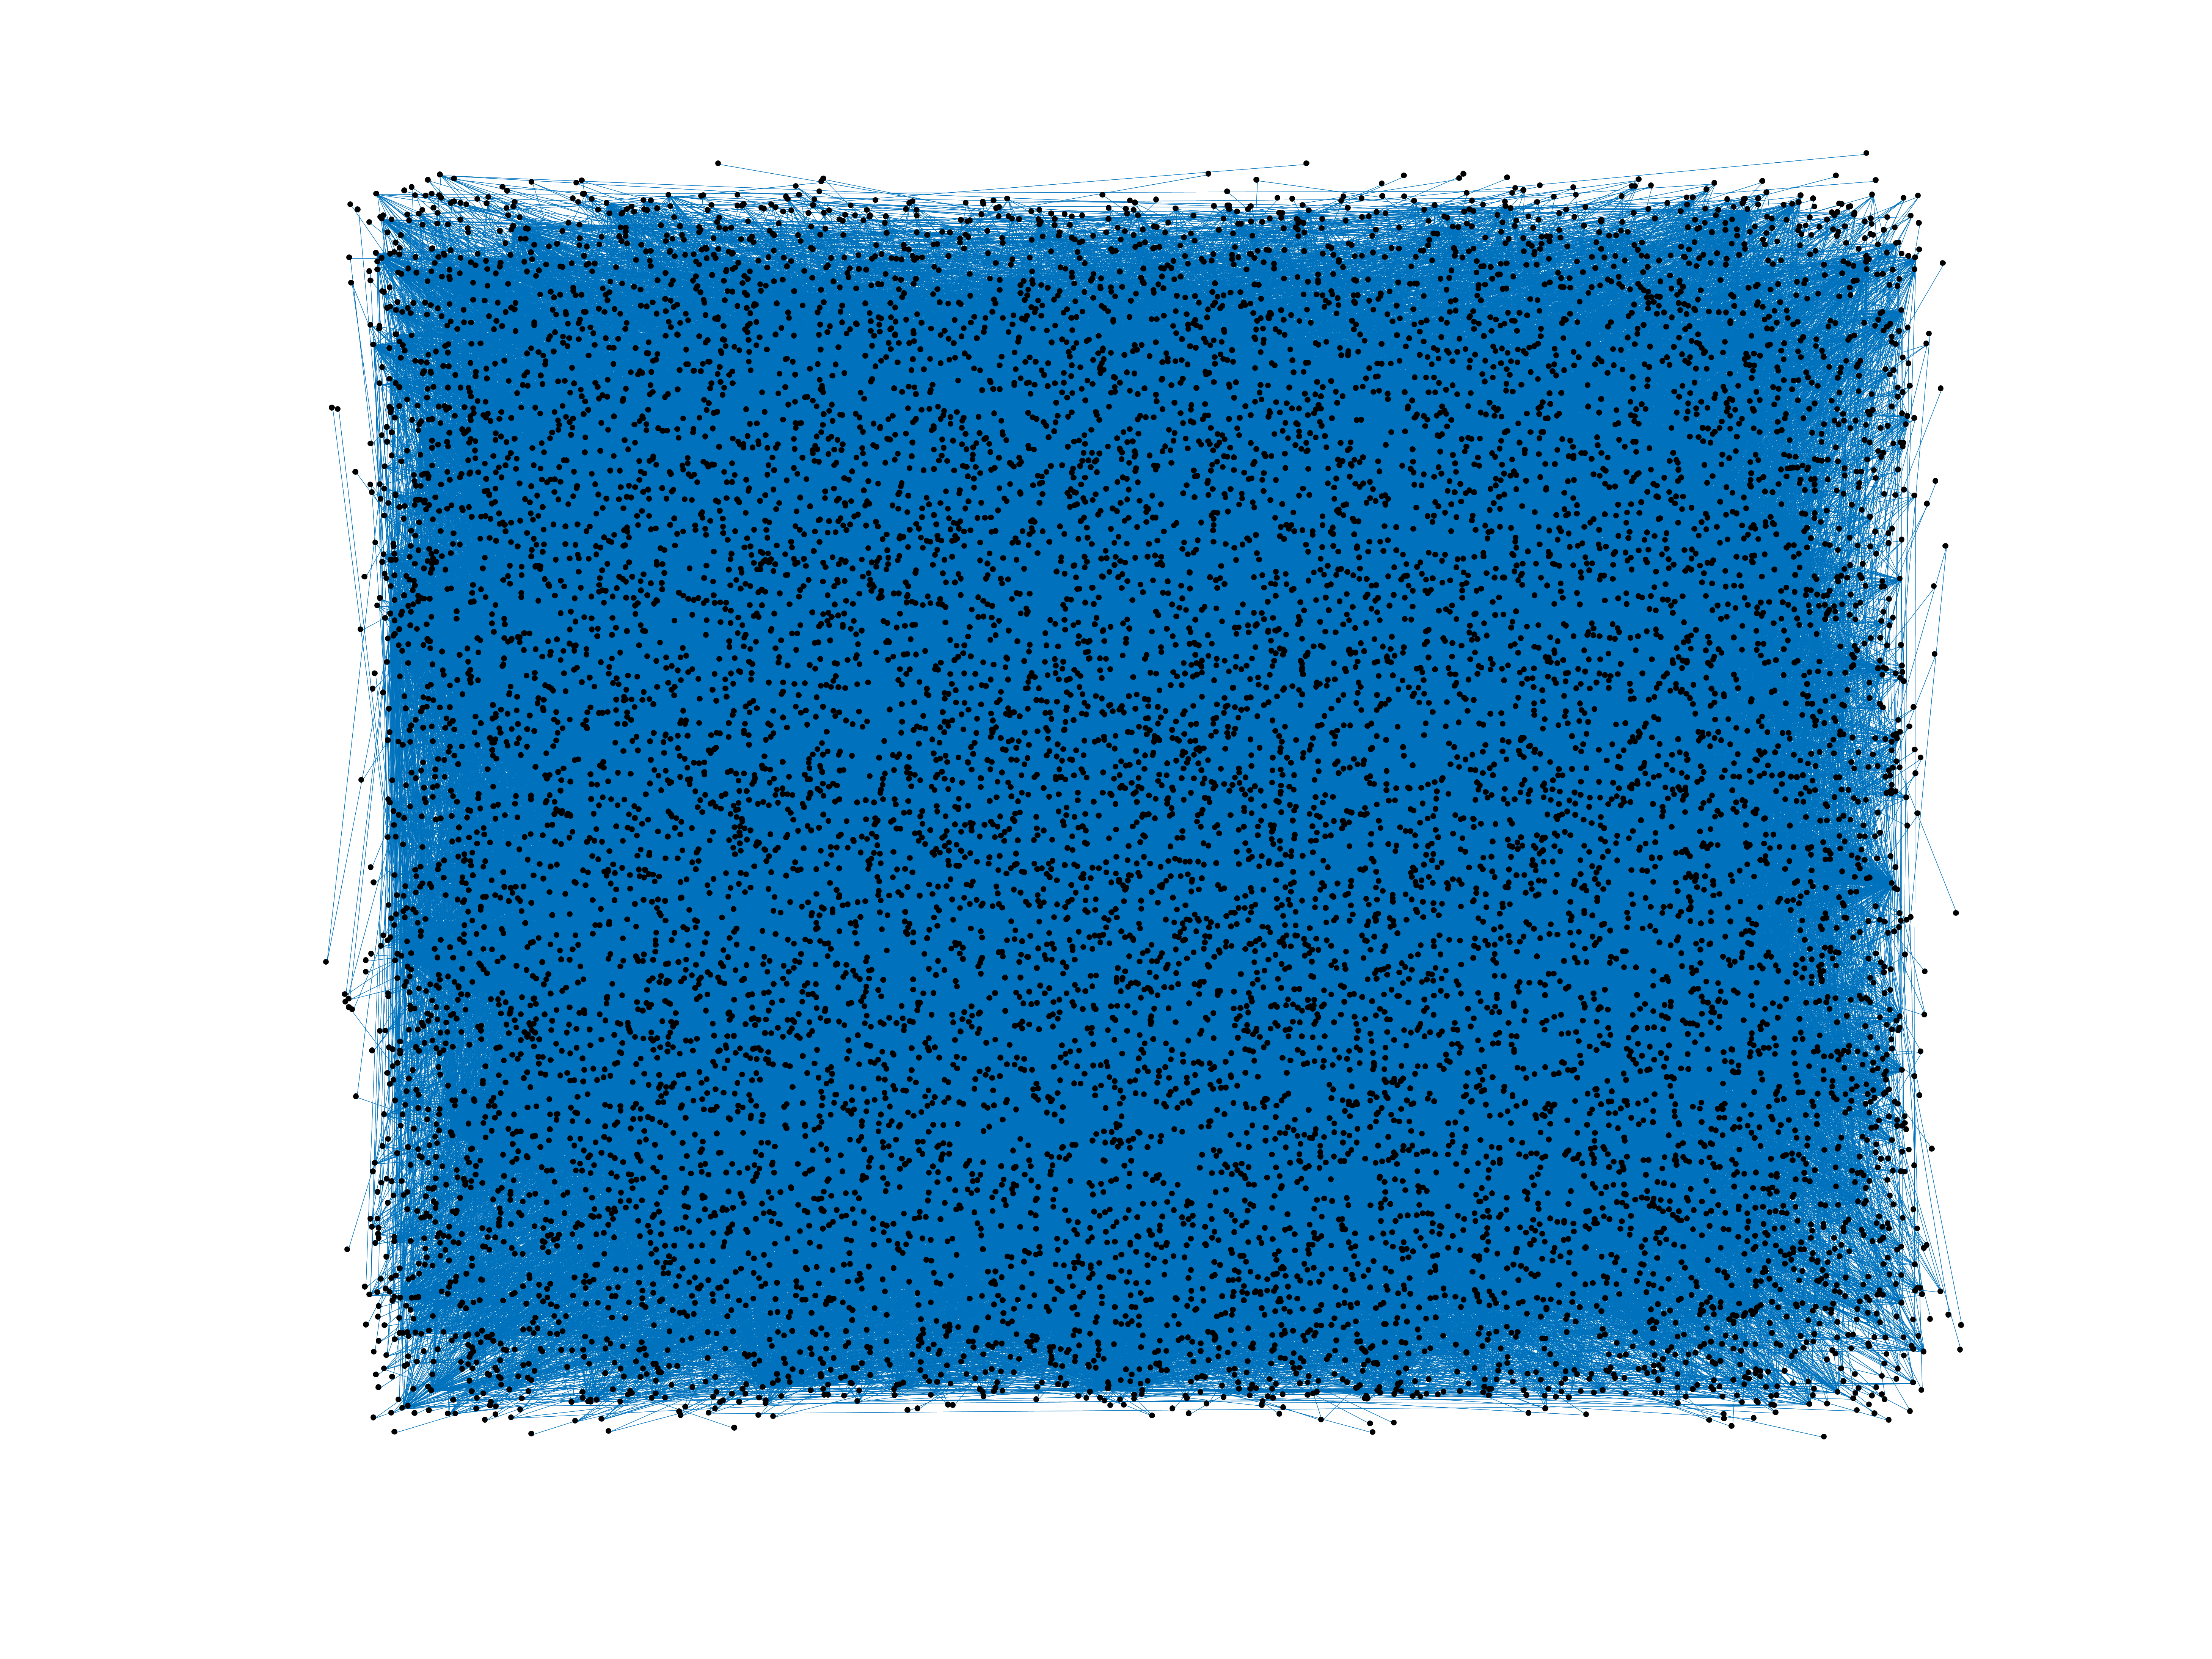
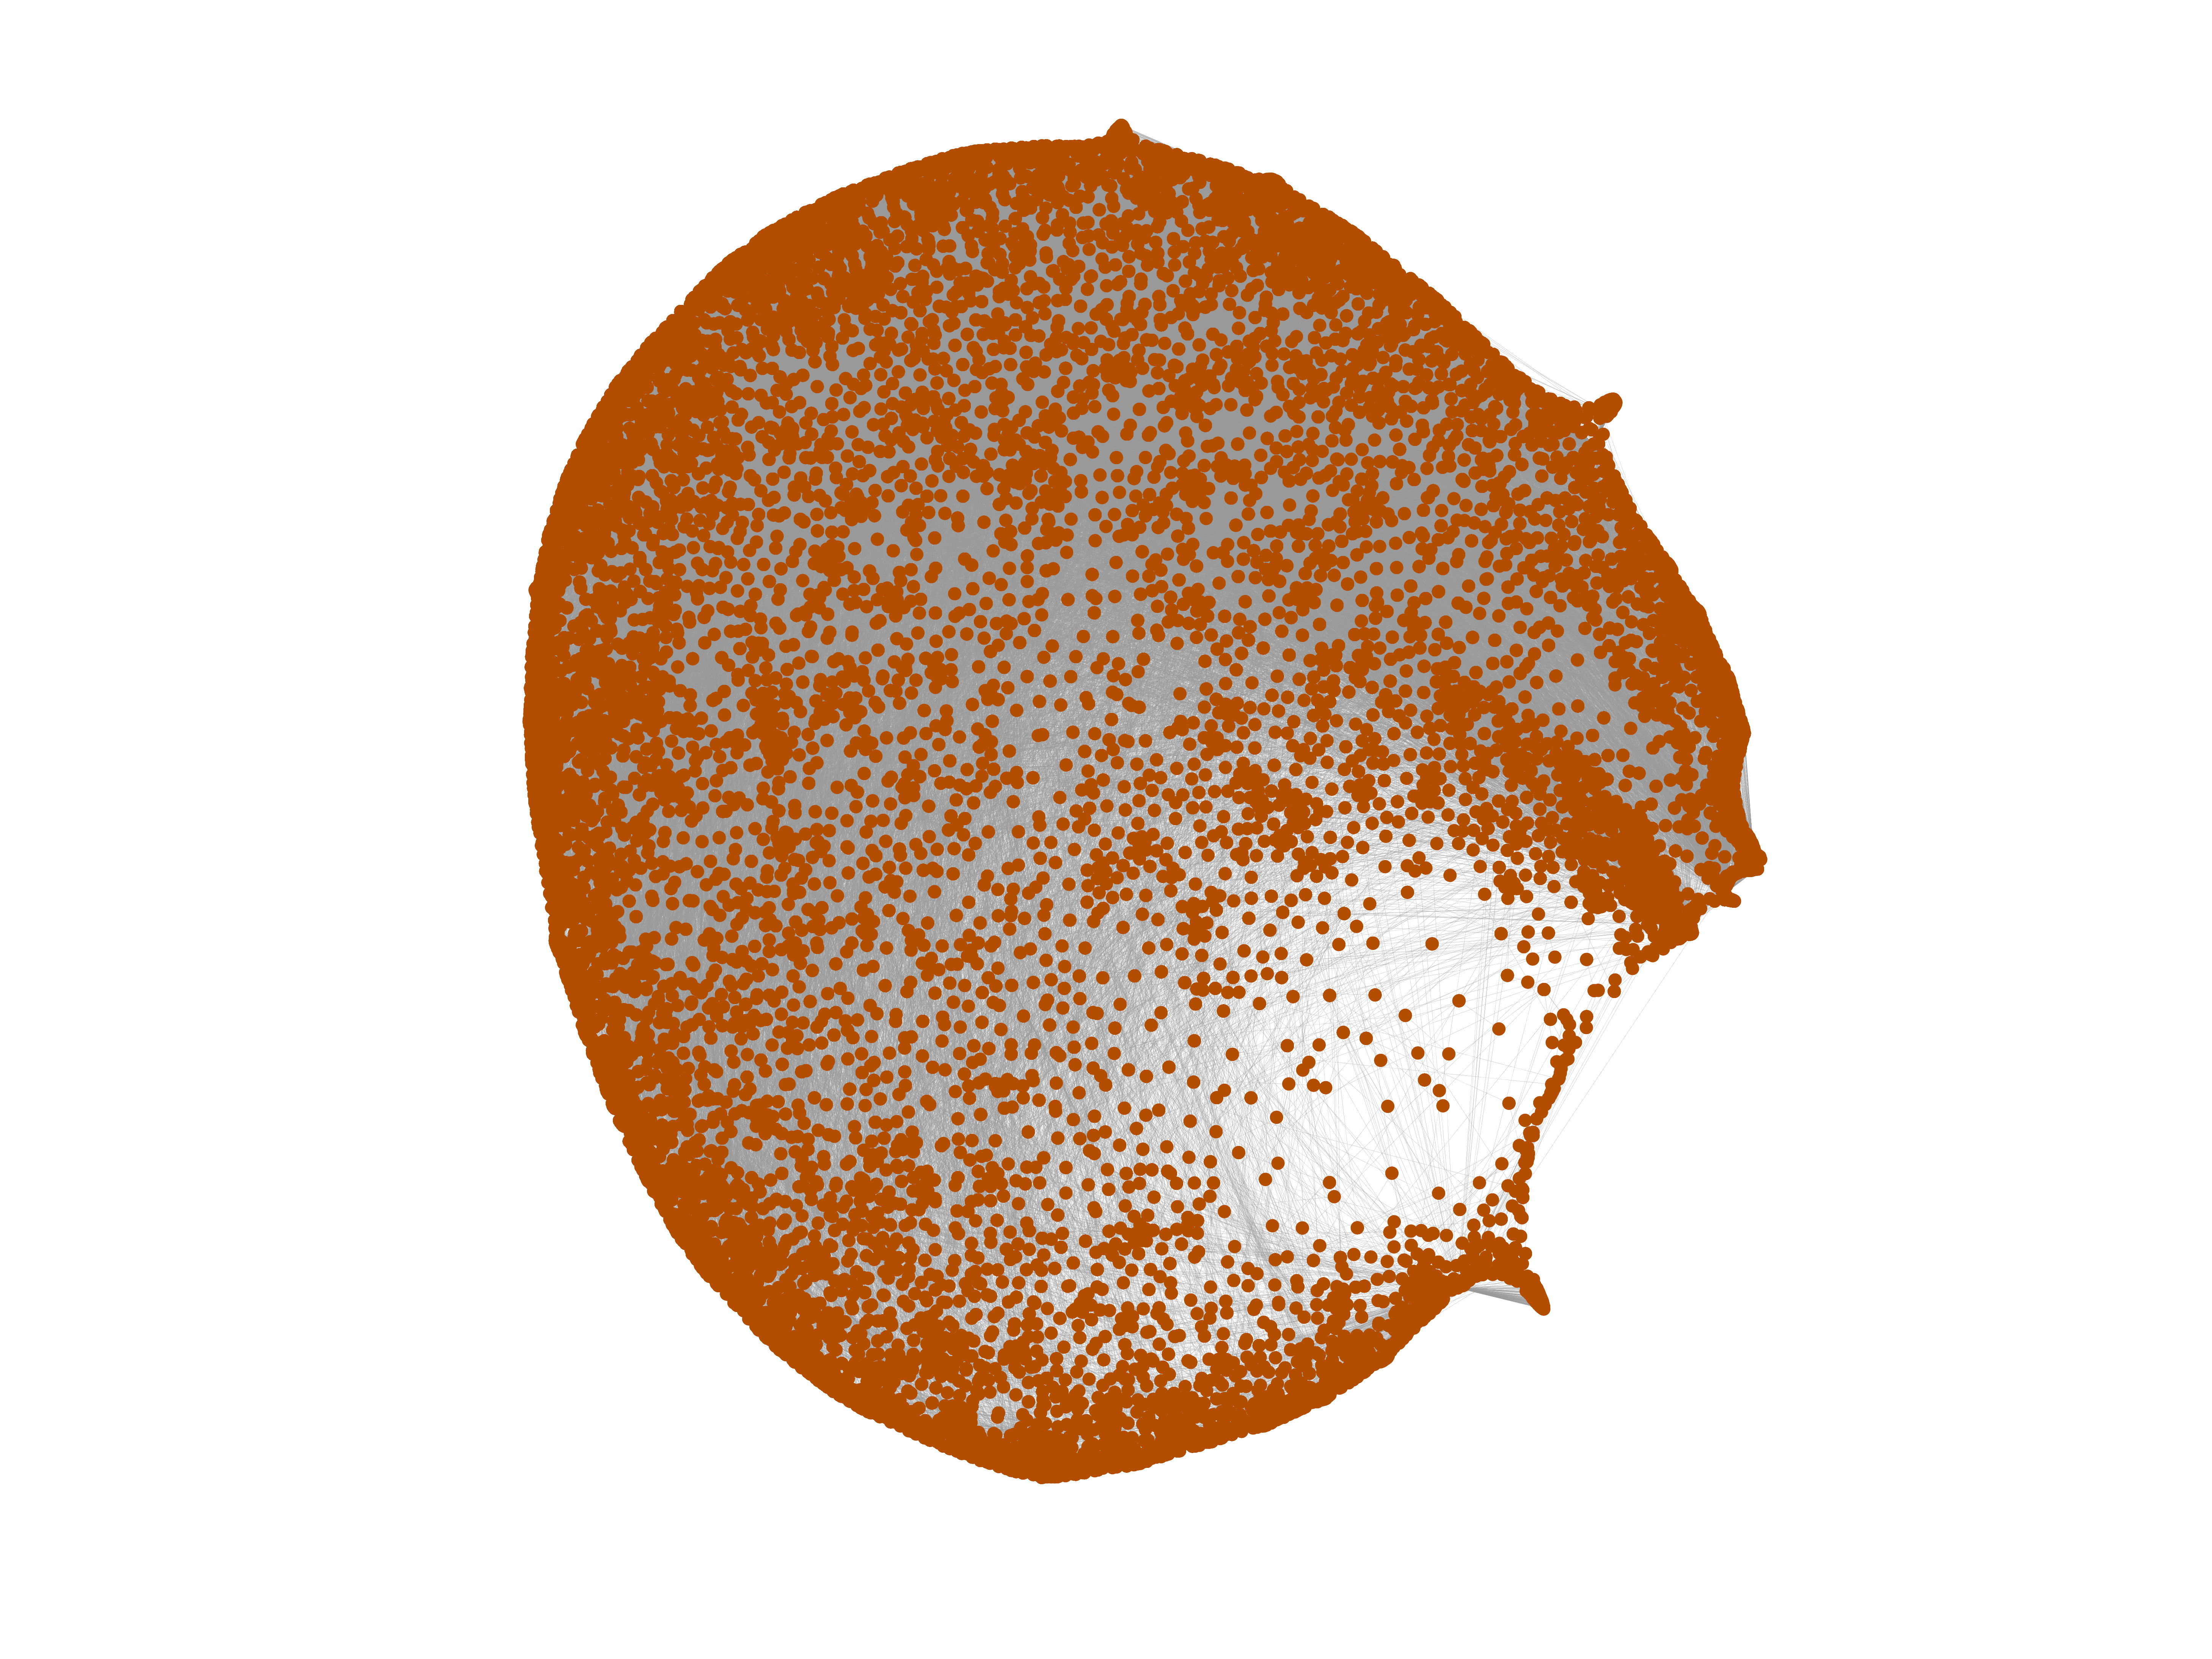
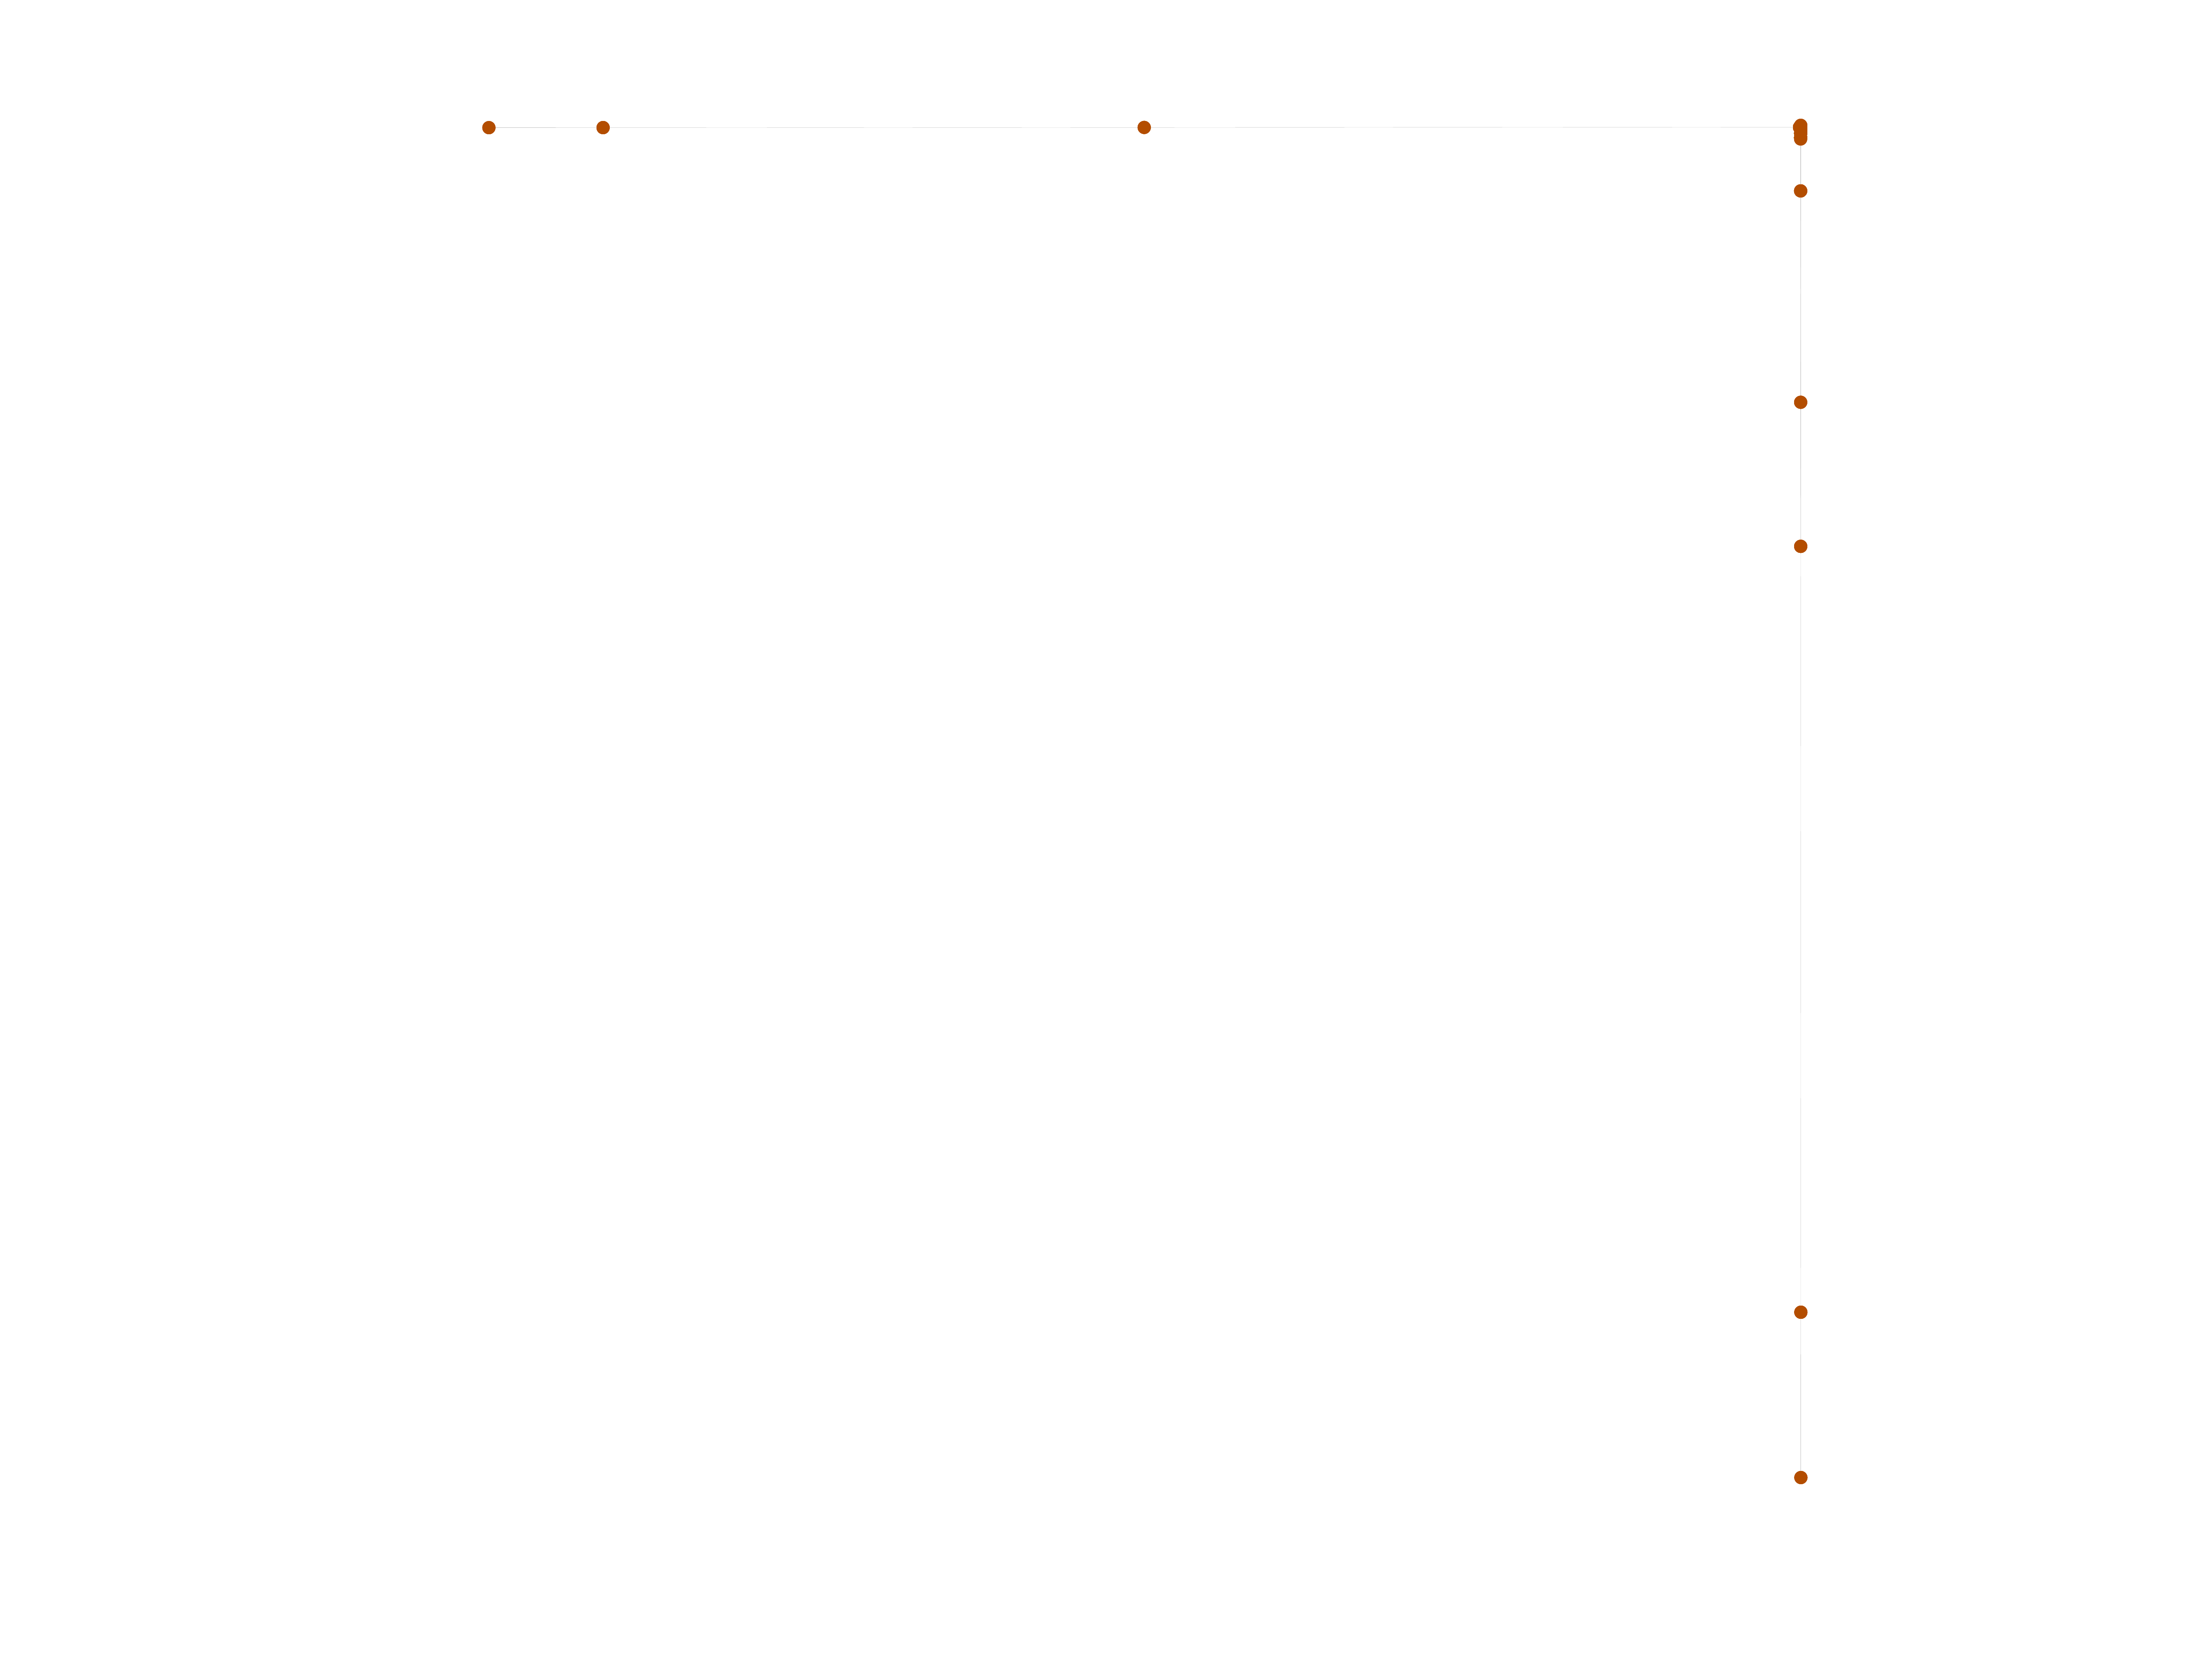
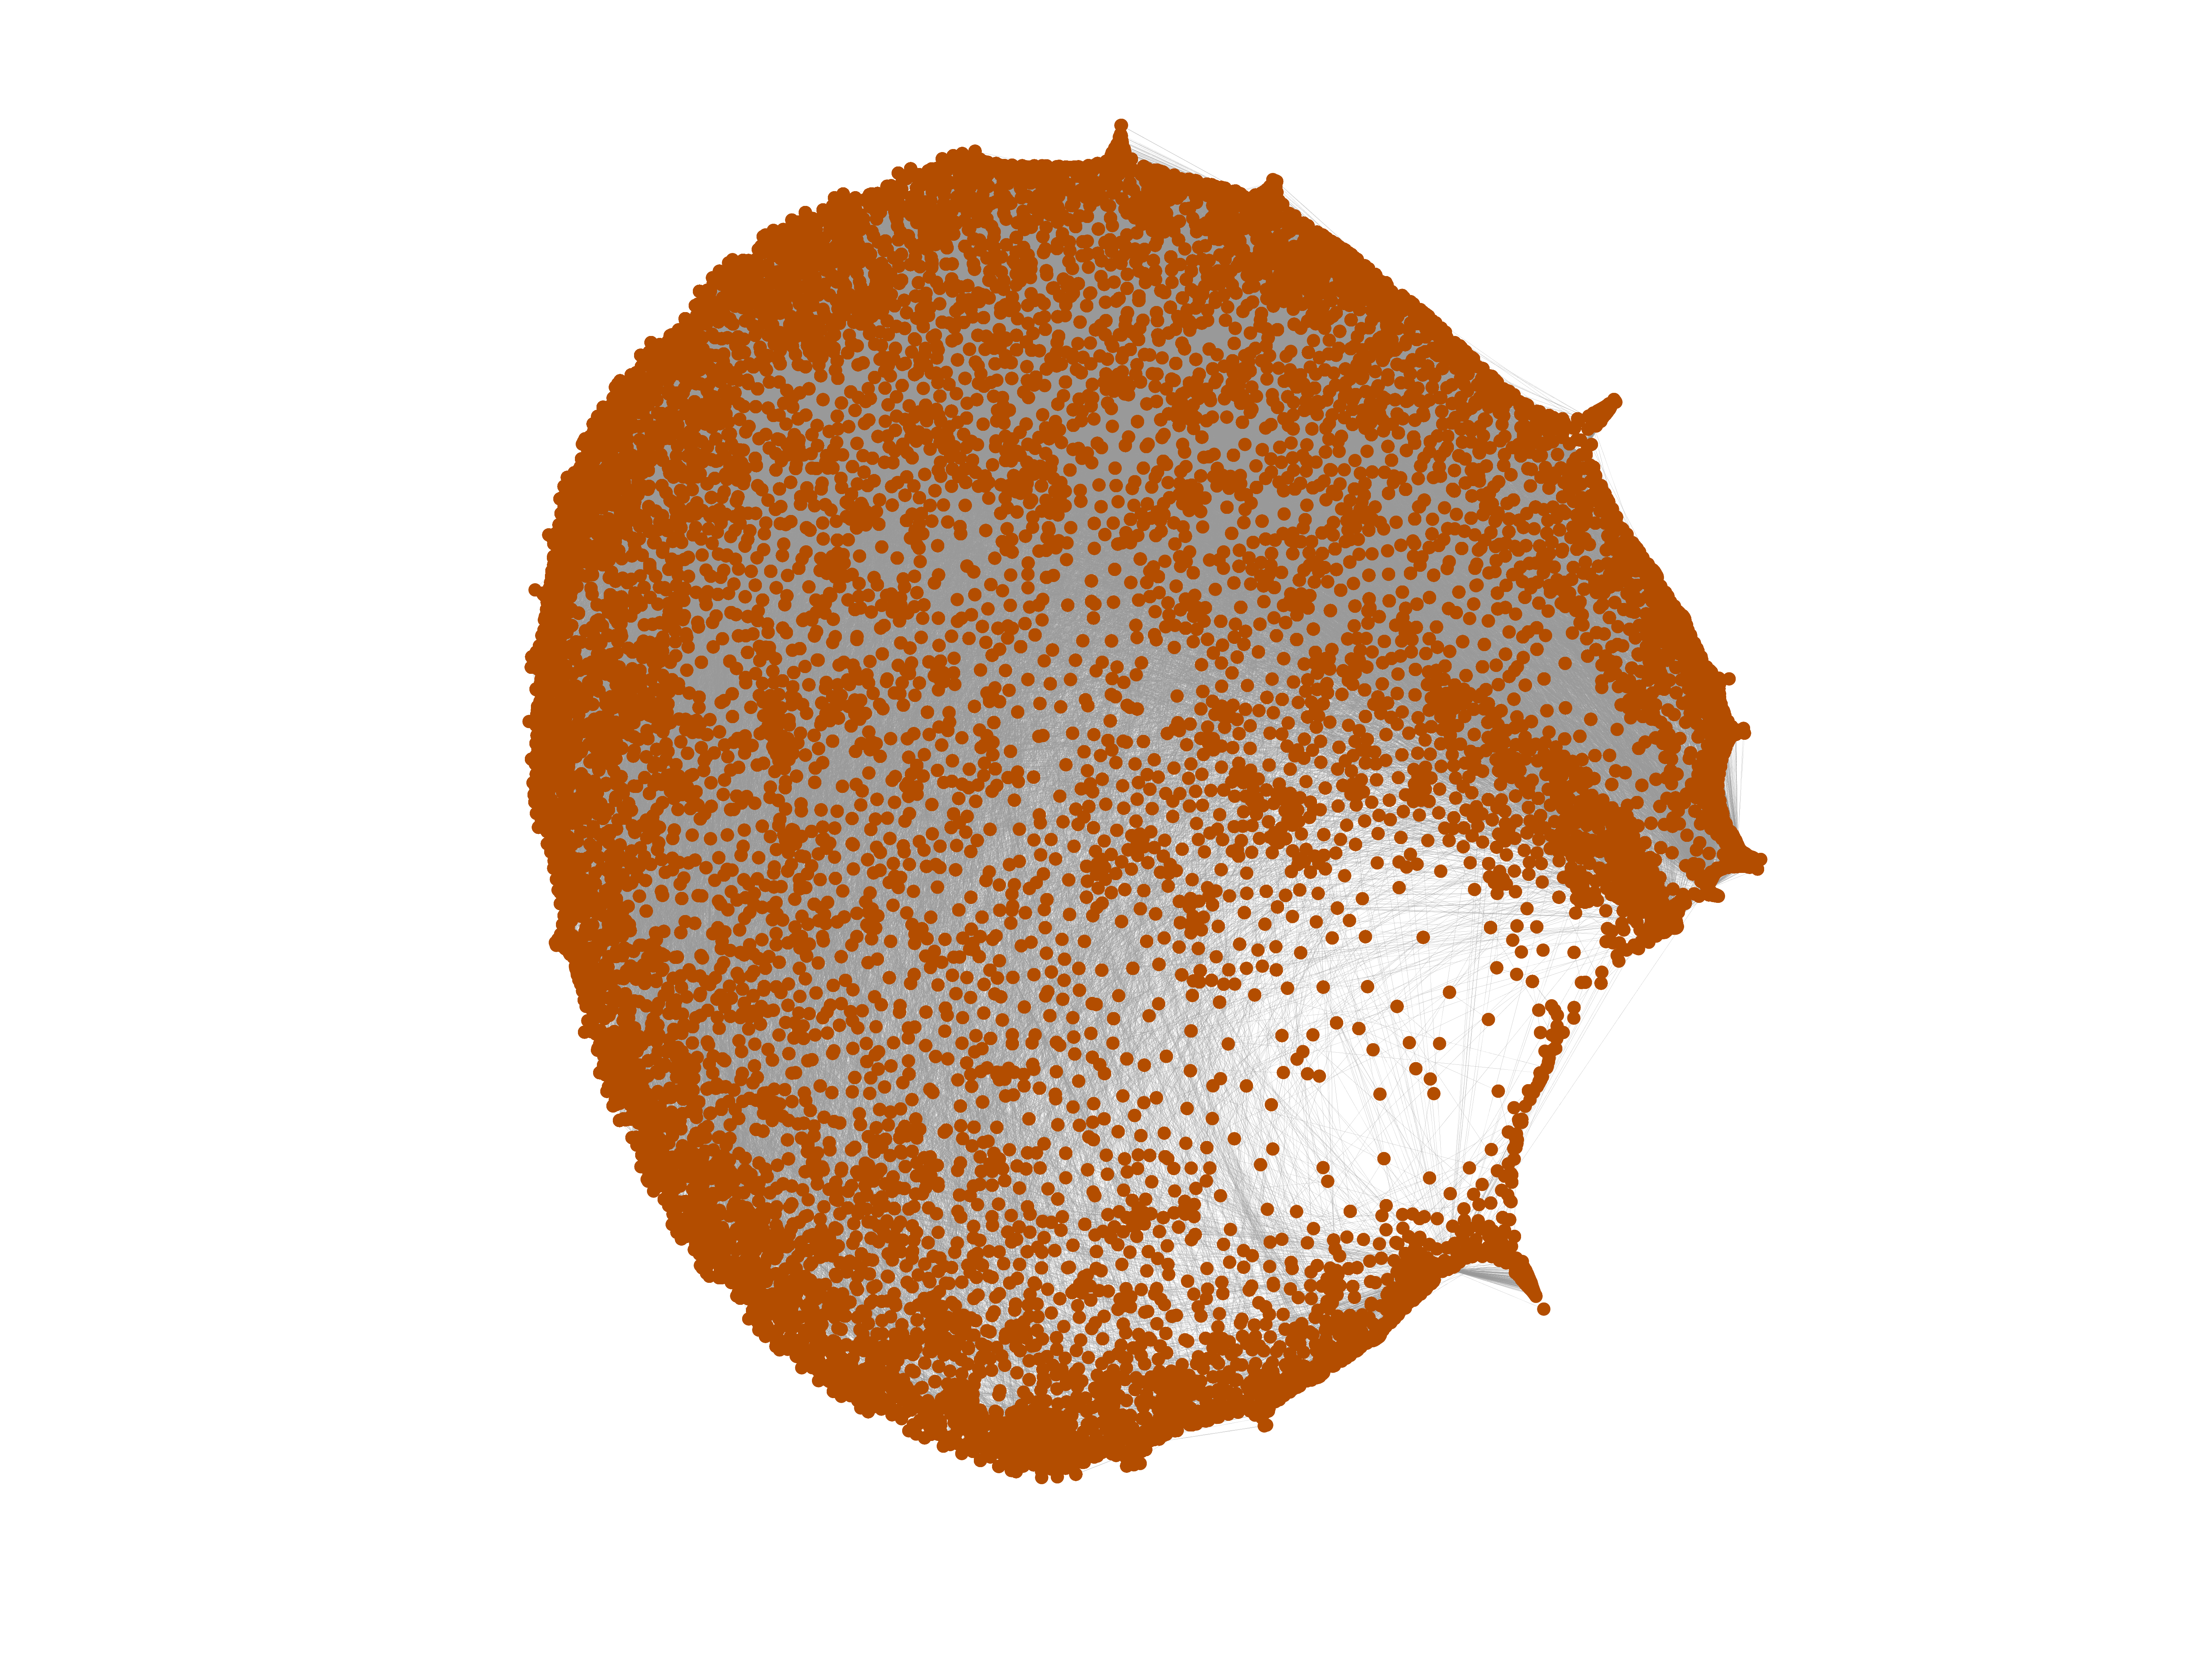
MovieLens user–item
This bipartite network consists of 72,000 users who applied tags to 10,000
movies from http://movielens.umn.edu/. Left nodes represent users and right
nodes represent movies. An edge connects a user with a movie he has assigned a
tag to.
Metadata
Statistics
| Size | n = | 11,610
|
| Left size | n1 = | 4,009
|
| Right size | n2 = | 7,601
|
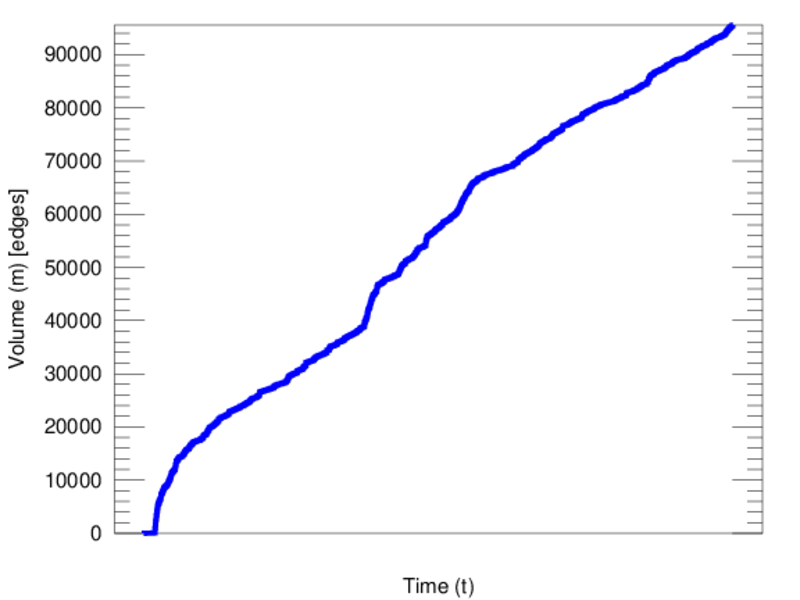
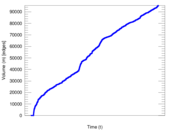
| Volume | m = | 95,580
|
| Unique edge count | m̿ = | 55,484
|
| Wedge count | s = | 10,527,036
|
| Claw count | z = | 3,111,884,288
|
| Cross count | x = | 940,679,536,237
|
| Square count | q = | 7,490,391
|
| 4-Tour count | T4 = | 102,152,360
|
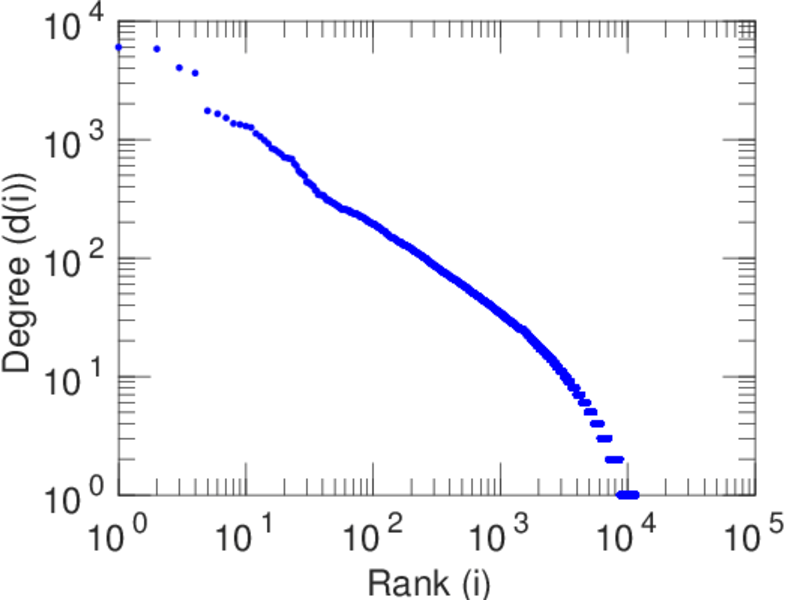
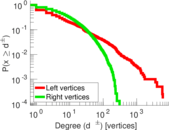
| Maximum degree | dmax = | 6,012
|
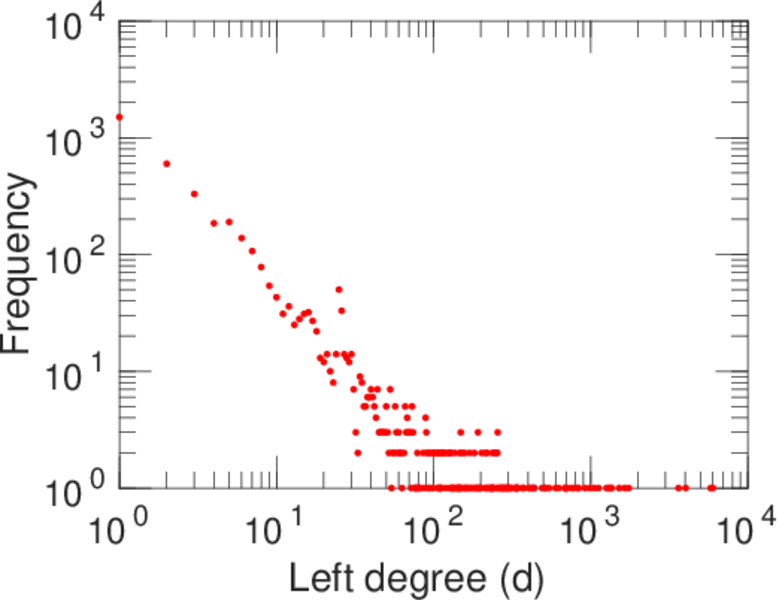
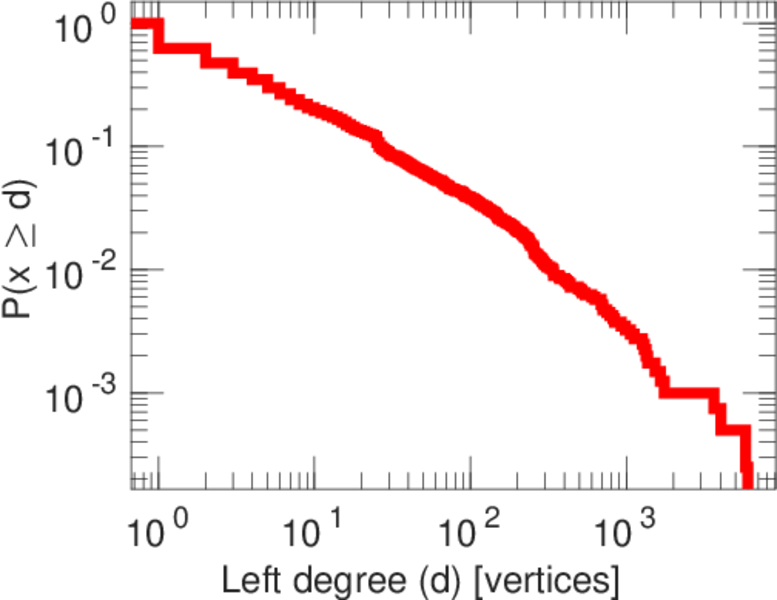
| Maximum left degree | d1max = | 6,012
|
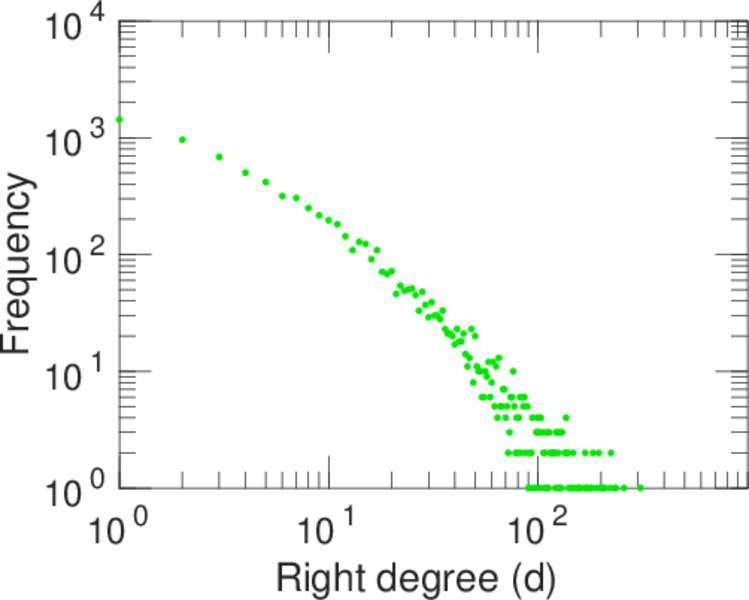
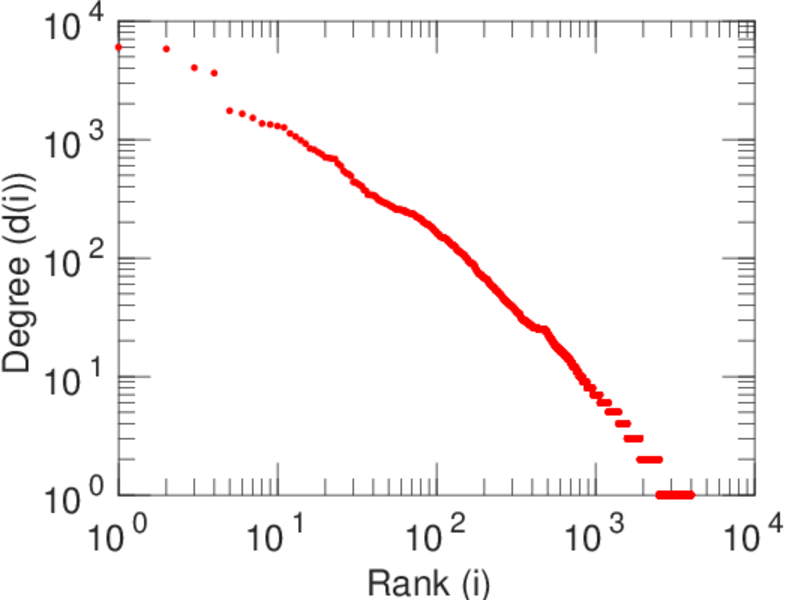
| Maximum right degree | d2max = | 308
|
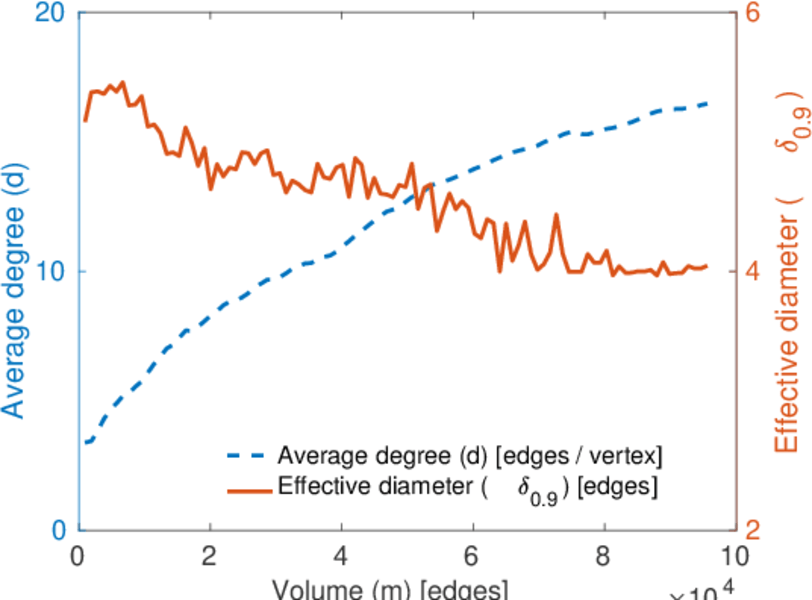
| Average degree | d = | 16.465 1
|
| Average left degree | d1 = | 23.841 4
|
| Average right degree | d2 = | 12.574 7
|
| Fill | p = | 0.001 820 79
|
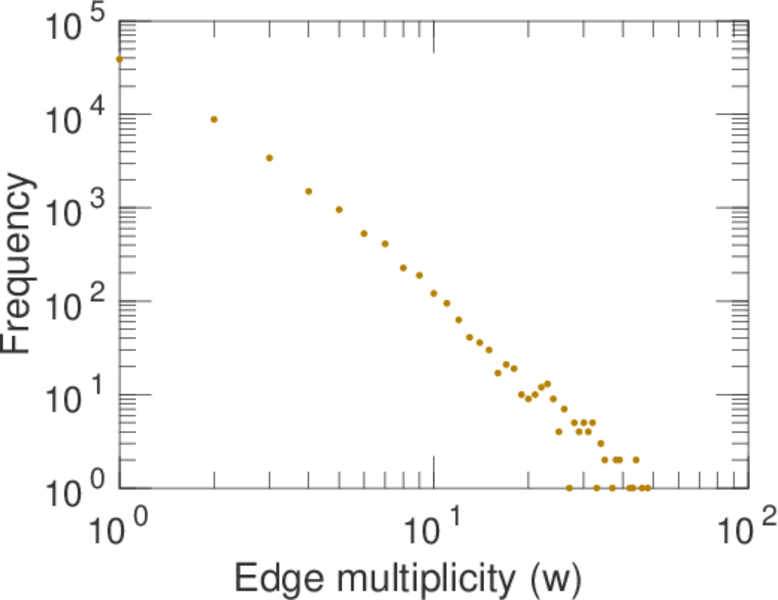
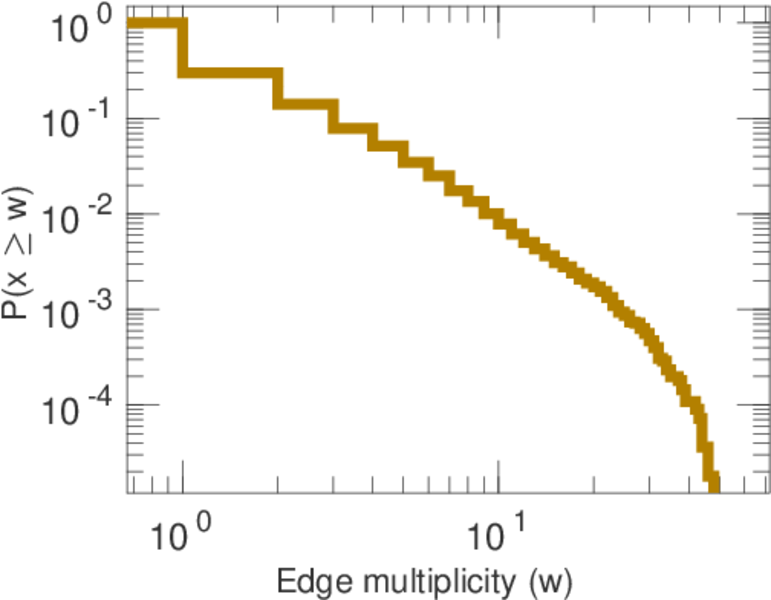
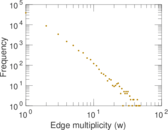
| Average edge multiplicity | m̃ = | 1.722 66
|
| Size of LCC | N = | 11,557
|
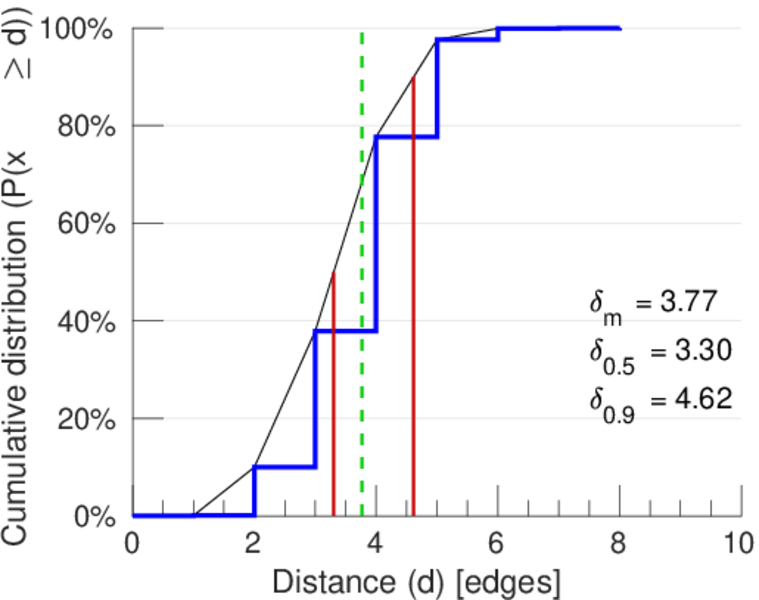
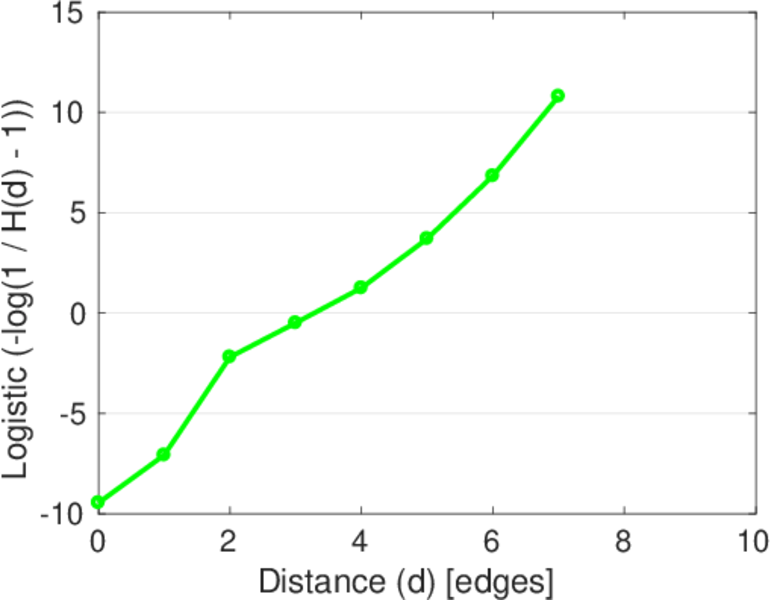
| Diameter | δ = | 9
|
| 50-Percentile effective diameter | δ0.5 = | 3.304 04
|
| 90-Percentile effective diameter | δ0.9 = | 4.618 16
|
| Median distance | δM = | 4
|
| Mean distance | δm = | 3.768 25
|
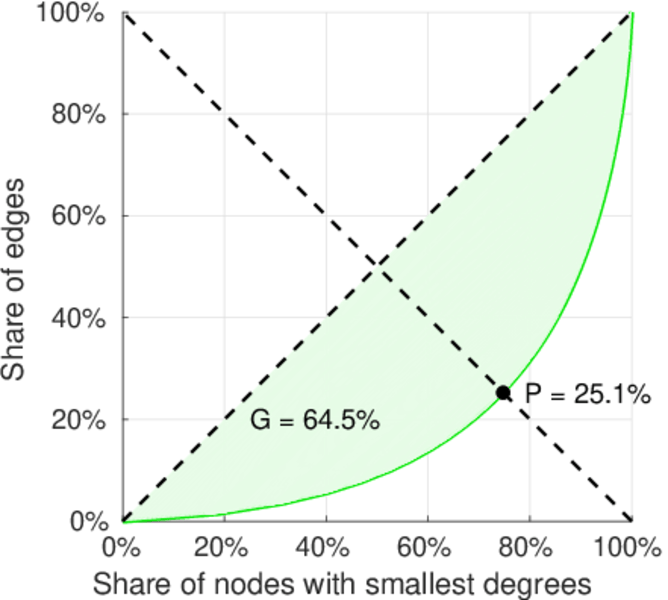
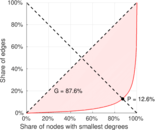
| Gini coefficient | G = | 0.746 738
|
| Balanced inequality ratio | P = | 0.209 128
|
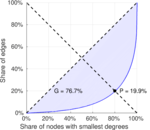
| Left balanced inequality ratio | P1 = | 0.125 811
|
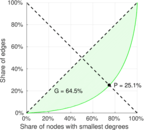
| Right balanced inequality ratio | P2 = | 0.250 983
|
| Relative edge distribution entropy | Her = | 0.849 226
|
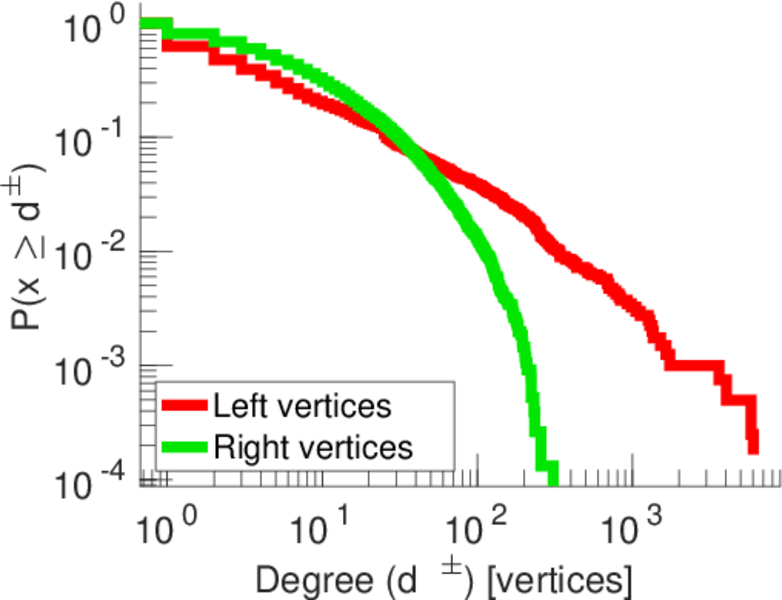
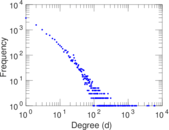
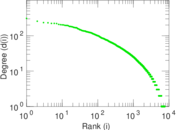
| Power law exponent | γ = | 1.817 63
|
| Tail power law exponent | γt = | 2.401 00
|
| Tail power law exponent with p | γ3 = | 2.401 00
|
| p-value | p = | 0.929 000
|
| Left tail power law exponent with p | γ3,1 = | 1.651 00
|
| Left p-value | p1 = | 0.000 00
|
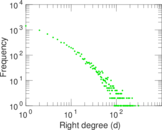
| Right tail power law exponent with p | γ3,2 = | 3.321 00
|
| Right p-value | p2 = | 0.002 000 00
|
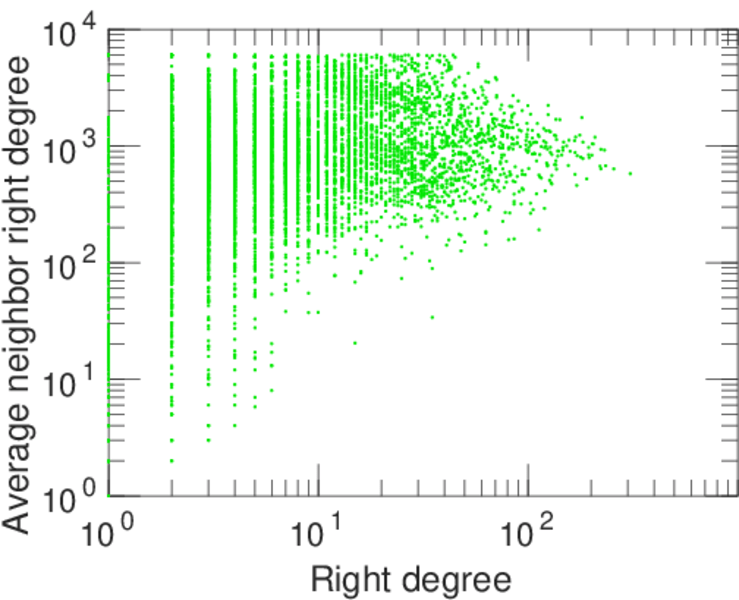
| Degree assortativity | ρ = | −0.221 845
|
| Degree assortativity p-value | pρ = | 0.000 00
|
| Spectral norm | α = | 307.003
|
| Algebraic connectivity | a = | 0.176 189
|
| Spectral separation | |λ1[A] / λ2[A]| = | 1.279 70
|
| Controllability | C = | 5,981
|
| Relative controllability | Cr = | 0.515 159
|
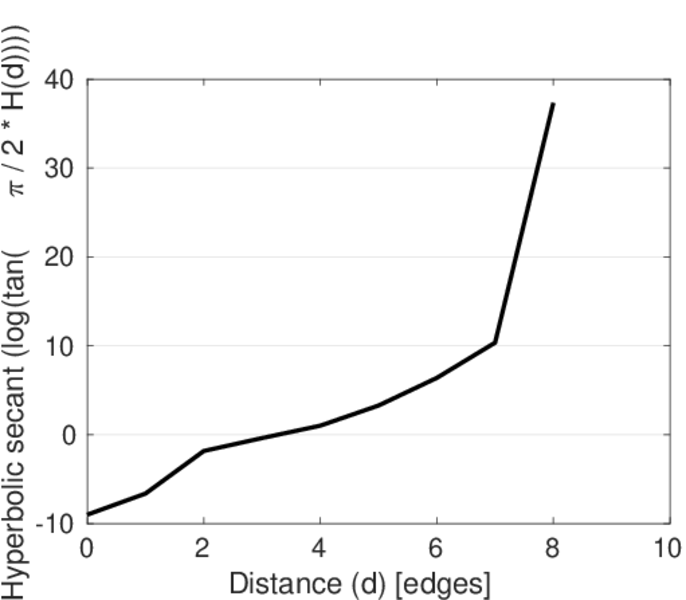
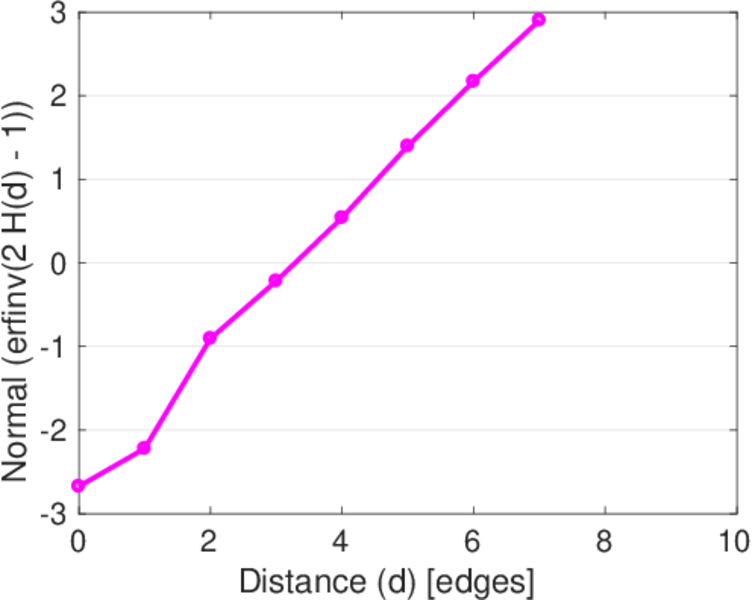
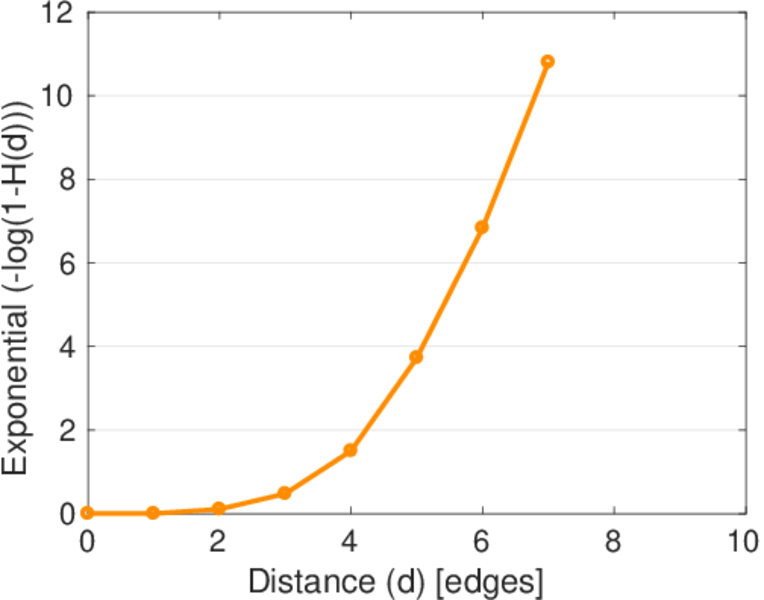
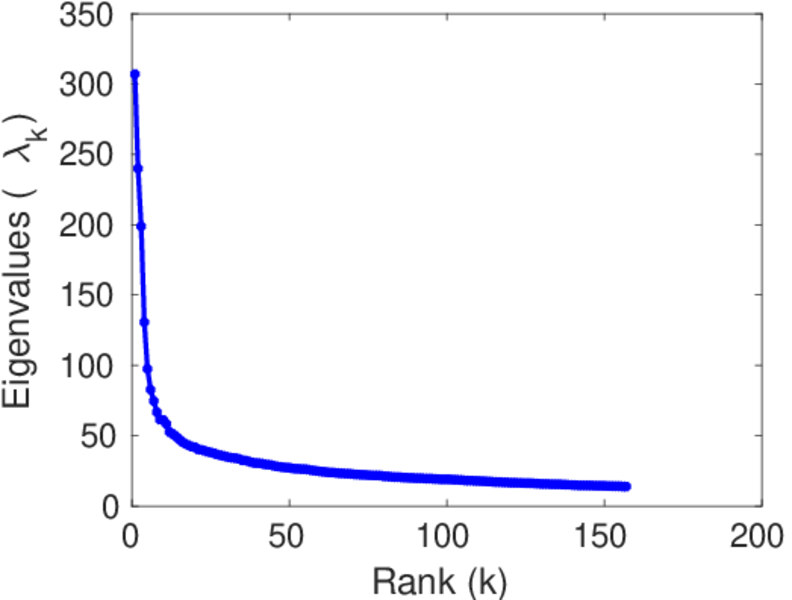
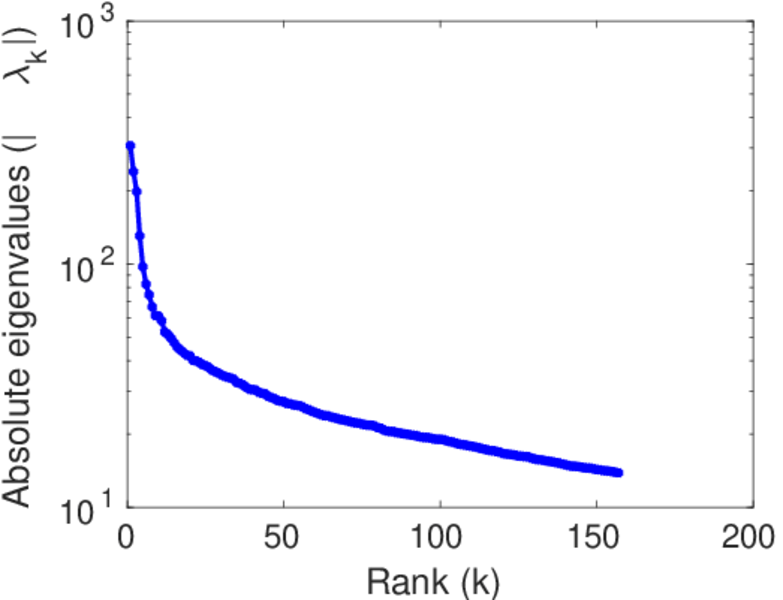
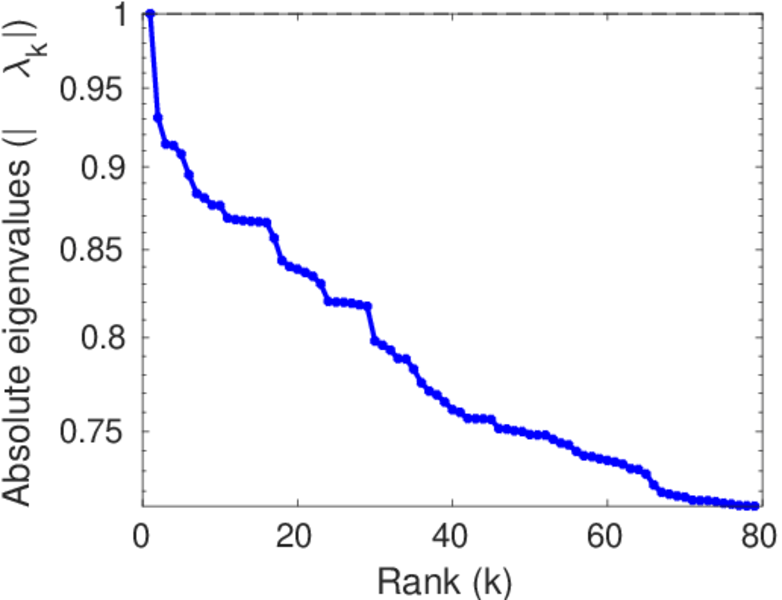
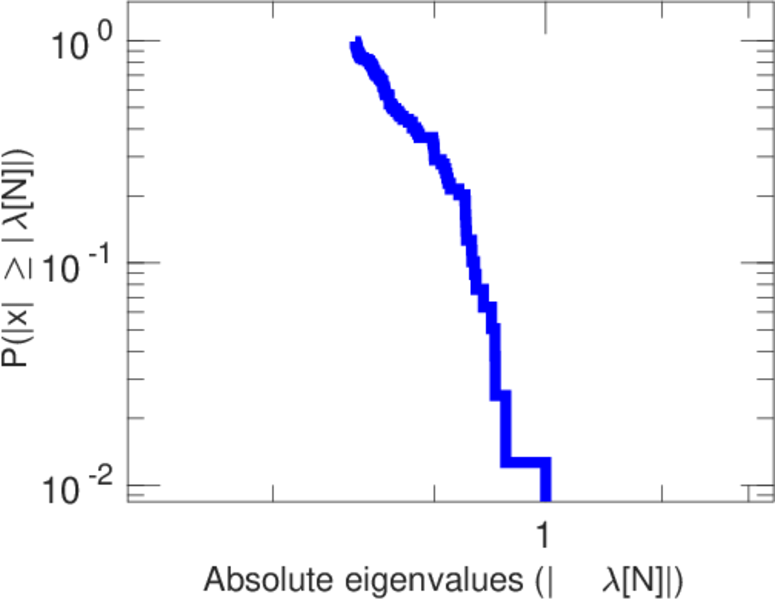
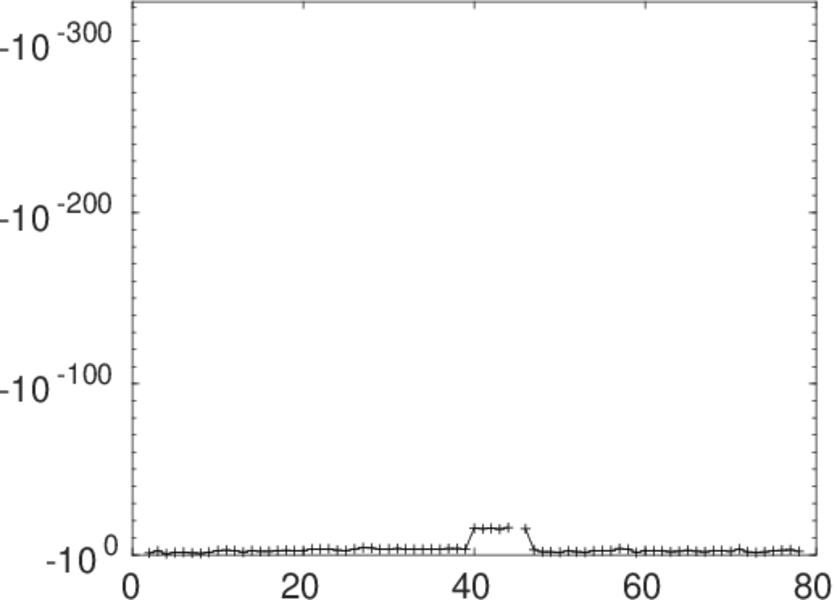
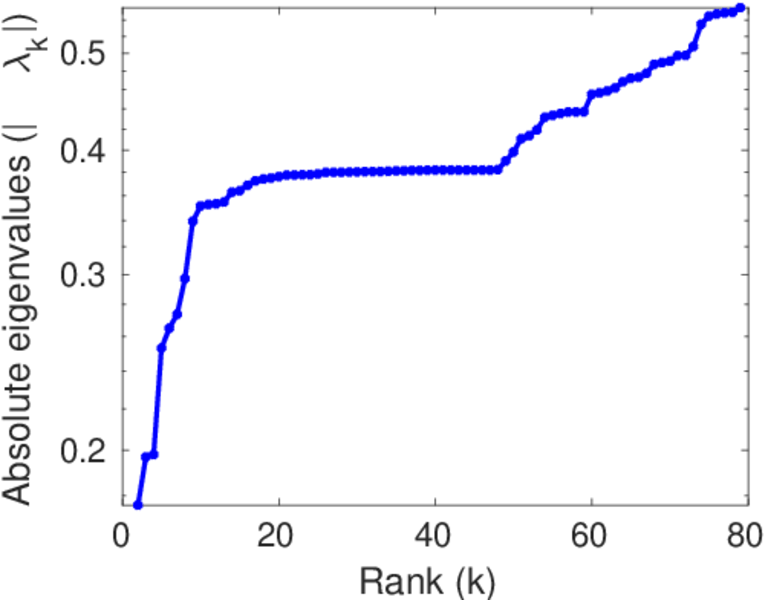
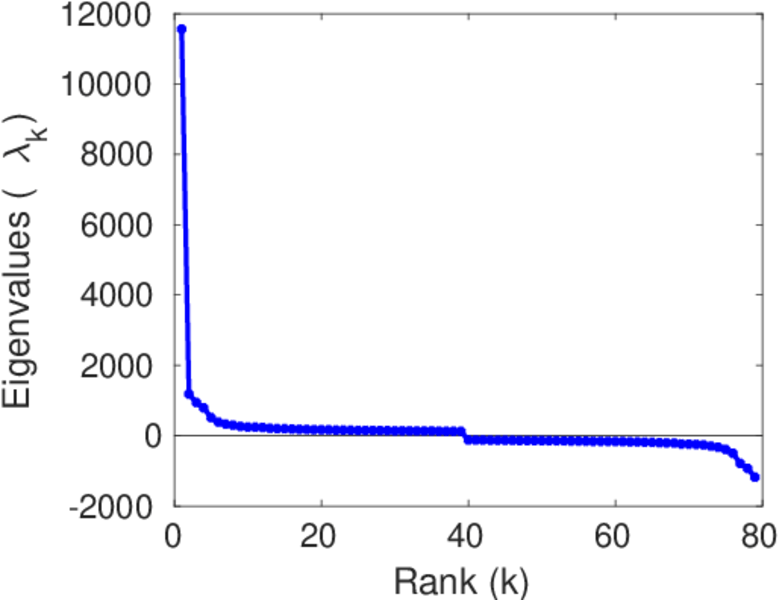
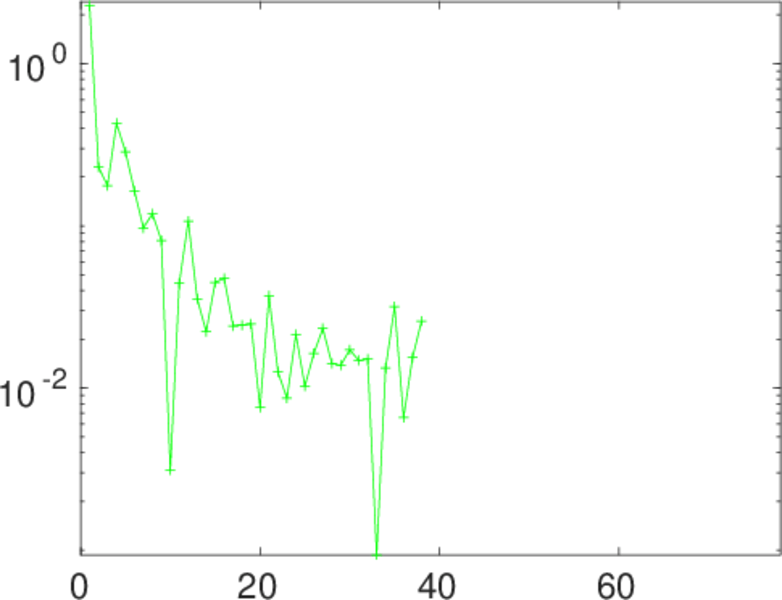
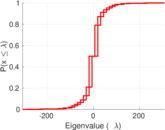
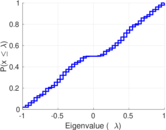
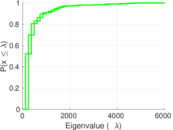
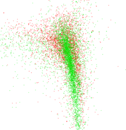
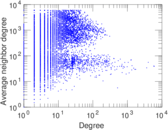
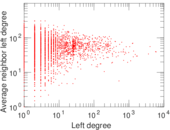
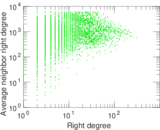
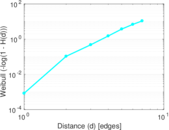
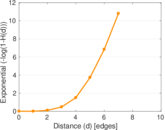
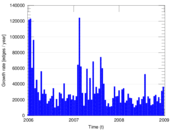
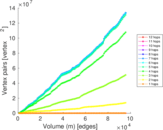
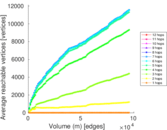
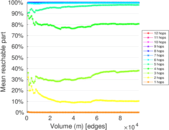
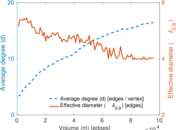
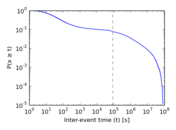
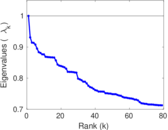
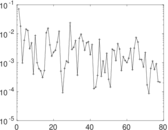
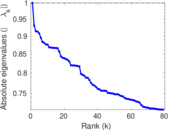
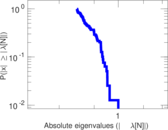
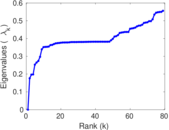
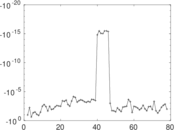
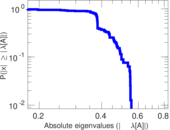
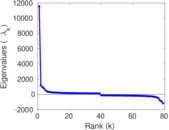
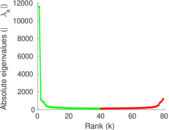
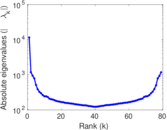
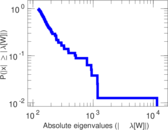
Plots


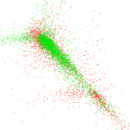


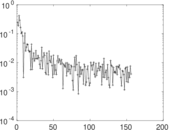
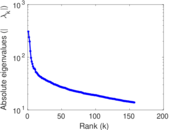
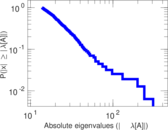
Matrix decompositions plots


Downloads
References
|
[1]
|
Jérôme Kunegis.
KONECT – The Koblenz Network Collection.
In Proc. Int. Conf. on World Wide Web Companion, pages
1343–1350, 2013.
[ http ]
|
|
[2]
|
GroupLens Research.
MovieLens data sets.
http://www.grouplens.org/node/73, October 2006.
|
 KONECT ‣ Networks ‣
Buy Me a Coffee
KONECT ‣ Networks ‣
Buy Me a Coffee