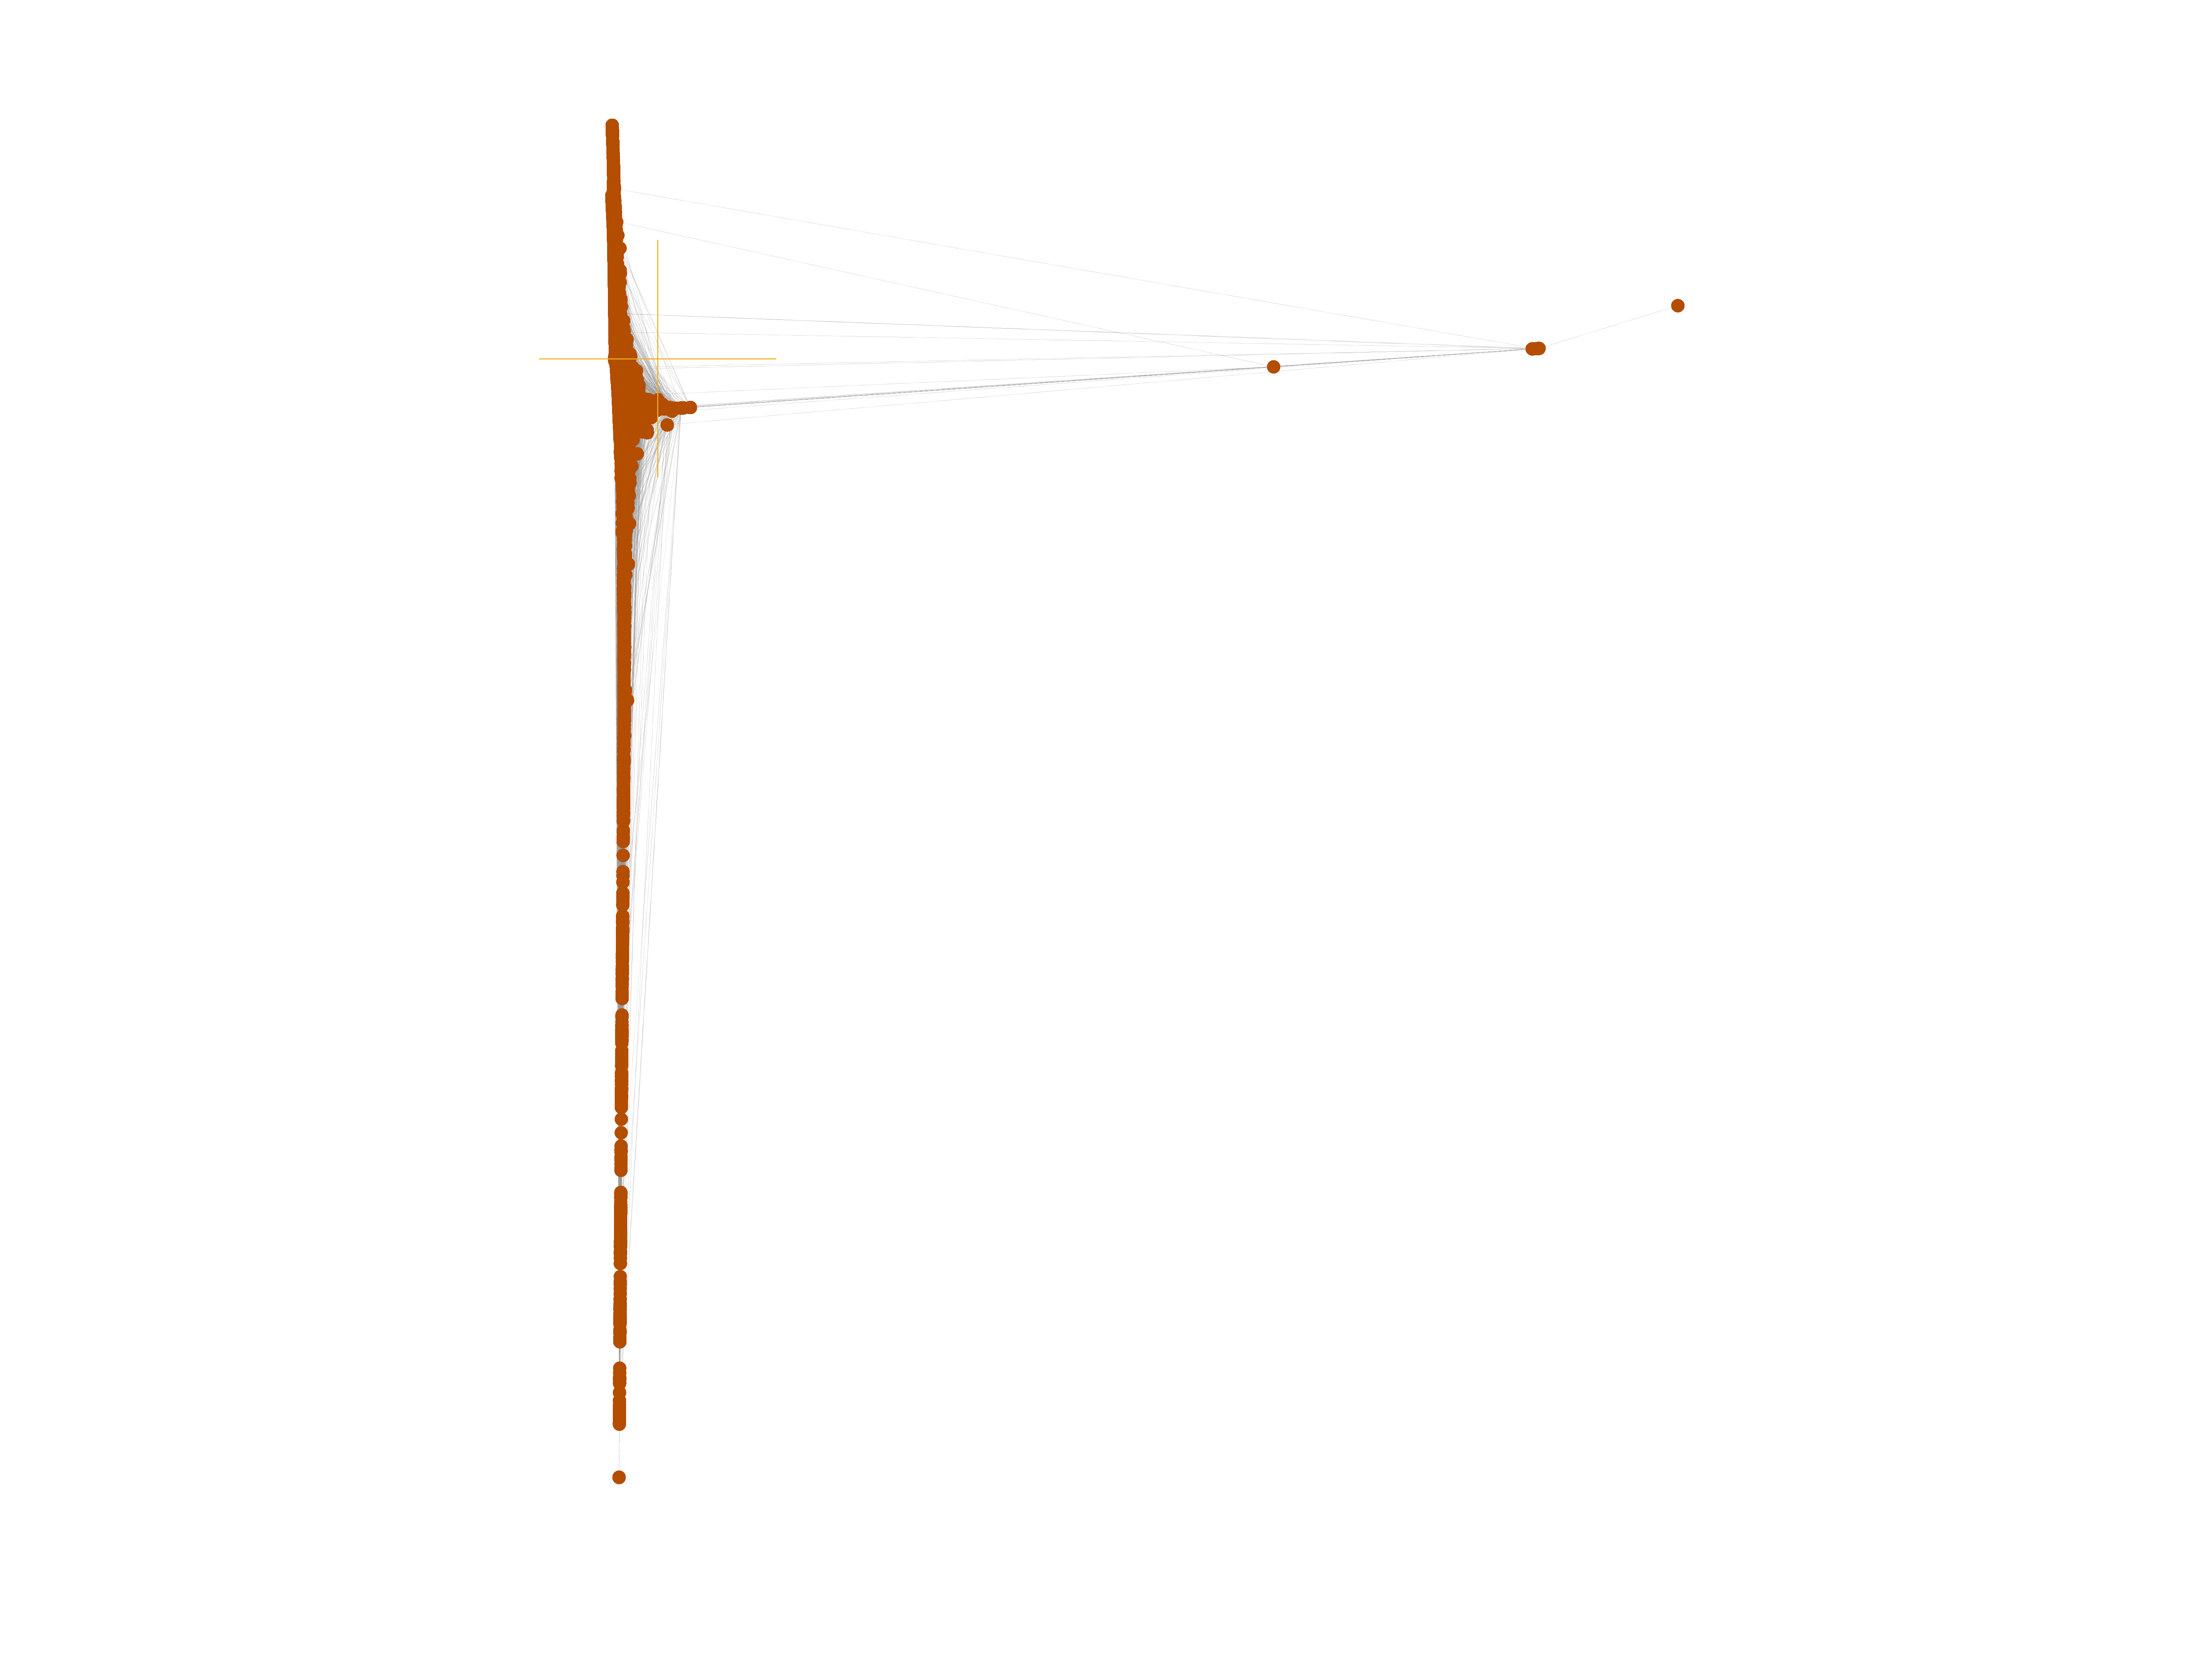
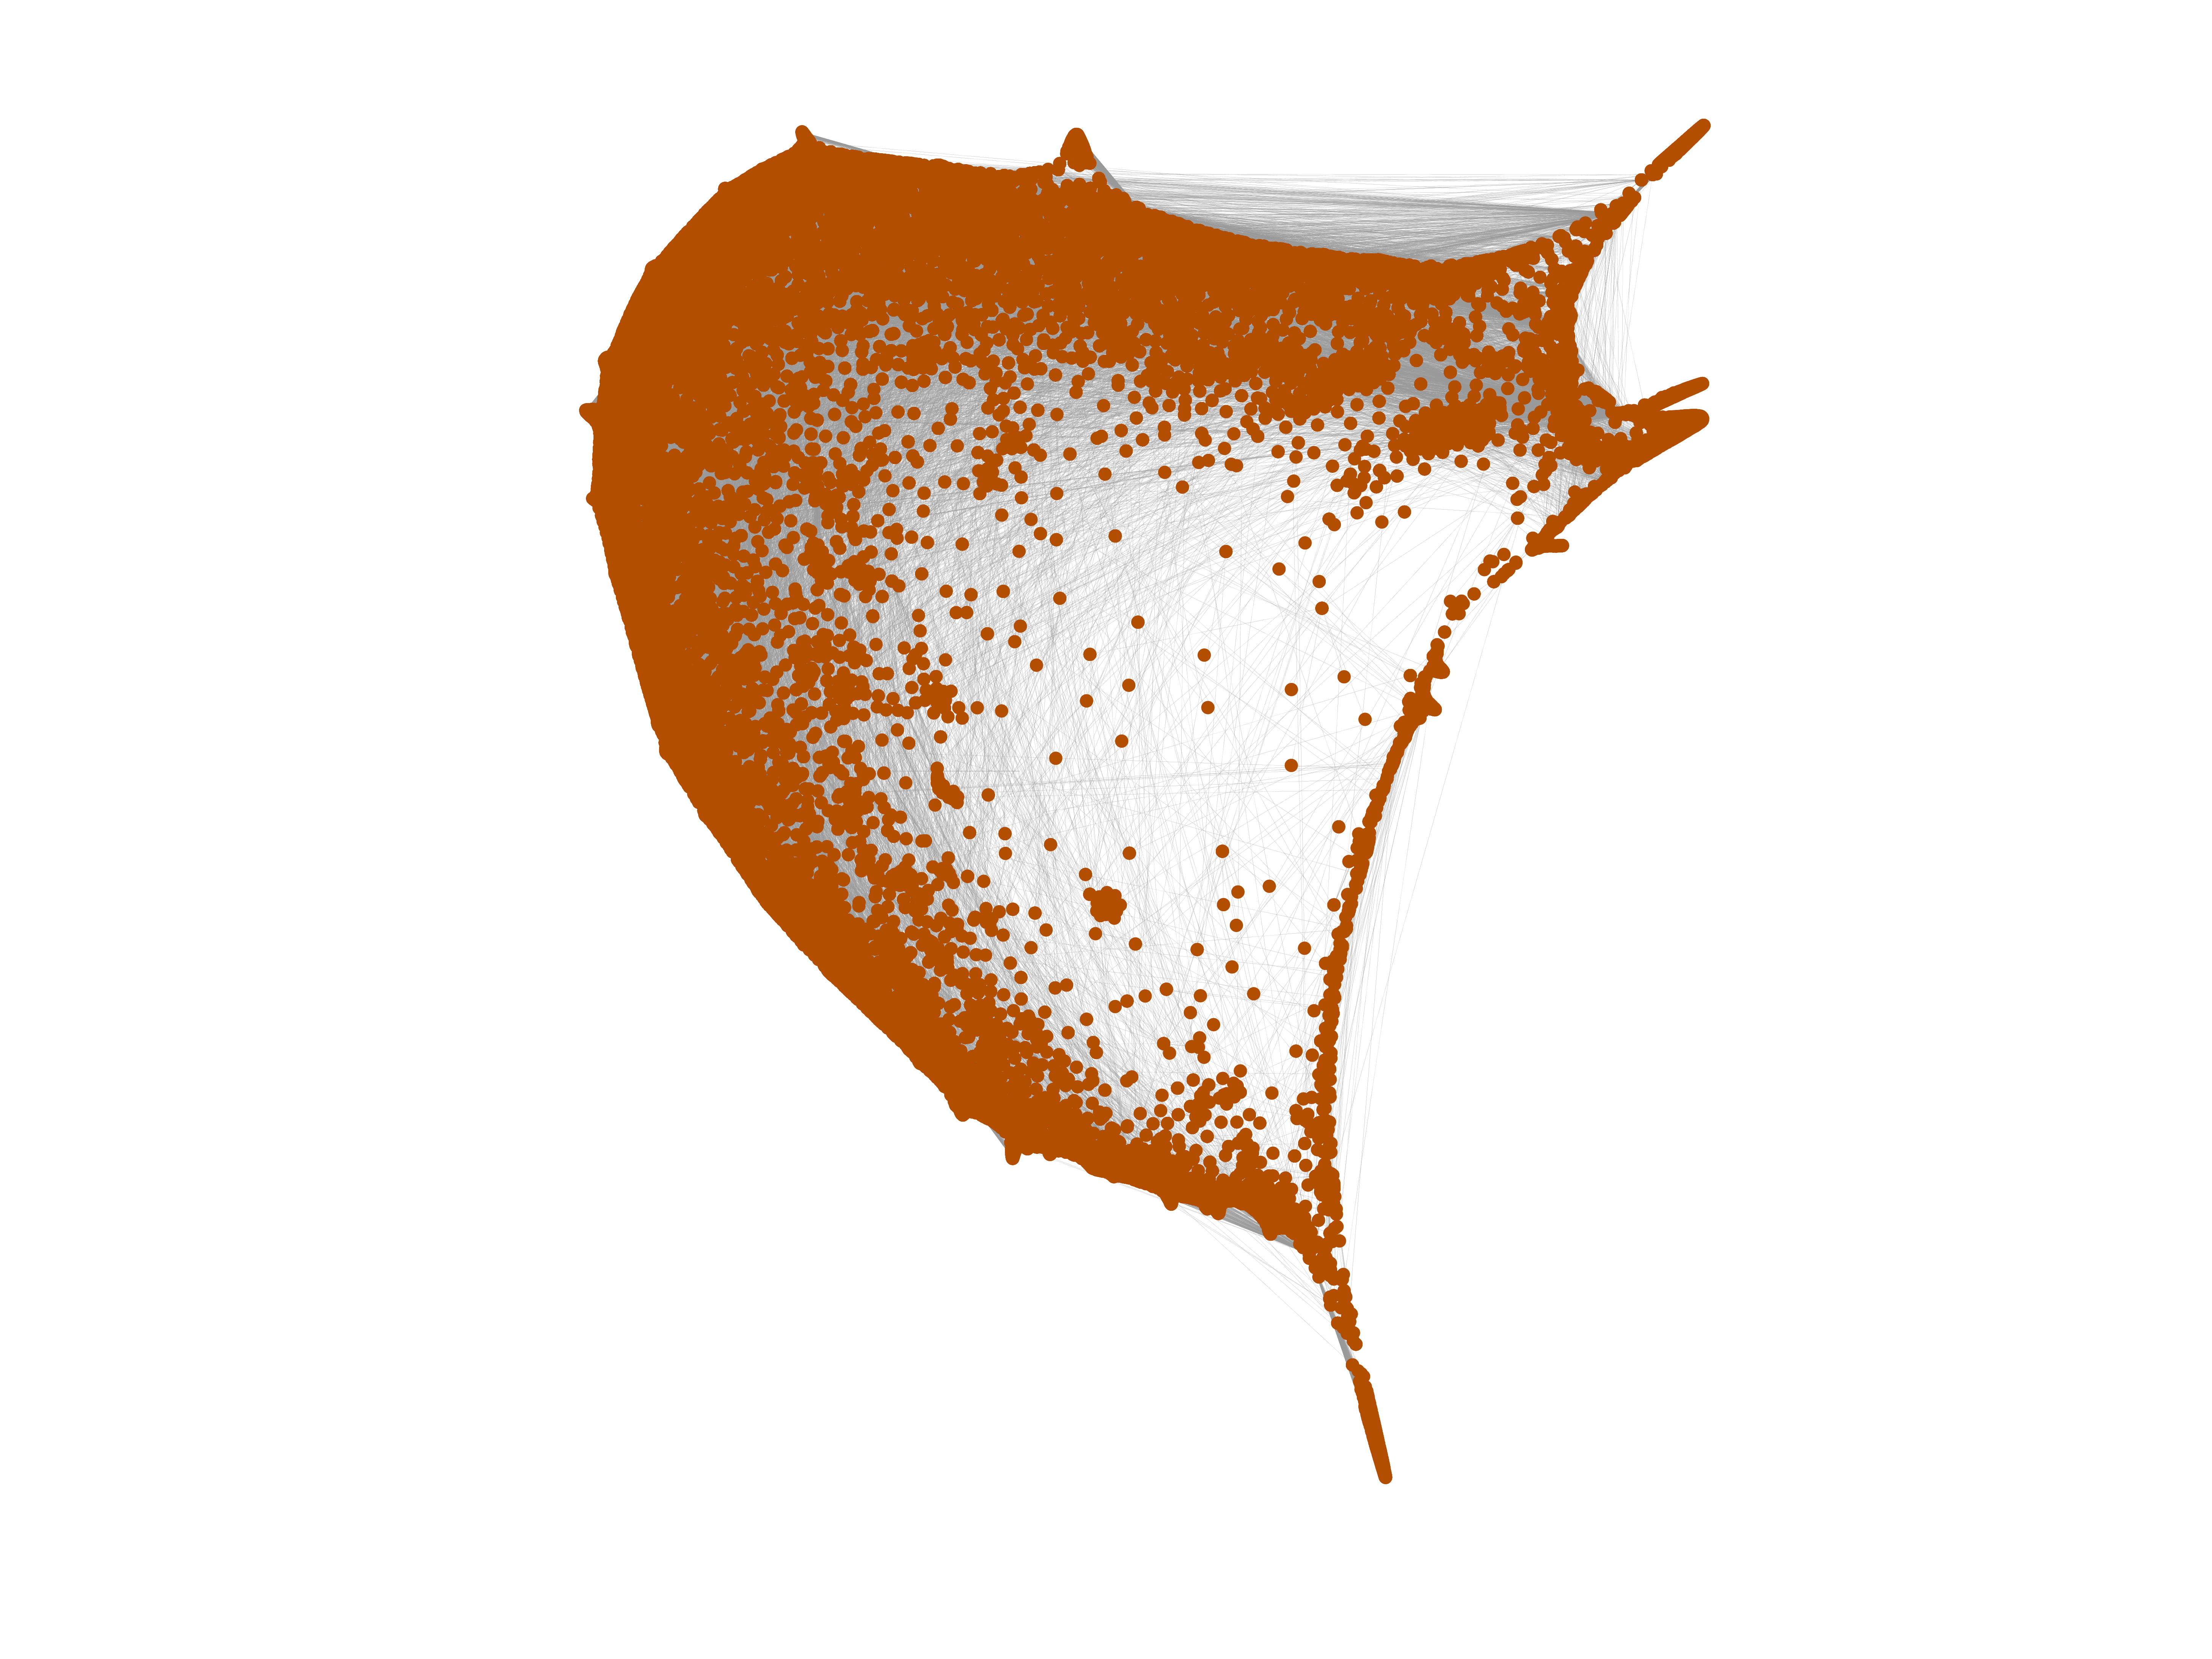
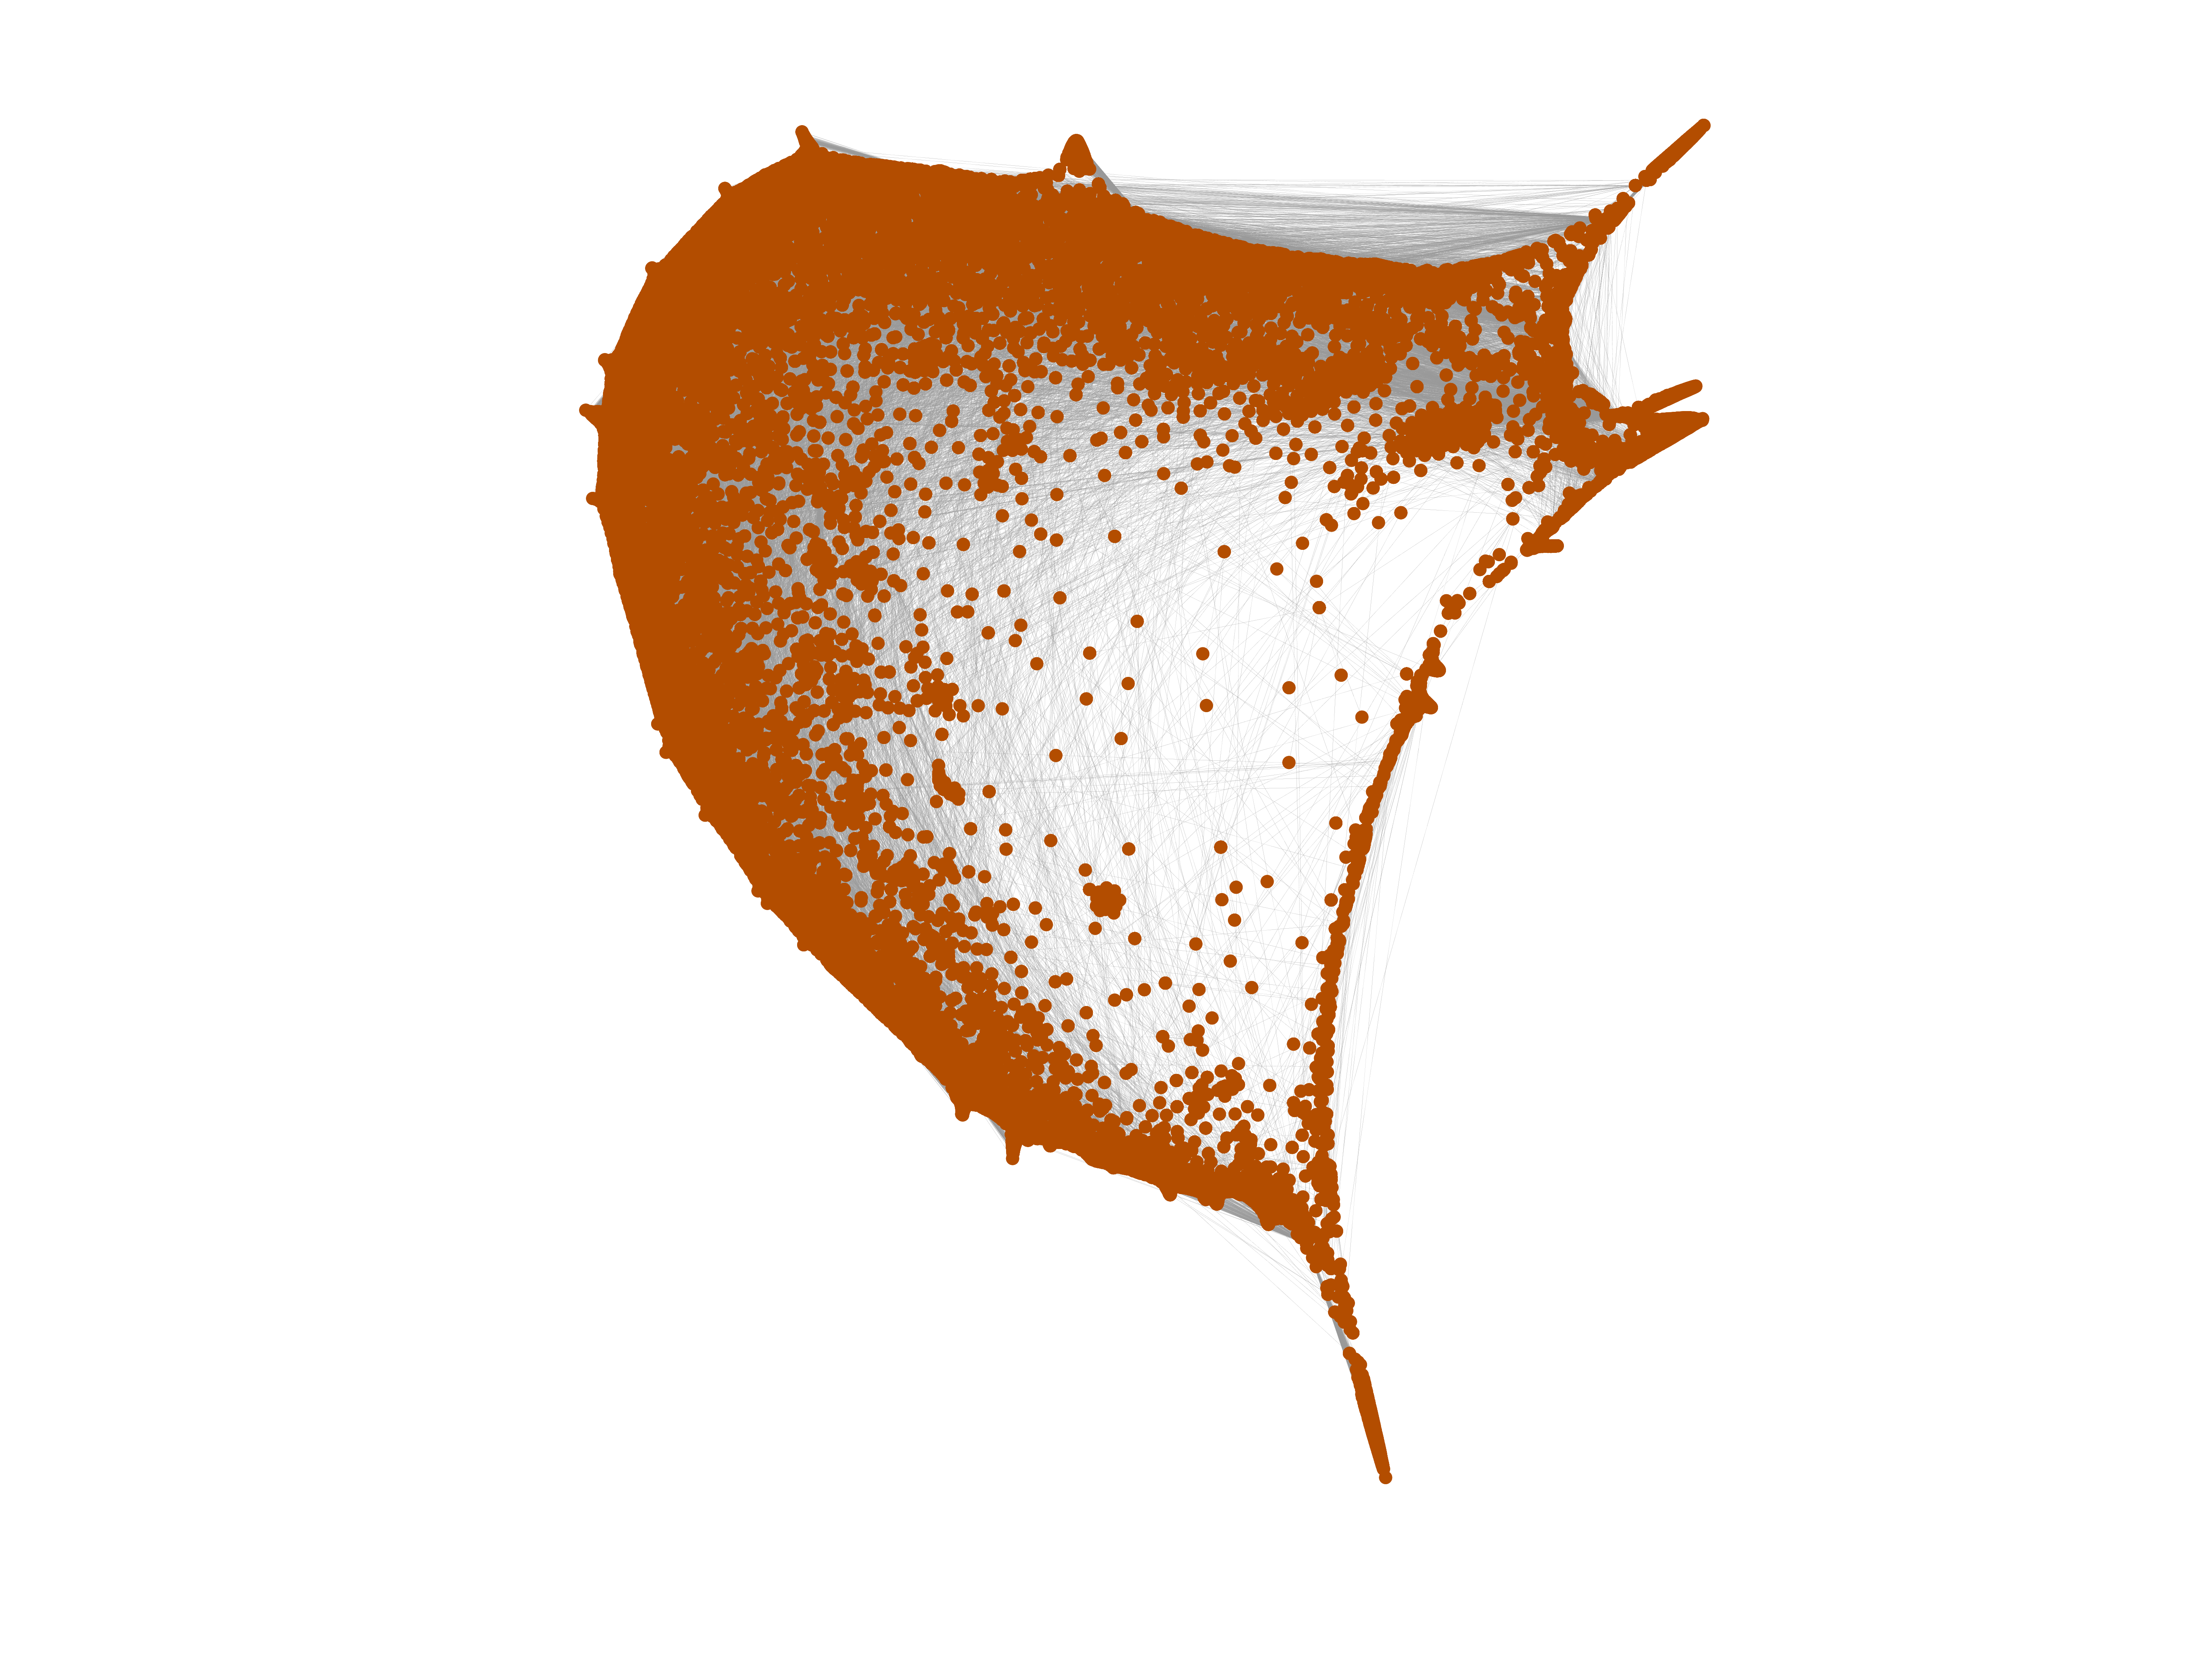
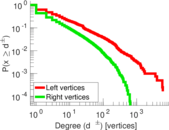
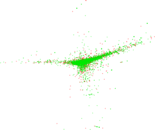
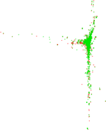
MovieLens user–tag
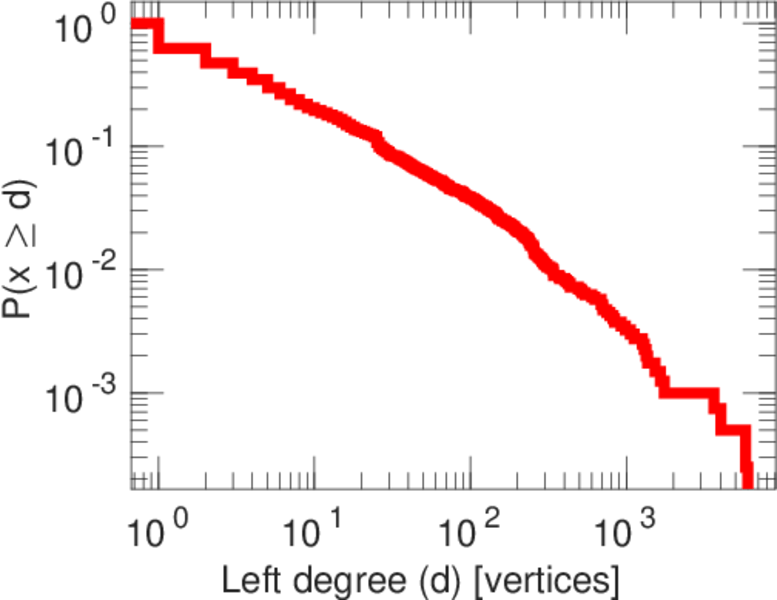
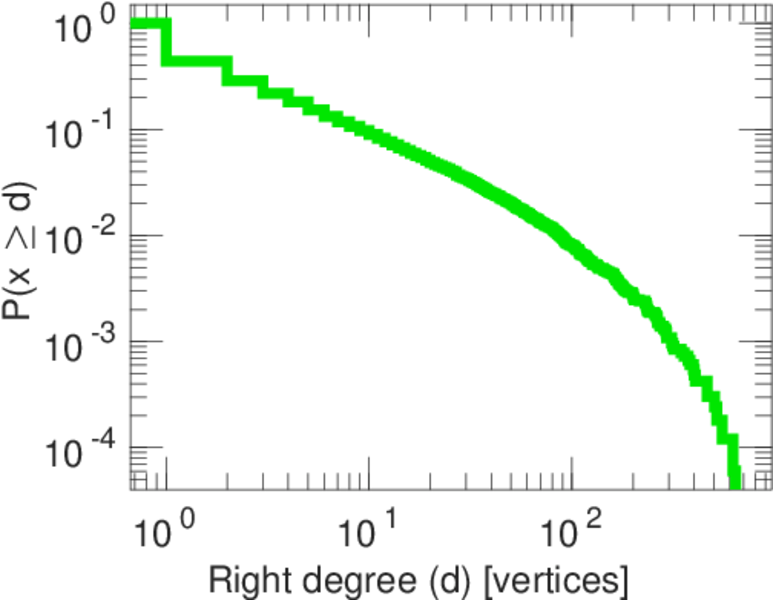
This bipartite network shows the tagging behaviour of 72,000 users of
http://movielens.umn.edu/. Left nodes are users and right nodes are tags. An
edge connects a user with a tag he applied to a movie.
Metadata
Statistics
| Size | n = | 20,537
|
| Left size | n1 = | 4,009
|
| Right size | n2 = | 16,528
|
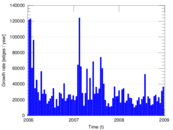
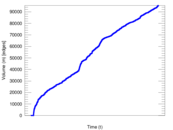
| Volume | m = | 95,580
|
| Unique edge count | m̿ = | 43,760
|
| Wedge count | s = | 8,091,394
|
| Claw count | z = | 3,409,576,286
|
| Cross count | x = | 1,454,031,072,304
|
| Square count | q = | 1,580,737
|
| 4-Tour count | T4 = | 45,103,872
|
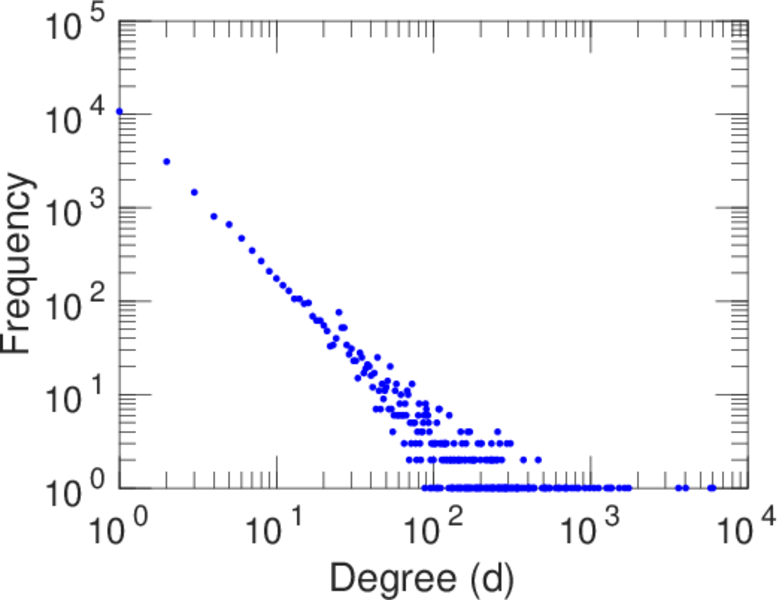
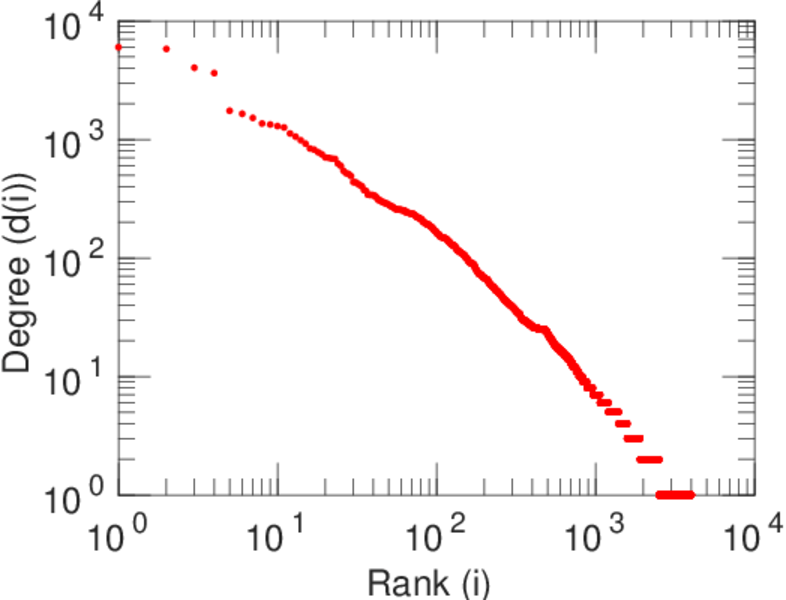
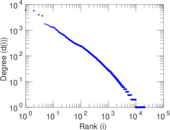
| Maximum degree | dmax = | 6,012
|
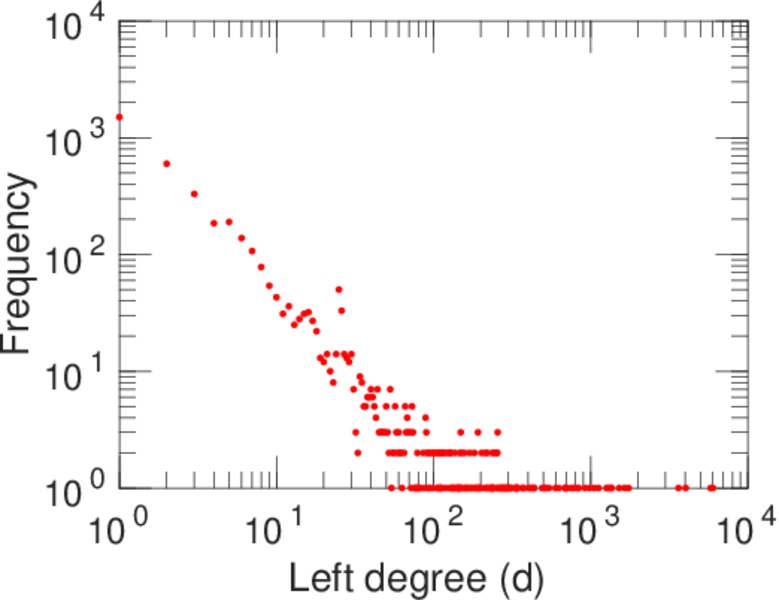
| Maximum left degree | d1max = | 6,012
|
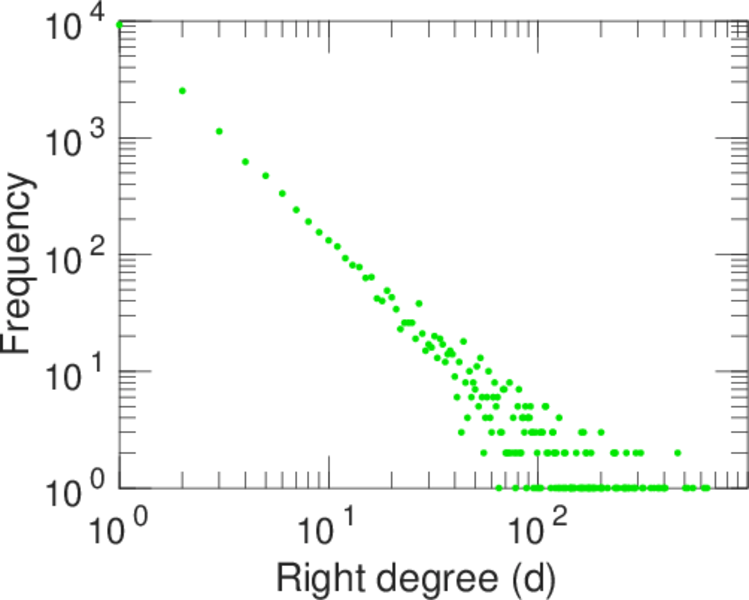
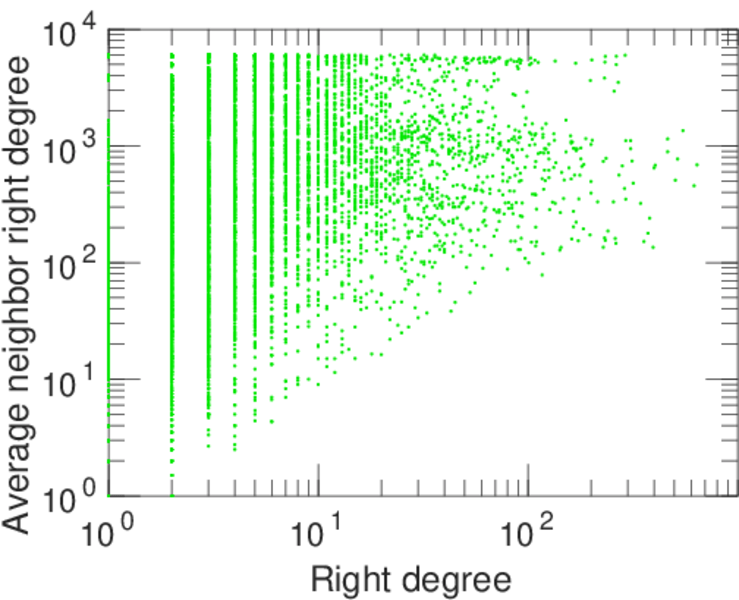
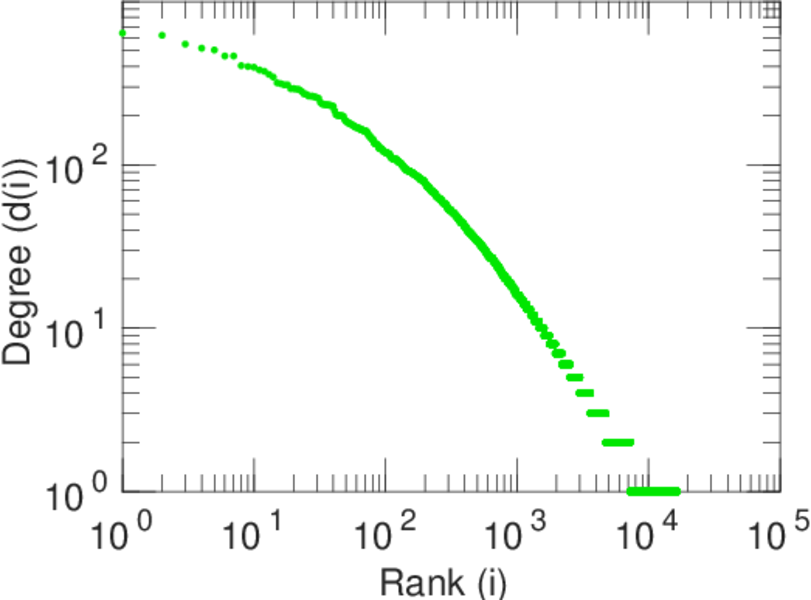
| Maximum right degree | d2max = | 641
|
| Average degree | d = | 9.308 08
|
| Average left degree | d1 = | 23.841 4
|
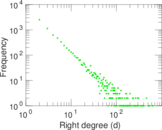
| Average right degree | d2 = | 5.782 91
|
| Fill | p = | 0.000 660 421
|
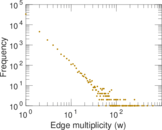
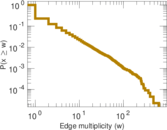
| Average edge multiplicity | m̃ = | 2.184 19
|
| Size of LCC | N = | 19,665
|
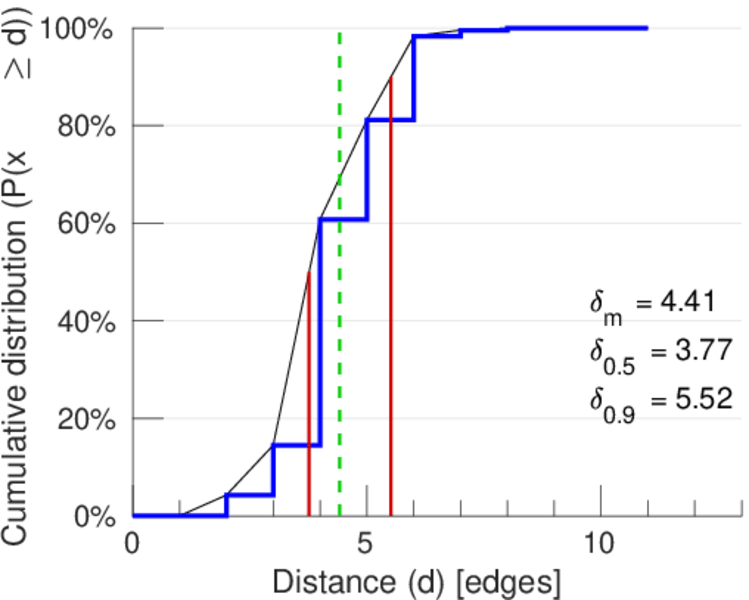
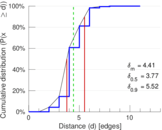
| Diameter | δ = | 14
|
| 50-Percentile effective diameter | δ0.5 = | 3.767 09
|
| 90-Percentile effective diameter | δ0.9 = | 5.515 21
|
| Median distance | δM = | 4
|
| Mean distance | δm = | 4.414 66
|
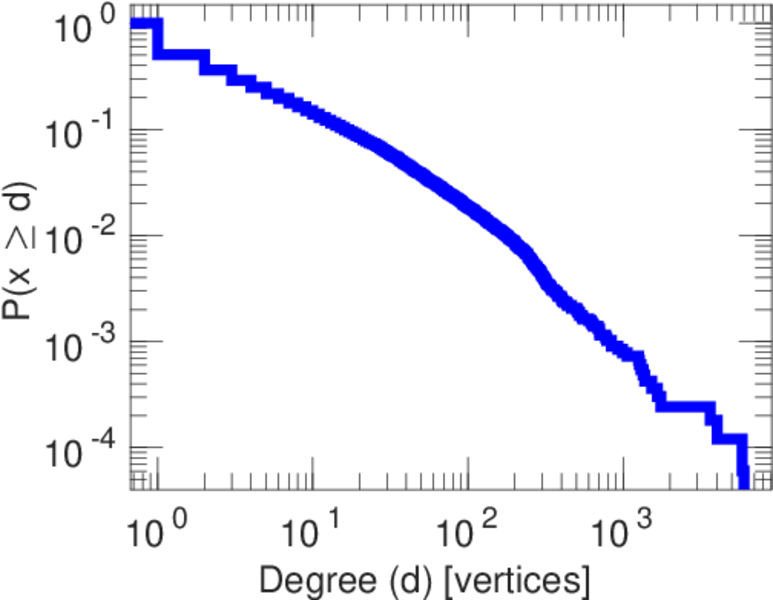
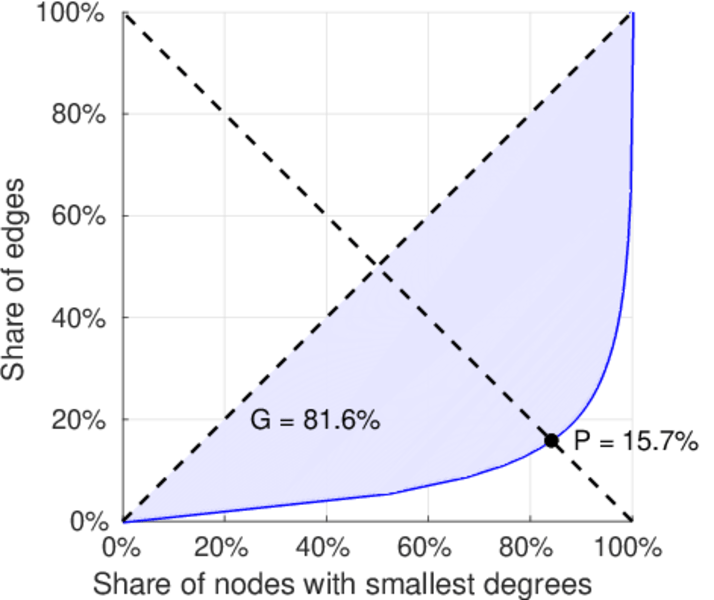
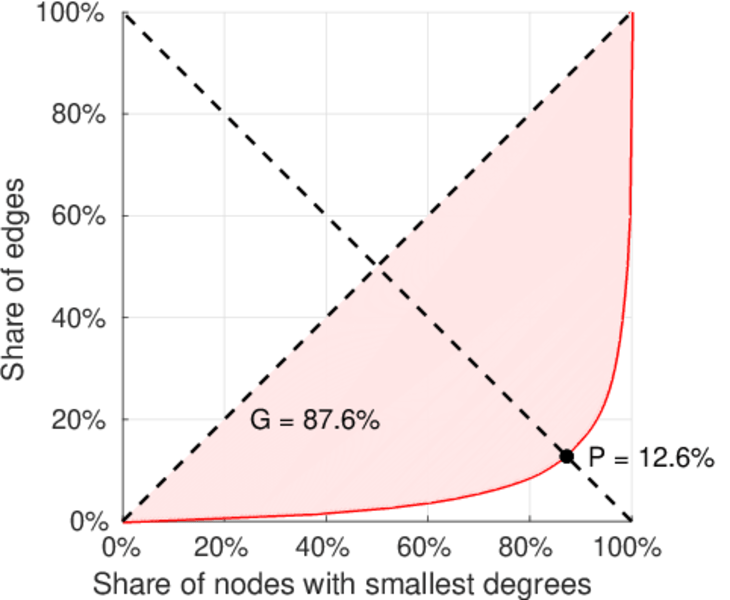
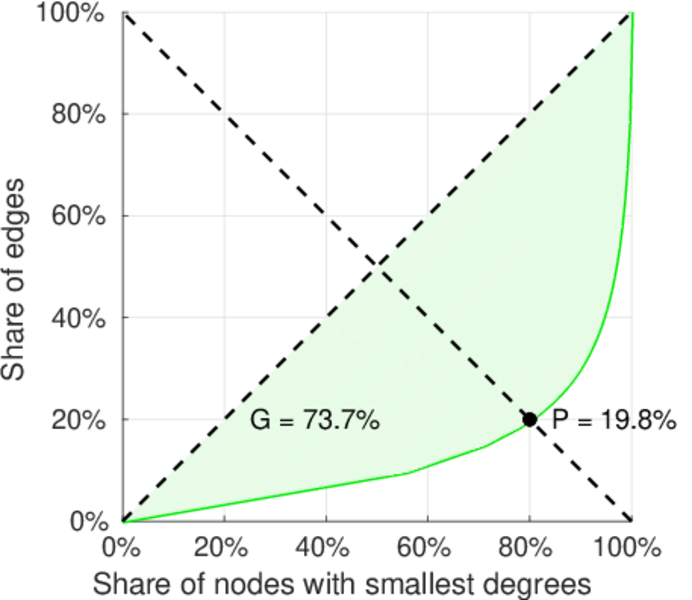
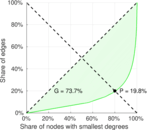
| Gini coefficient | G = | 0.828 724
|
| Balanced inequality ratio | P = | 0.152 767
|
| Left balanced inequality ratio | P1 = | 0.125 811
|
| Right balanced inequality ratio | P2 = | 0.198 347
|
| Relative edge distribution entropy | Her = | 0.841 697
|
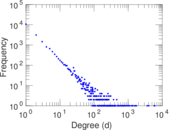
| Power law exponent | γ = | 2.755 53
|
| Tail power law exponent | γt = | 2.001 00
|
| Tail power law exponent with p | γ3 = | 2.001 00
|
| p-value | p = | 0.001 000 00
|
| Left tail power law exponent with p | γ3,1 = | 2.061 00
|
| Left p-value | p1 = | 0.058 000 0
|
| Right tail power law exponent with p | γ3,2 = | 2.161 00
|
| Right p-value | p2 = | 0.103 000
|
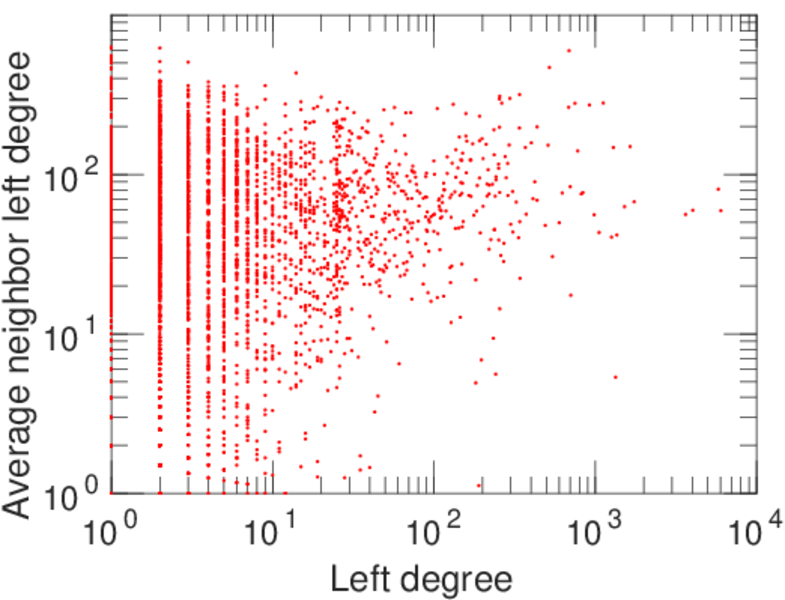
| Degree assortativity | ρ = | −0.180 095
|
| Degree assortativity p-value | pρ = | 1.072 44 × 10−315
|
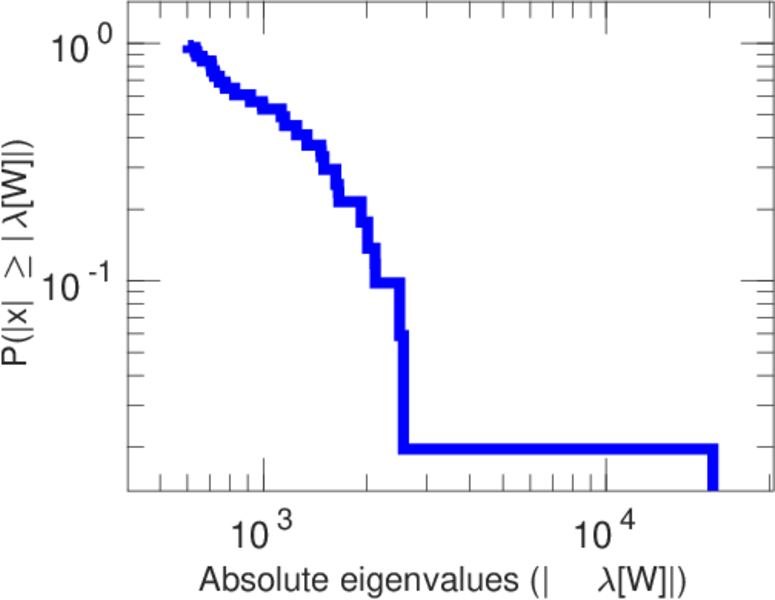
| Spectral norm | α = | 640.915
|
| Algebraic connectivity | a = | 0.027 834 6
|
| Spectral separation | |λ1[A] / λ2[A]| = | 1.023 22
|
| Controllability | C = | 14,029
|
| Relative controllability | Cr = | 0.683 109
|
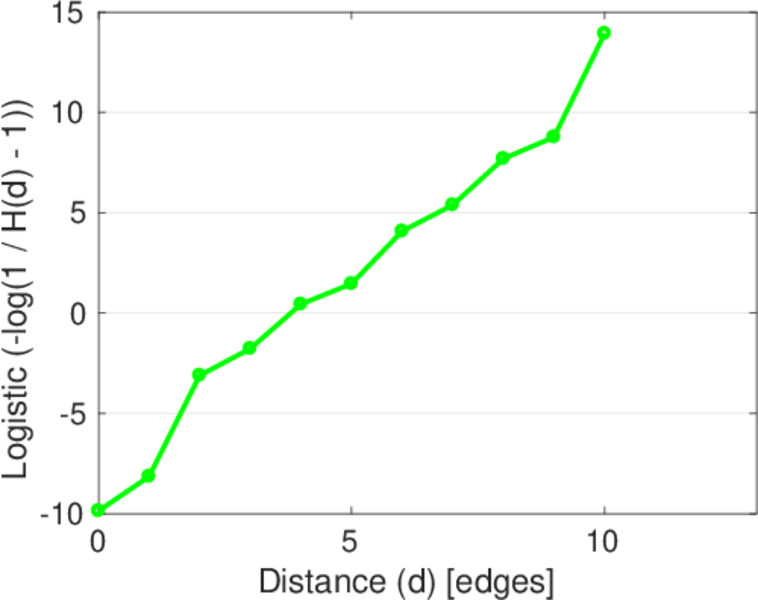
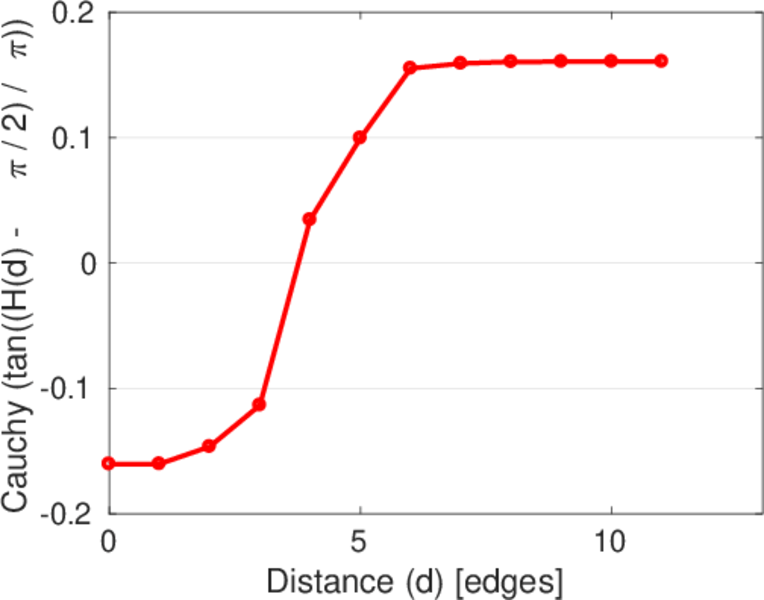
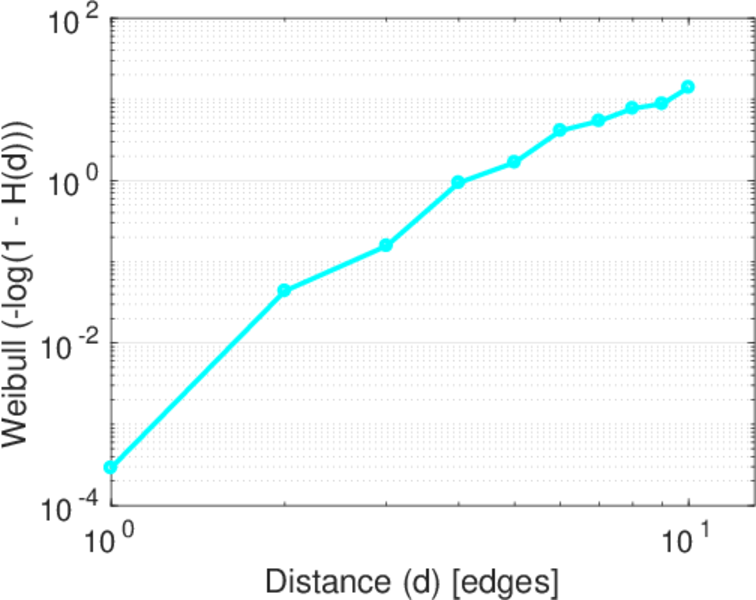
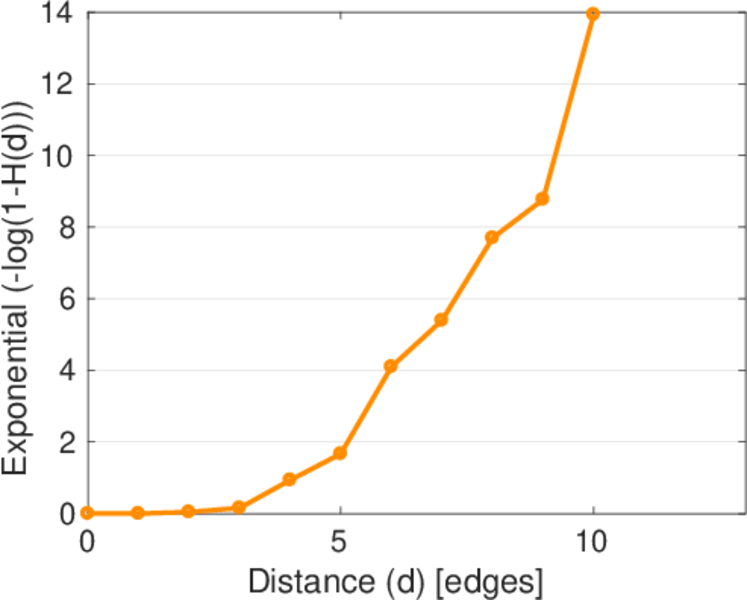
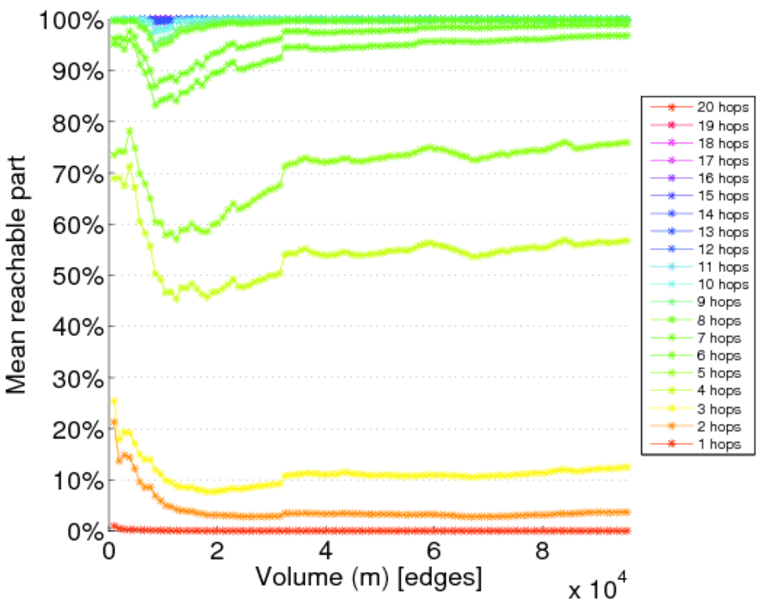
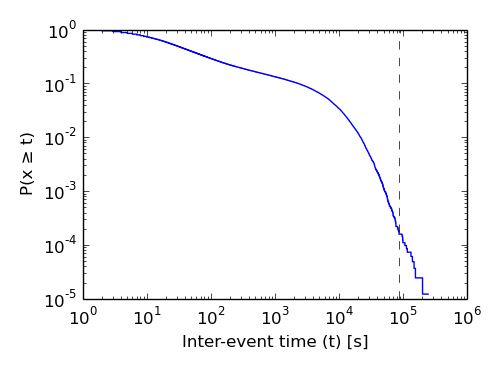
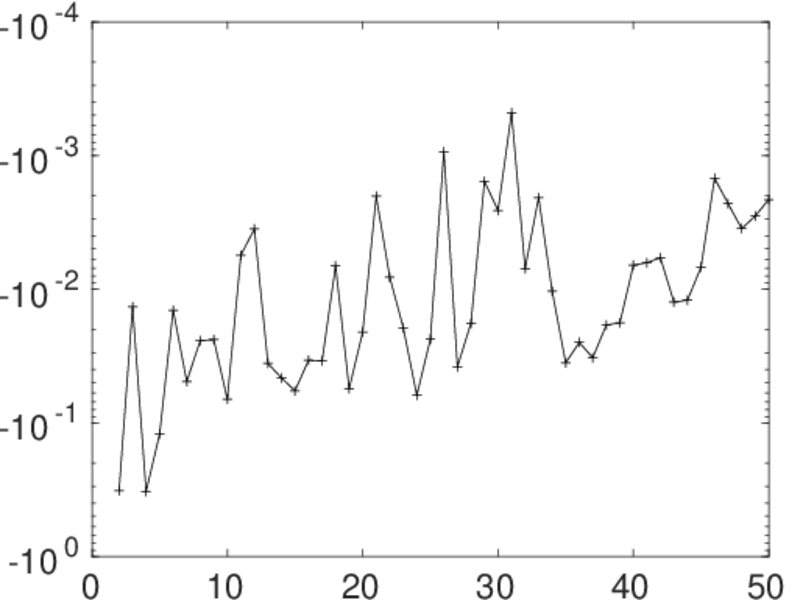
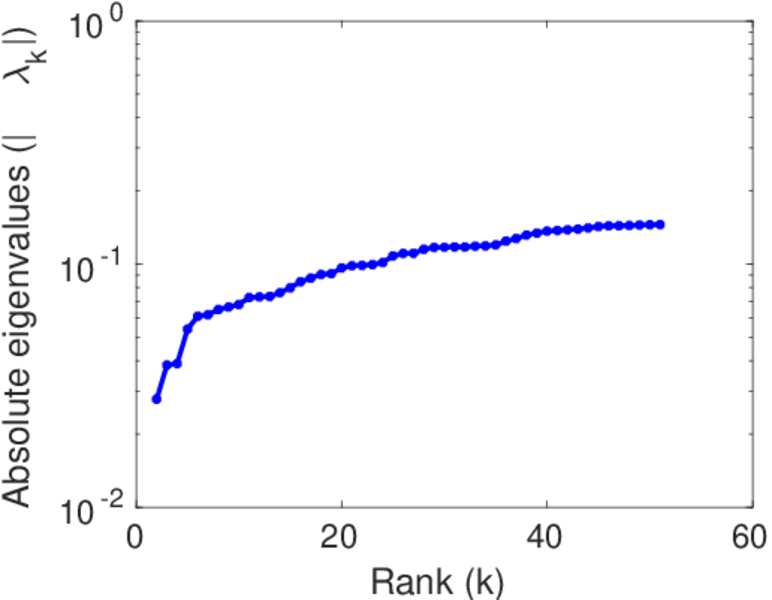
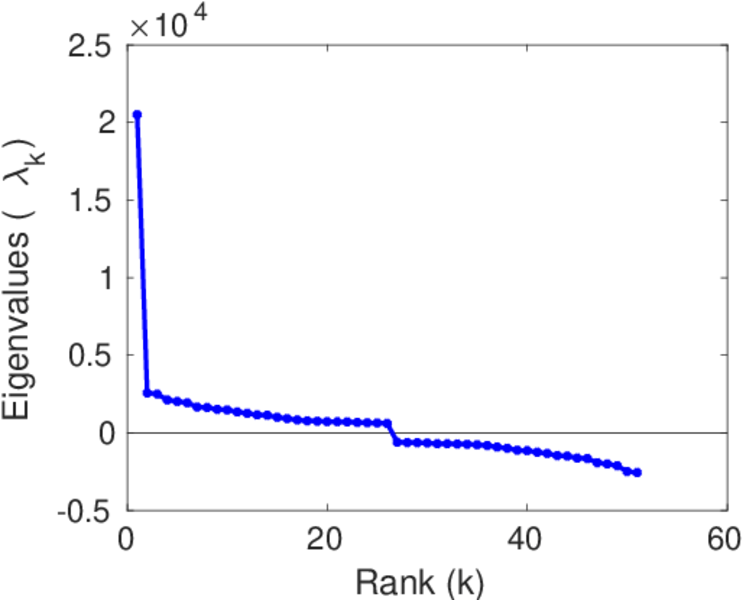
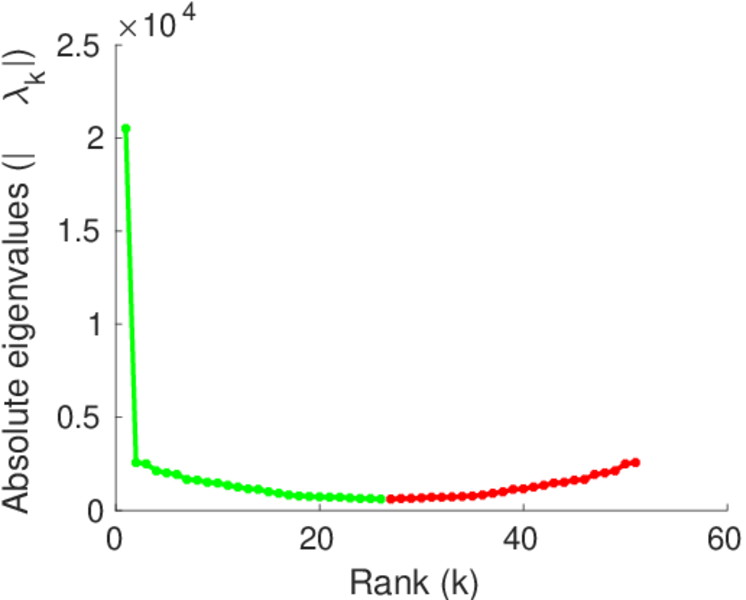
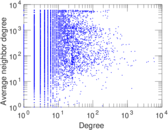
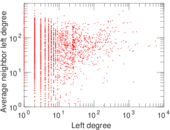
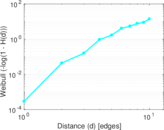
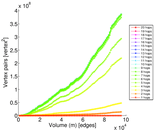
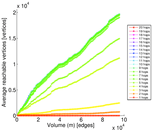
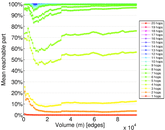
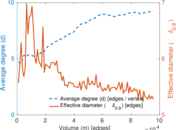
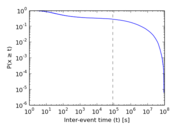
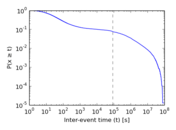
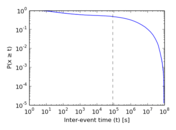
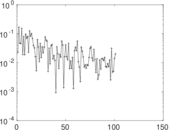
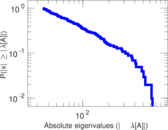
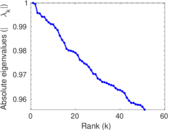
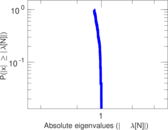
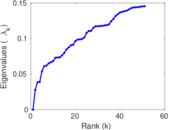
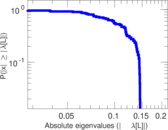
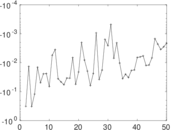
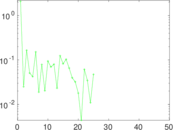
Plots


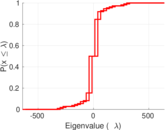

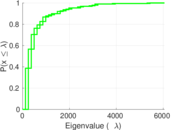


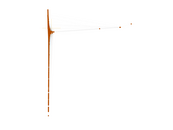


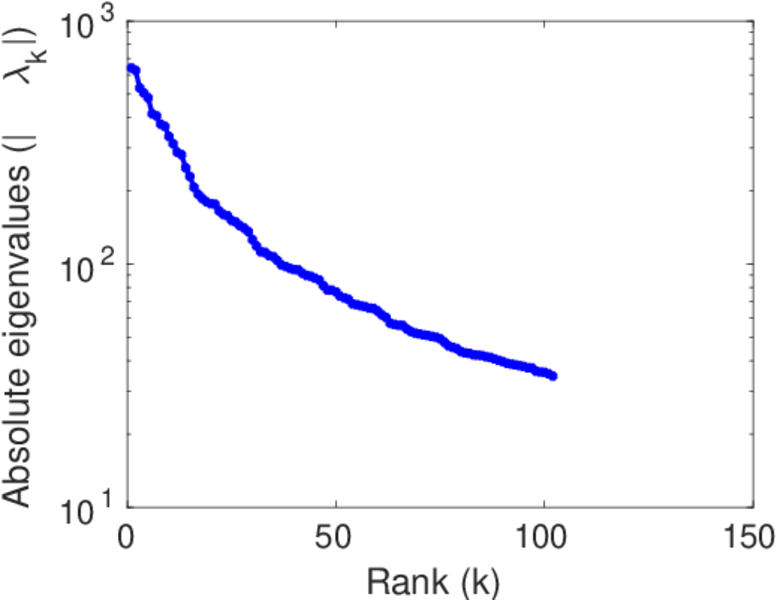
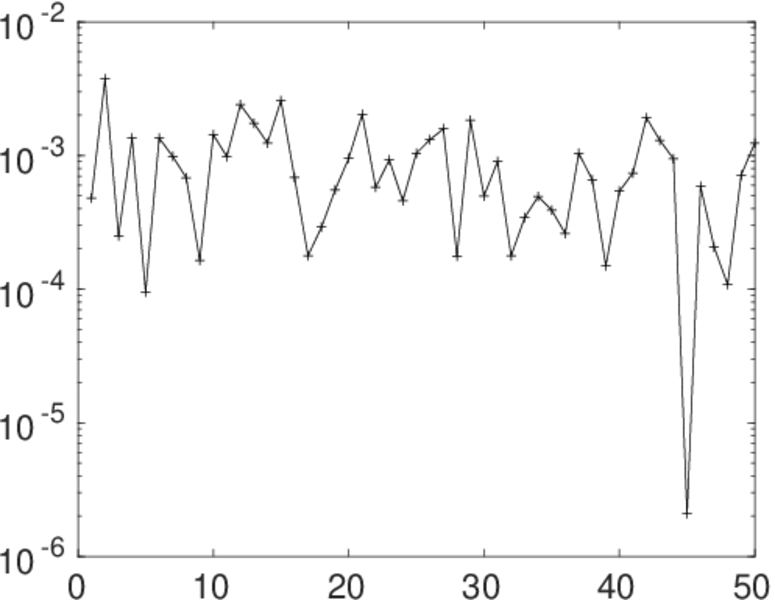
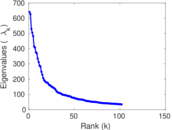
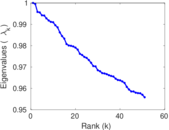
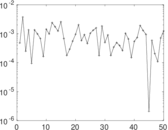
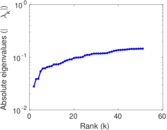
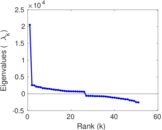
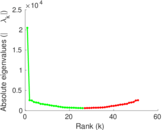
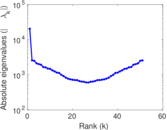
Matrix decompositions plots


Downloads
References
|
[1]
|
Jérôme Kunegis.
KONECT – The Koblenz Network Collection.
In Proc. Int. Conf. on World Wide Web Companion, pages
1343–1350, 2013.
[ http ]
|
|
[2]
|
GroupLens Research.
MovieLens data sets.
http://www.grouplens.org/node/73, October 2006.
|
 KONECT ‣ Networks ‣
Buy Me a Coffee
KONECT ‣ Networks ‣
Buy Me a Coffee