MovieLens 1M
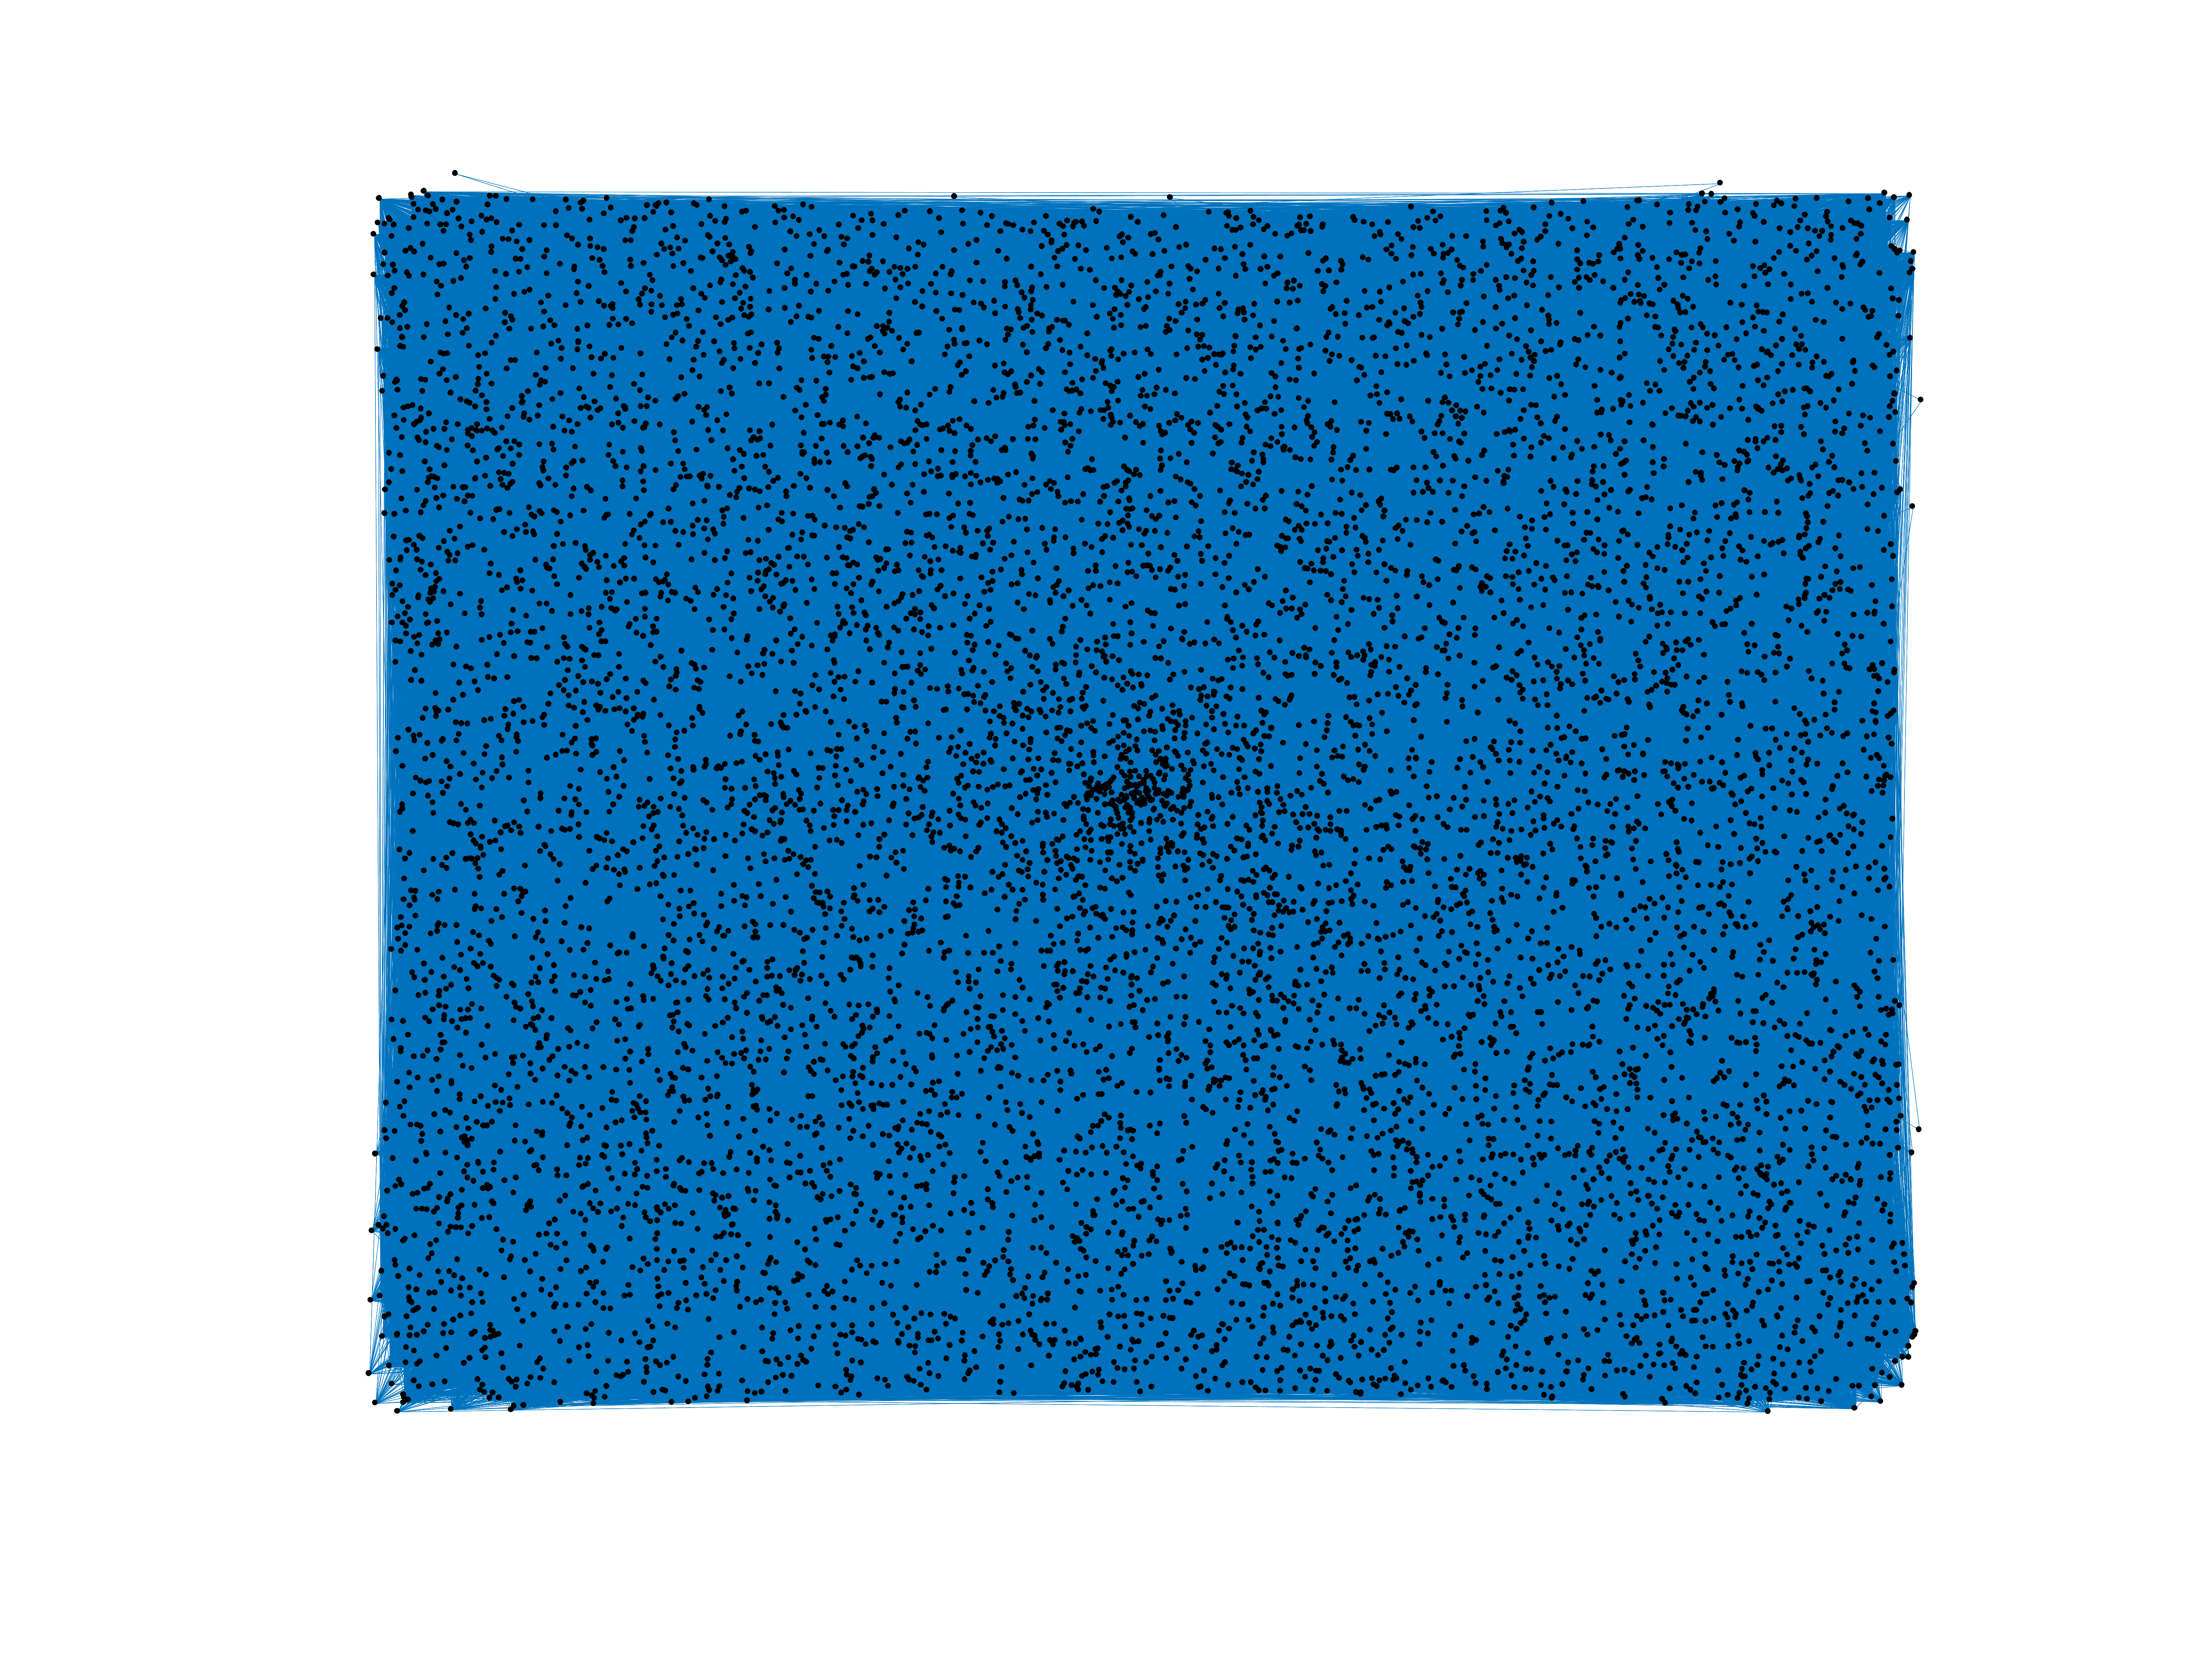
This bipartite network contains one million movie ratings from
http://movielens.umn.edu/. Left nodes are users and right nodes are movies. An
edge between a user and a movie shows that the user has rated the movie.
Metadata
Statistics
| Size | n = | 9,746
|
| Left size | n1 = | 6,040
|
| Right size | n2 = | 3,706
|
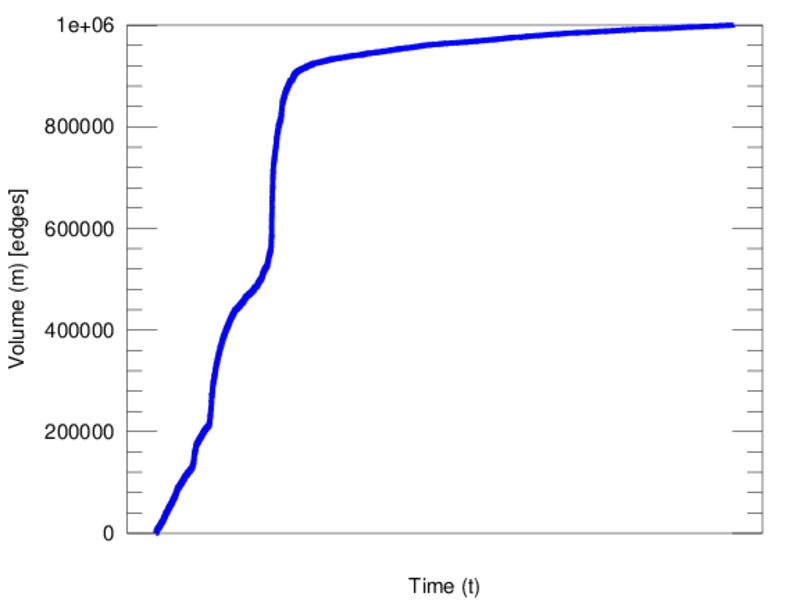
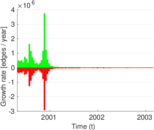
| Volume | m = | 1,000,209
|
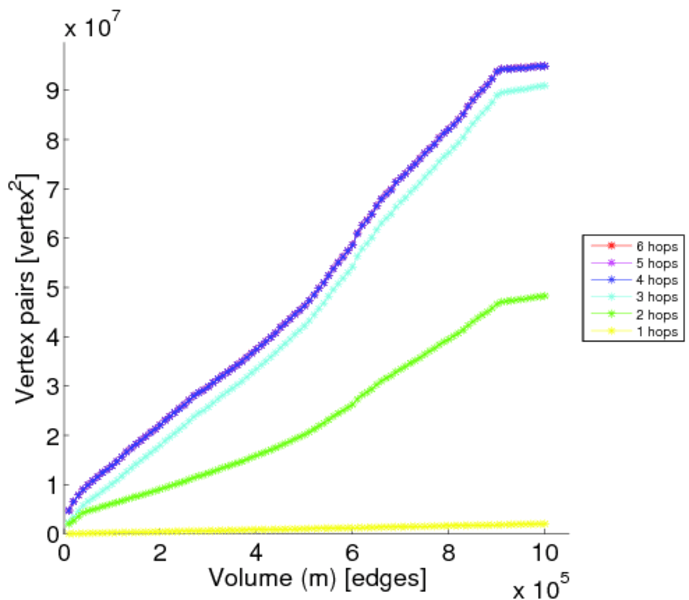
| Wedge count | s = | 602,009,923
|
| Cross count | x = | 92,787,513,219,316
|
| Square count | q = | 16,671,201,295
|
| 4-Tour count | T4 = | 135,780,401,238
|
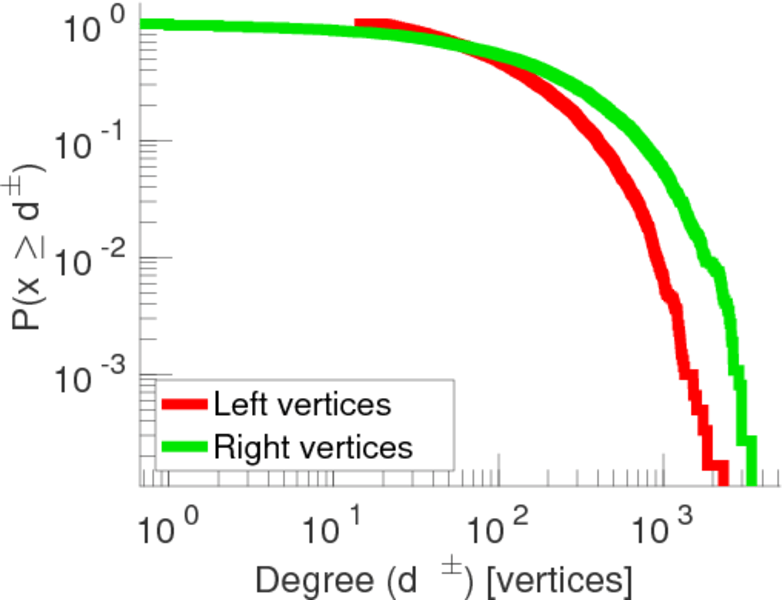
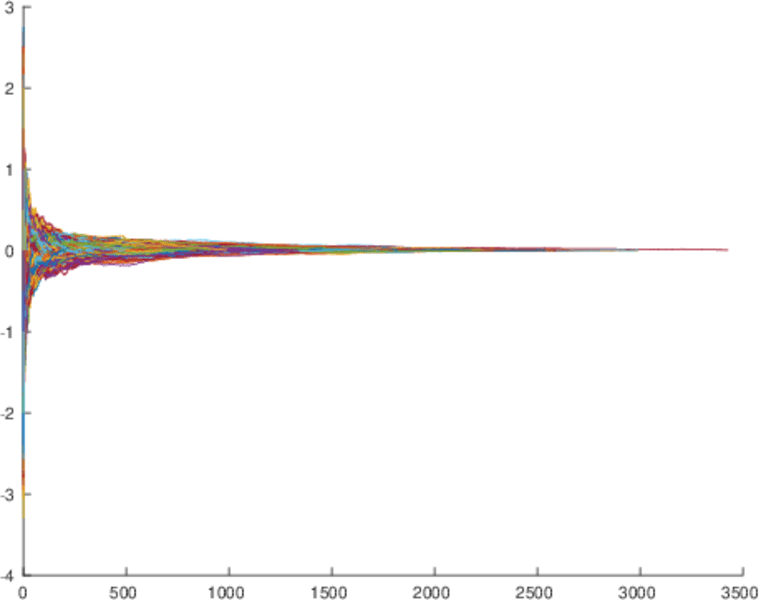
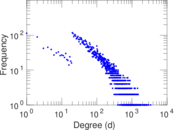
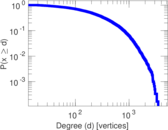
| Maximum degree | dmax = | 3,428
|
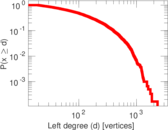
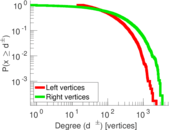
| Maximum left degree | d1max = | 2,314
|
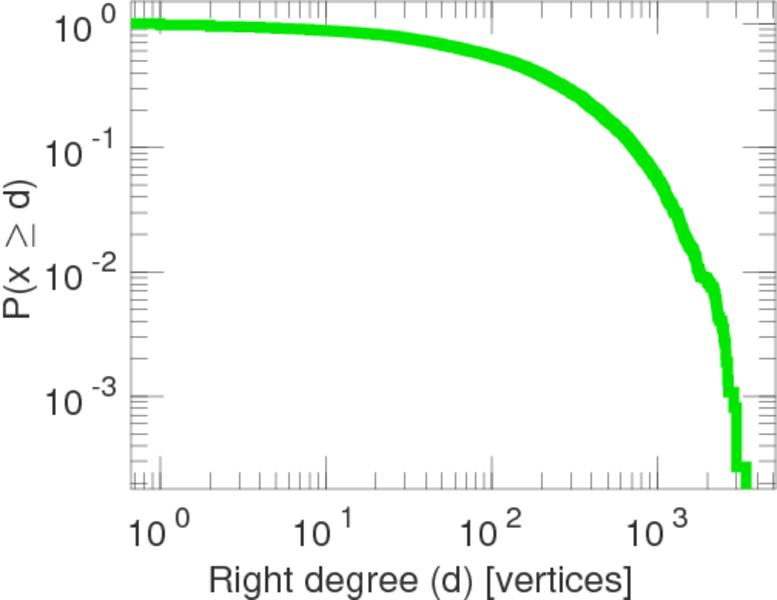
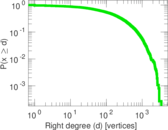
| Maximum right degree | d2max = | 3,428
|
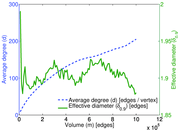
| Average degree | d = | 205.255
|
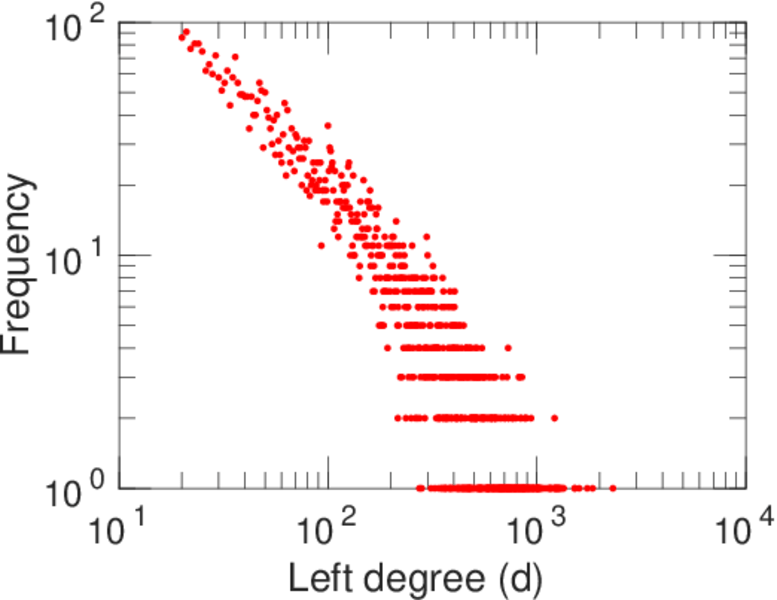
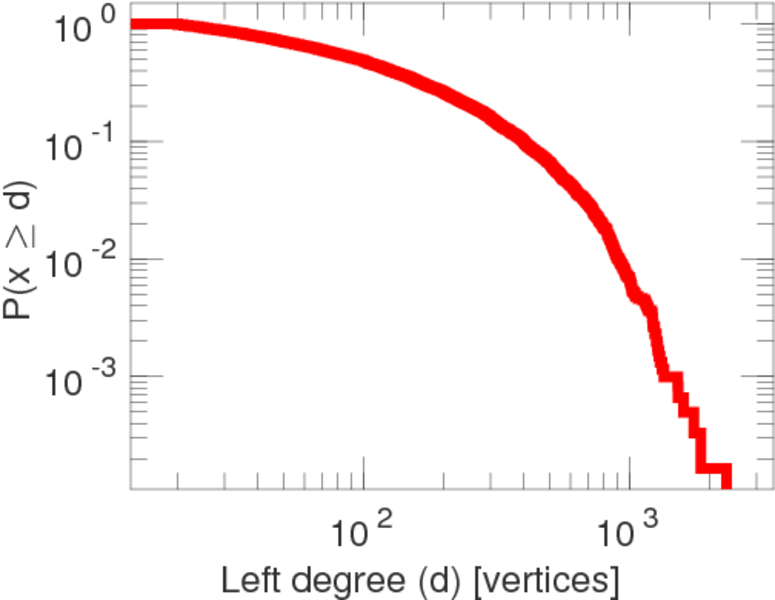
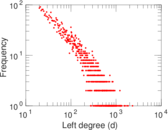
| Average left degree | d1 = | 165.598
|
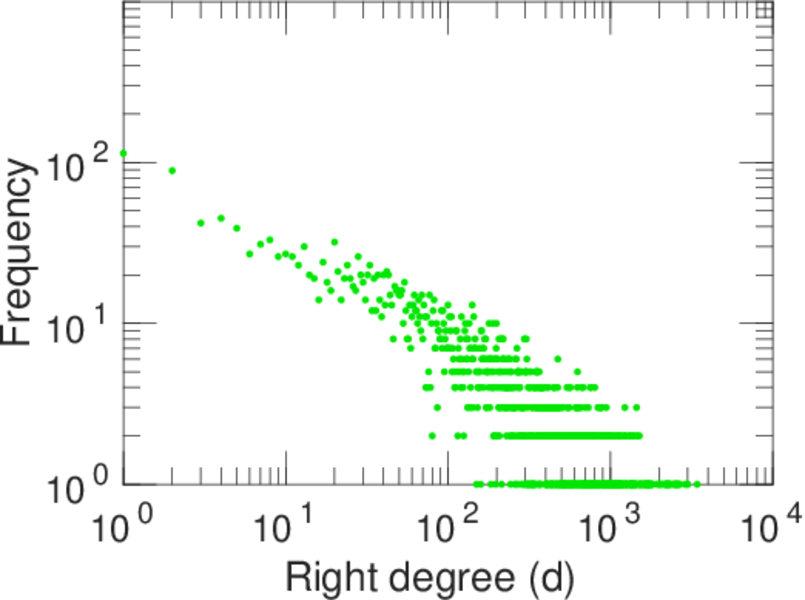
| Average right degree | d2 = | 269.889
|
| Fill | p = | 0.044 683 6
|
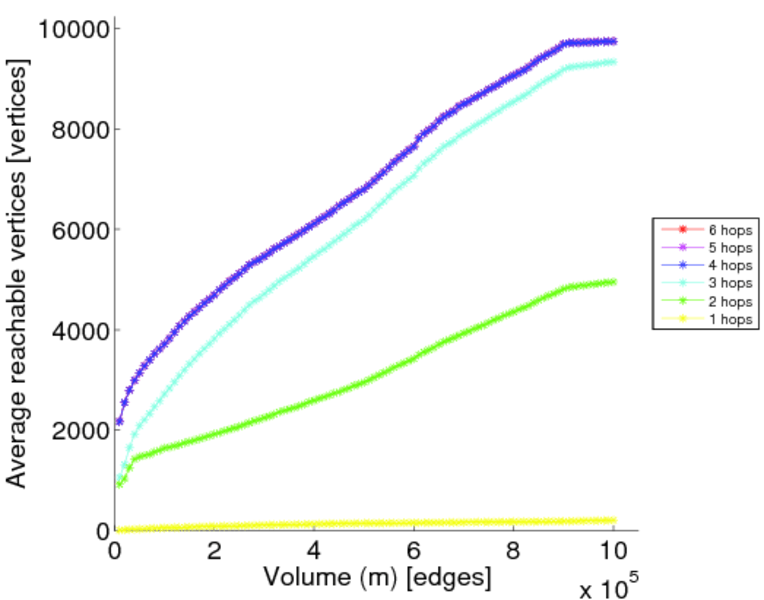
| Size of LCC | N = | 9,746
|
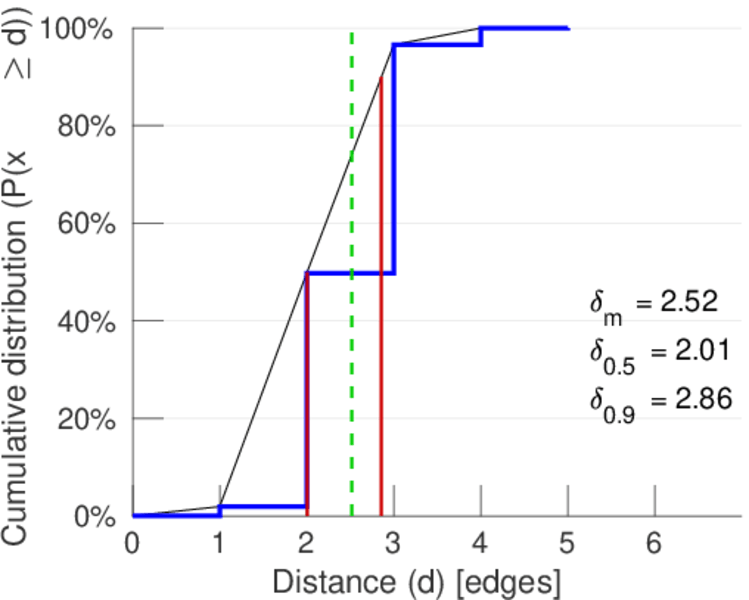
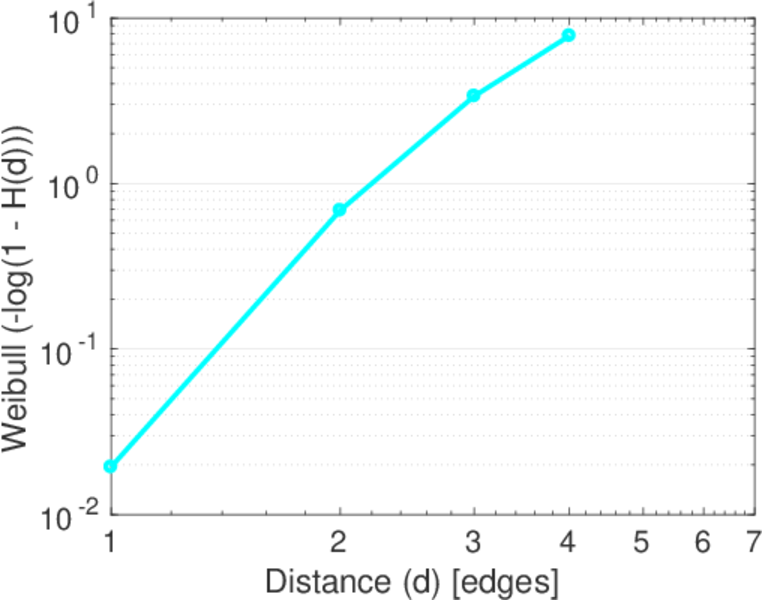
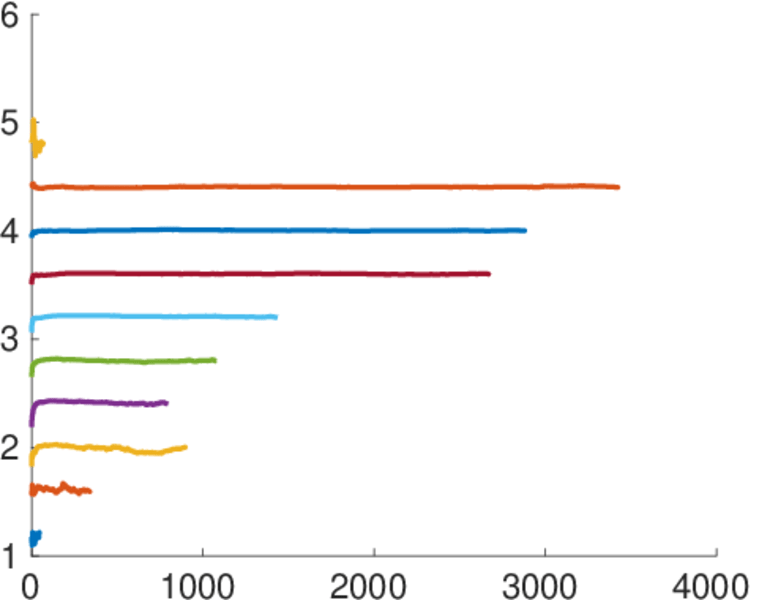
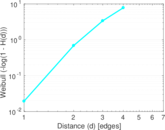
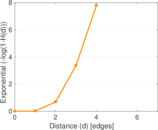
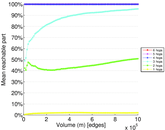
| Diameter | δ = | 6
|
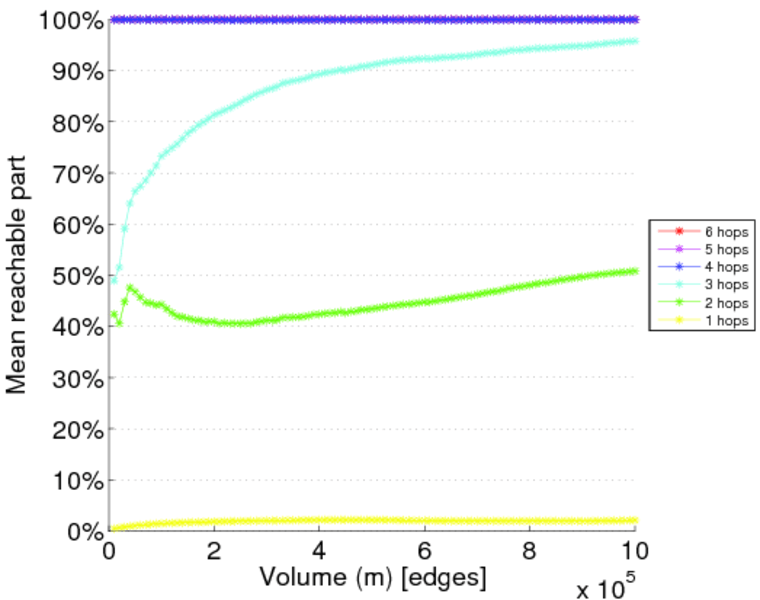
| 50-Percentile effective diameter | δ0.5 = | 2.005 85
|
| 90-Percentile effective diameter | δ0.9 = | 2.859 70
|
| Median distance | δM = | 3
|
| Mean distance | δm = | 2.518 18
|
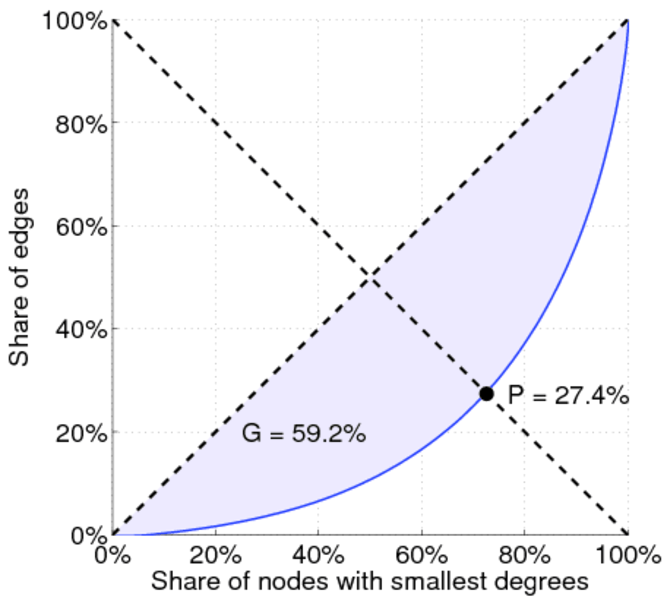
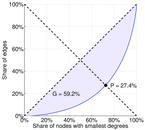
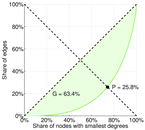
| Gini coefficient | G = | 0.533 280
|
| Balanced inequality ratio | P = | 0.297 482
|
| Left balanced inequality ratio | P1 = | 0.296 410
|
| Right balanced inequality ratio | P2 = | 0.257 754
|
| Relative edge distribution entropy | Her = | 0.931 081
|
| Power law exponent | γ = | 1.218 68
|
| Tail power law exponent | γt = | 1.791 00
|
| Tail power law exponent with p | γ3 = | 1.791 00
|
| p-value | p = | 0.000 00
|
| Left tail power law exponent with p | γ3,1 = | 1.911 00
|
| Left p-value | p1 = | 0.000 00
|
| Right tail power law exponent with p | γ3,2 = | 1.651 00
|
| Right p-value | p2 = | 0.000 00
|
| Degree assortativity | ρ = | −0.205 437
|
| Degree assortativity p-value | pρ = | 0.000 00
|
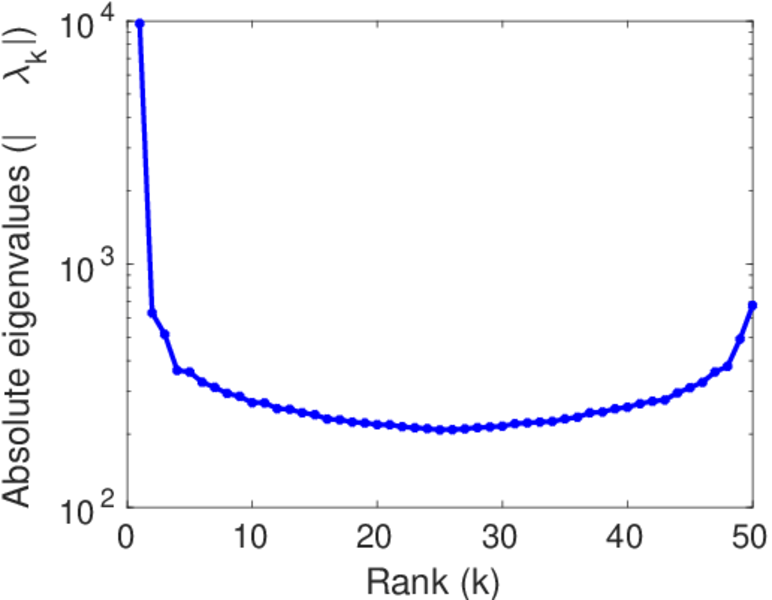
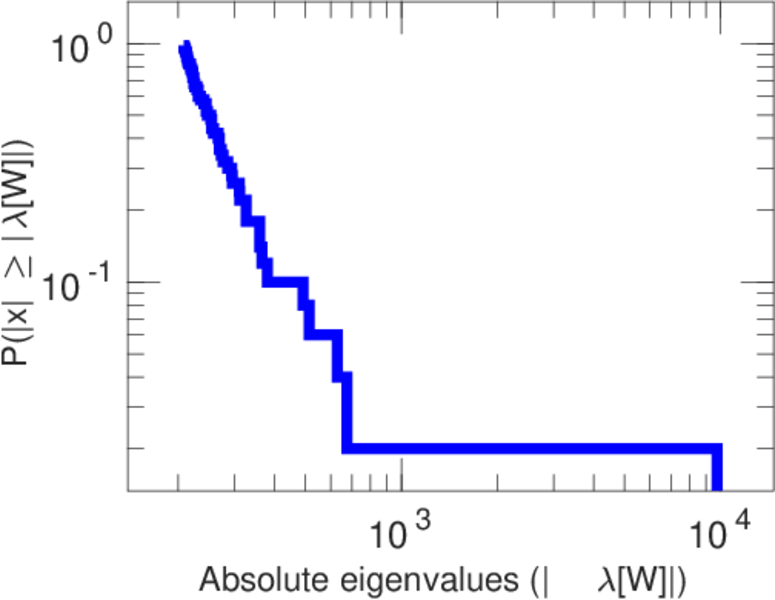
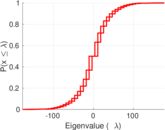
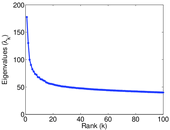
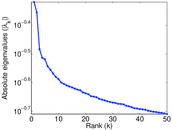
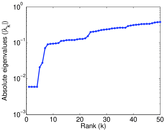
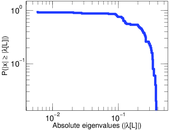
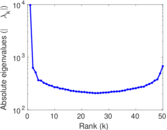
| Spectral norm | α = | 177.579
|
| Algebraic connectivity | a = | 0.005 940 63
|
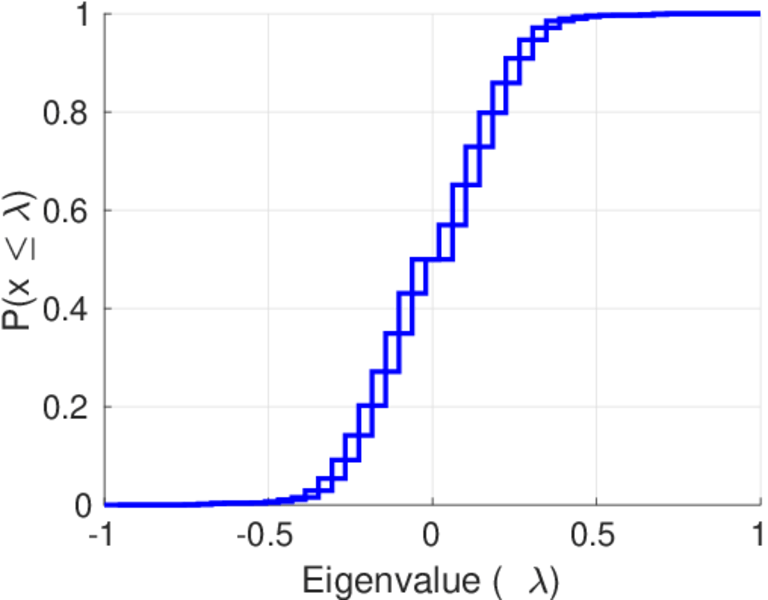
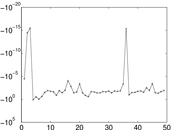
| Spectral separation | |λ1[A] / λ2[A]| = | 1.362 99
|
| Negativity | ζ = | 0.434 627
|
| Controllability | C = | 2,428
|
| Relative controllability | Cr = | 0.249 128
|
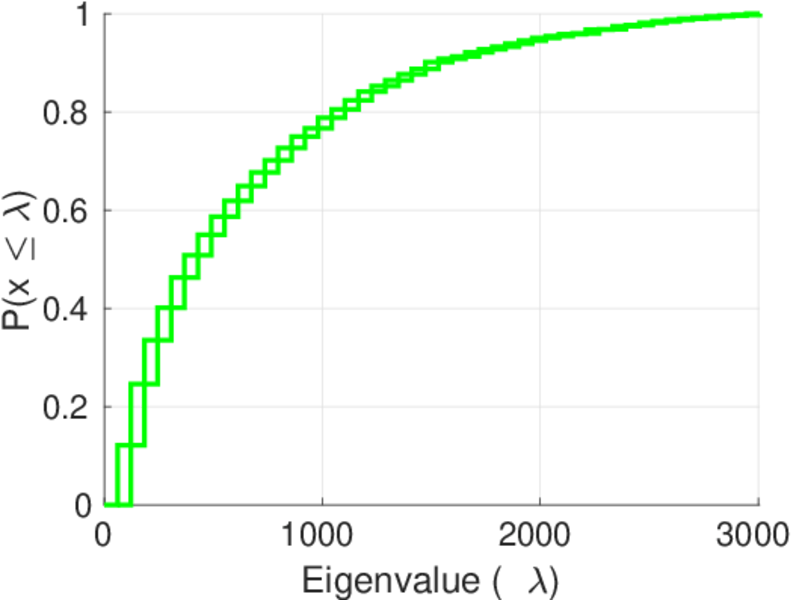
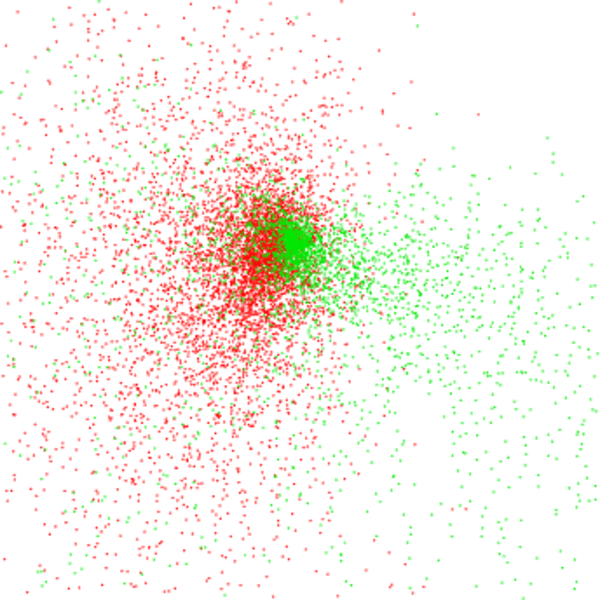
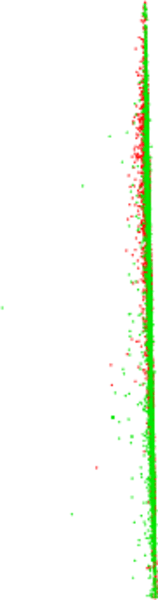
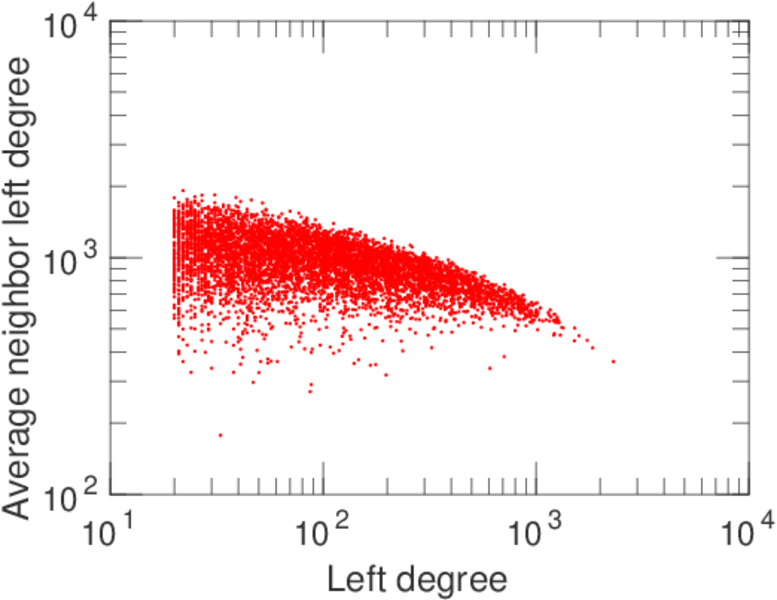
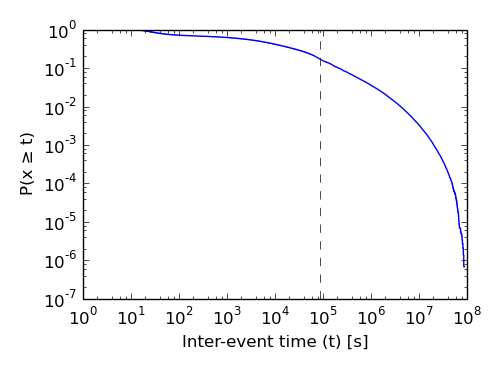
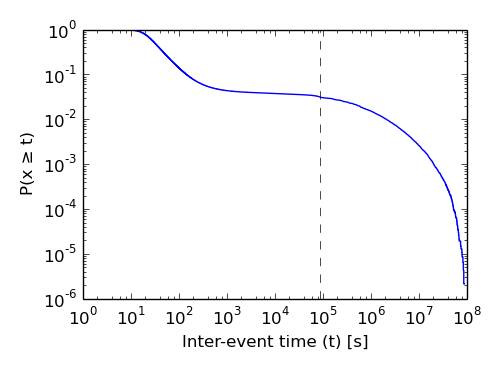
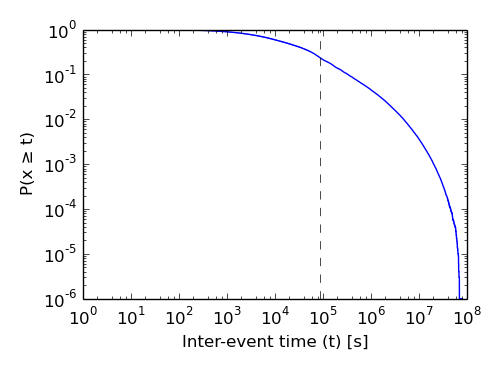
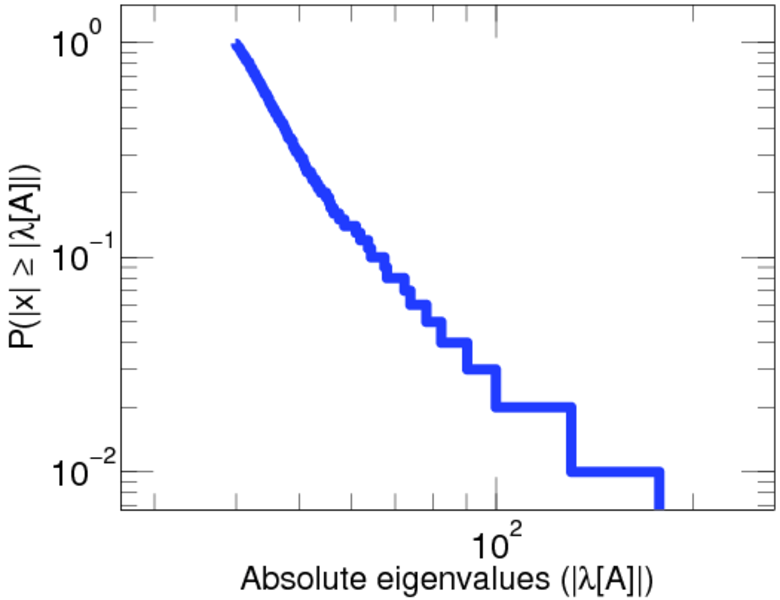
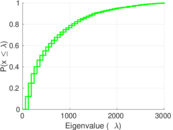
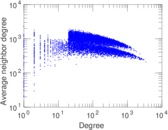
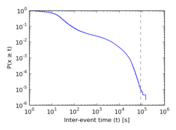
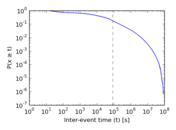
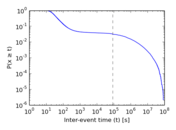
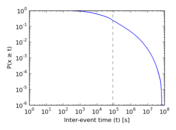
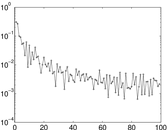
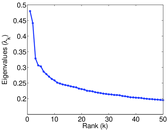
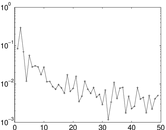
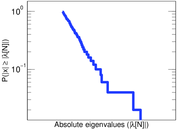
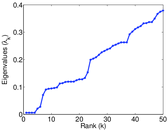
Plots


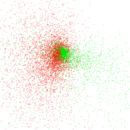


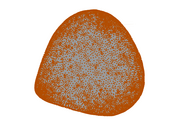
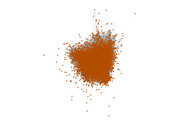
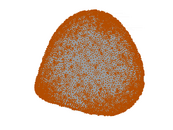
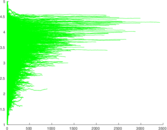


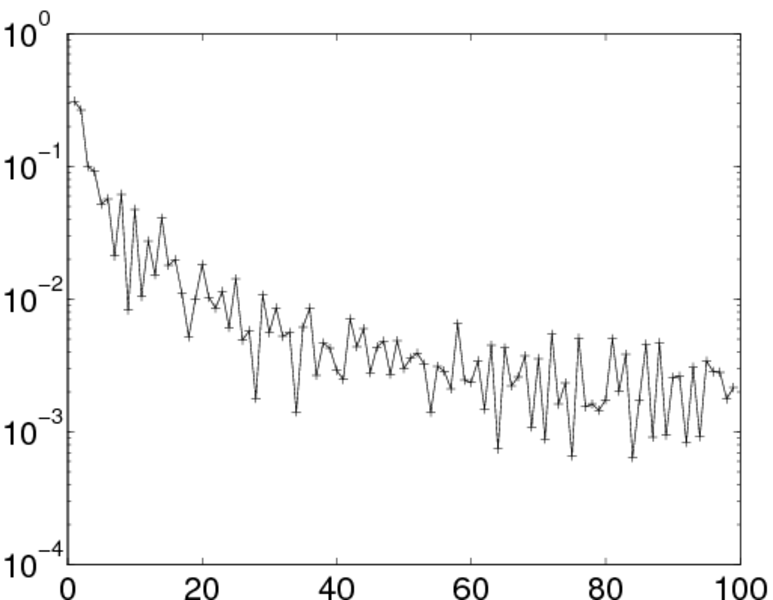
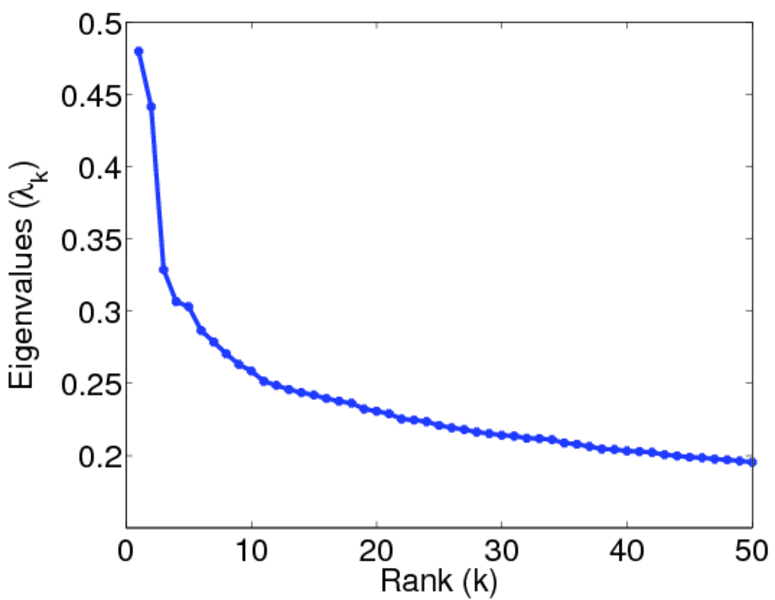
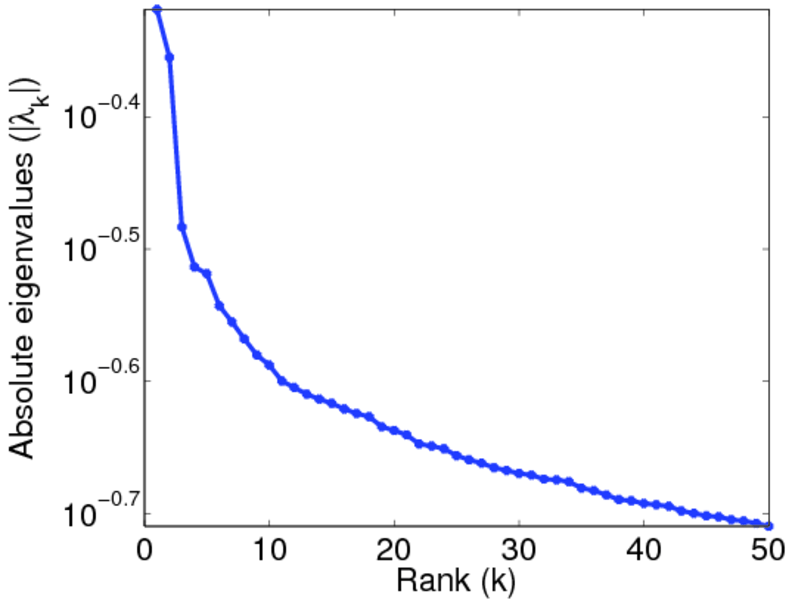
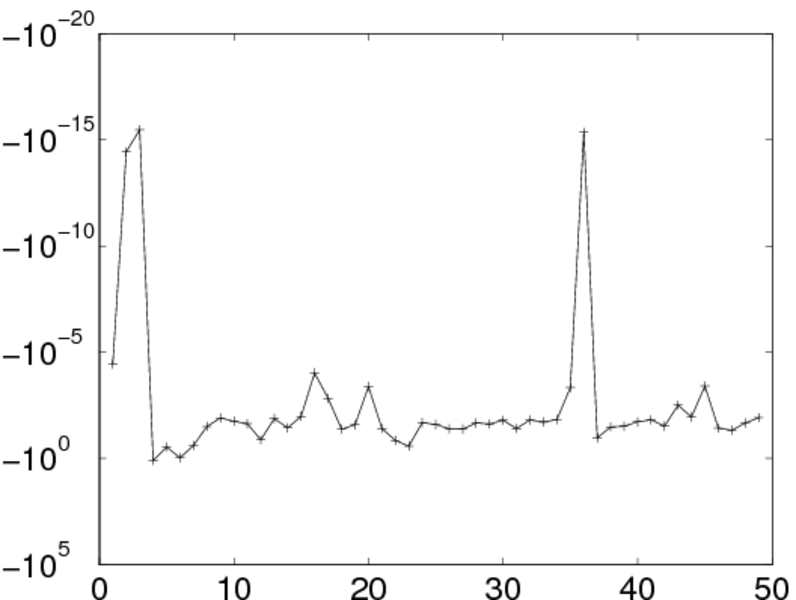
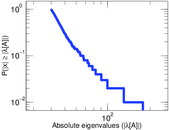
Matrix decompositions plots


Downloads
References
|
[1]
|
Jérôme Kunegis.
KONECT – The Koblenz Network Collection.
In Proc. Int. Conf. on World Wide Web Companion, pages
1343–1350, 2013.
[ http ]
|
|
[2]
|
GroupLens Research.
MovieLens data sets.
http://www.grouplens.org/node/73, October 2006.
|
 KONECT ‣ Networks ‣
Buy Me a Coffee
KONECT ‣ Networks ‣
Buy Me a Coffee