Twitter user–item
This is the bipartite network consisting of Twitter users and the URLs they
mentioned in their postings. Left nodes represent users and right nodes
represent URLs. An edge shows that an URL was mentioned by a user in a tweet.
Metadata
Statistics
| Size | n = | 9,374,206
|
| Left size | n1 = | 244,537
|
| Right size | n2 = | 9,129,669
|
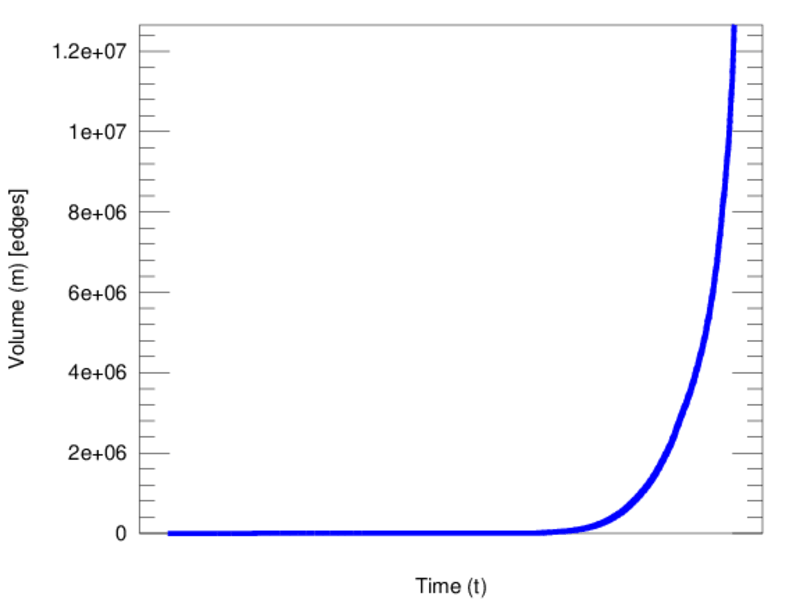
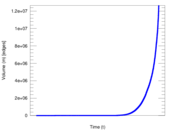
| Volume | m = | 12,656,613
|
| Unique edge count | m̿ = | 10,214,177
|
| Wedge count | s = | 708,995,210
|
| Claw count | z = | 1,155,590,474,676
|
| Cross count | x = | 5,291,997,635,686,715
|
| Square count | q = | 53,711,135
|
| 4-Tour count | T4 = | 3,286,104,890
|
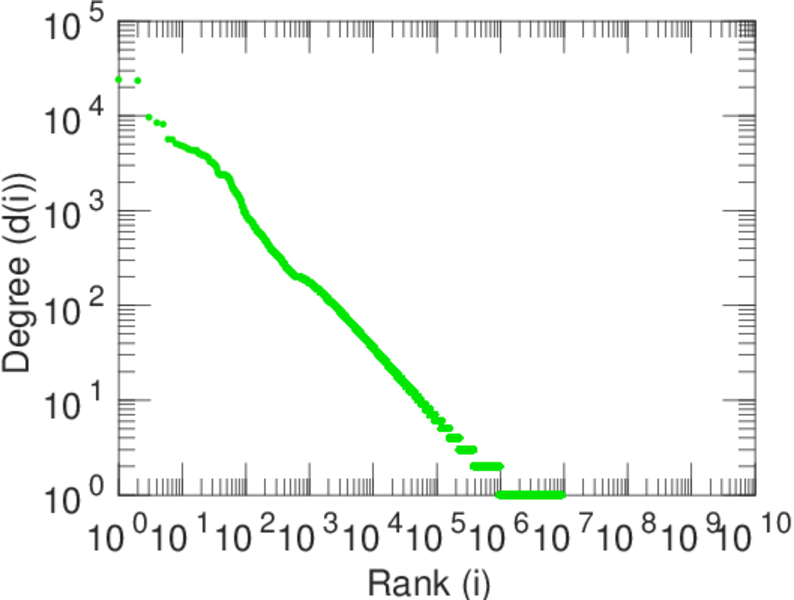
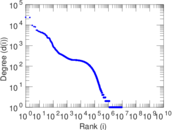
| Maximum degree | dmax = | 24,106
|
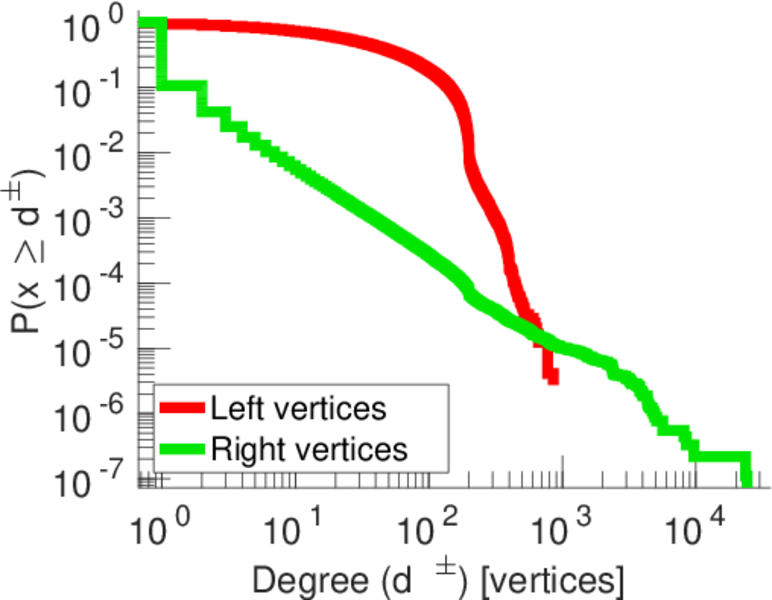
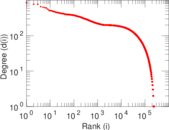
| Maximum left degree | d1max = | 855
|
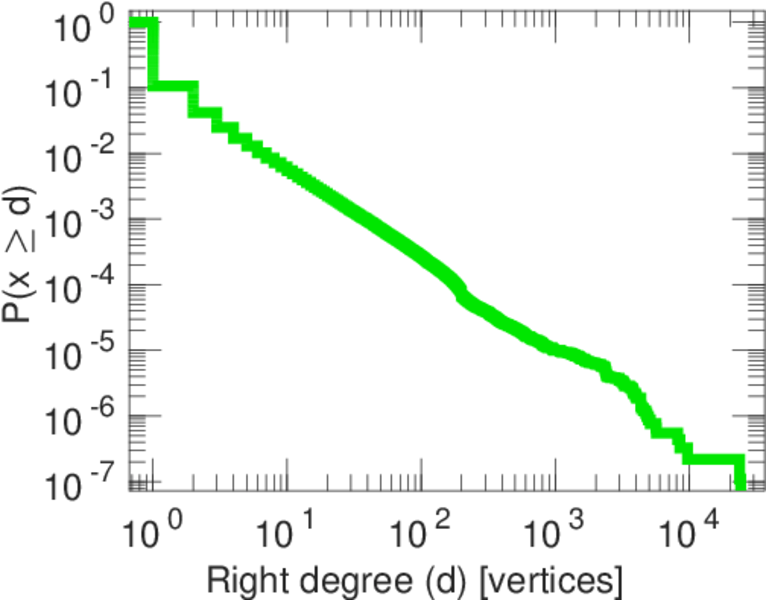
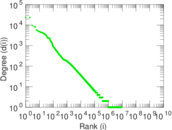
| Maximum right degree | d2max = | 24,106
|
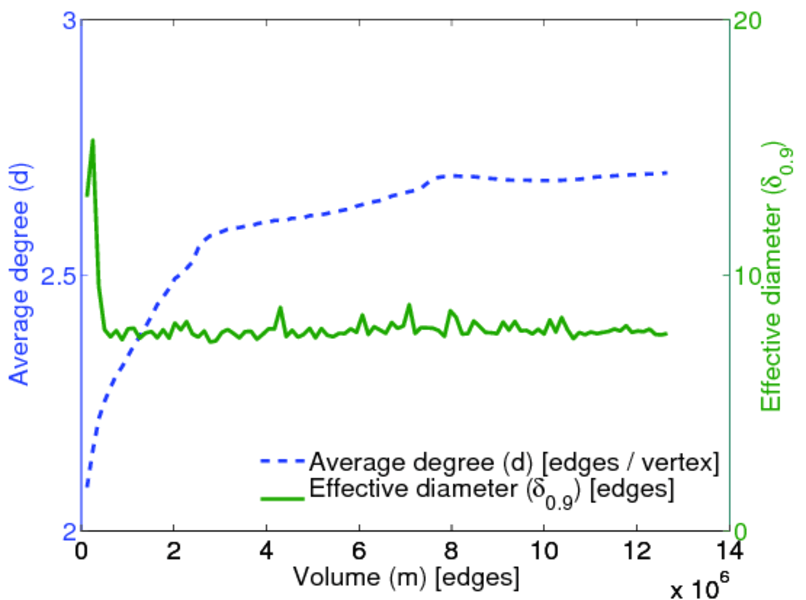
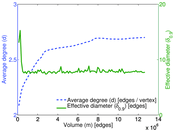
| Average degree | d = | 2.700 31
|
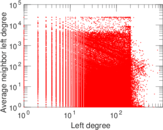
| Average left degree | d1 = | 51.757 5
|
| Average right degree | d2 = | 1.386 32
|
| Fill | p = | 4.575 13 × 10−6
|
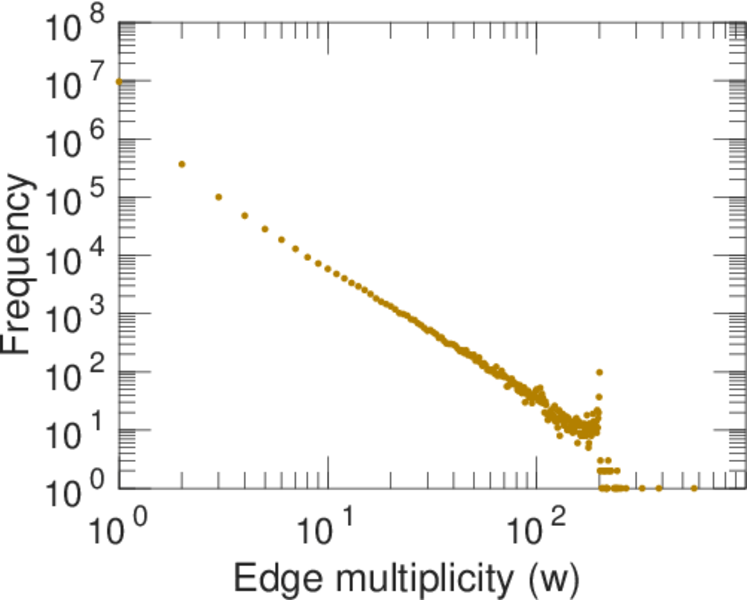
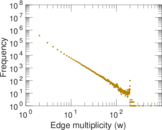
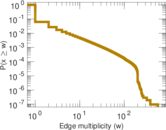
| Average edge multiplicity | m̃ = | 1.239 12
|
| Size of LCC | N = | 7,488,524
|
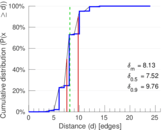
| Diameter | δ = | 30
|
| 50-Percentile effective diameter | δ0.5 = | 7.524 28
|
| 90-Percentile effective diameter | δ0.9 = | 9.761 17
|
| Median distance | δM = | 8
|
| Mean distance | δm = | 8.134 08
|
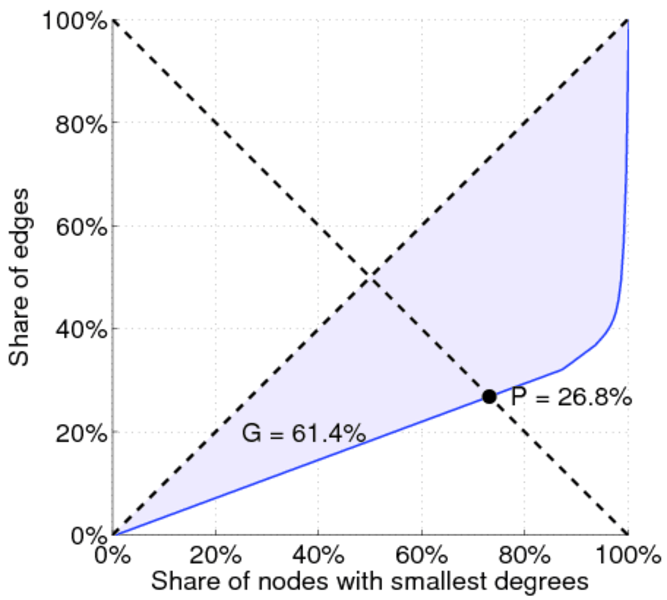
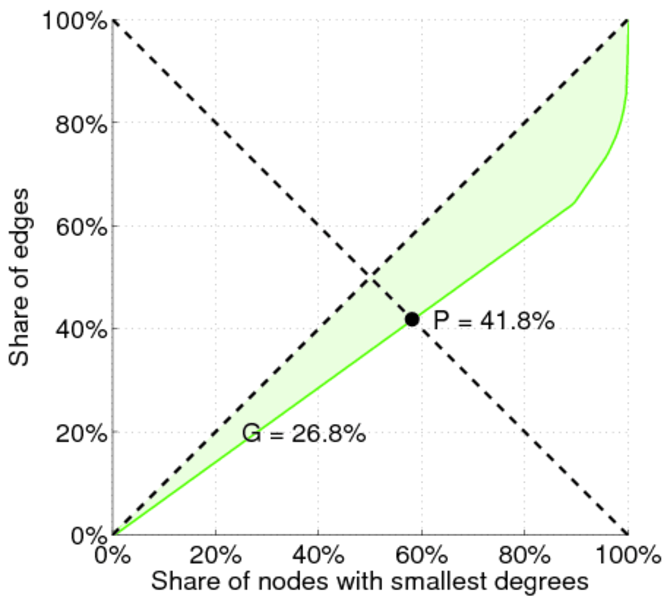
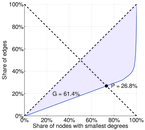
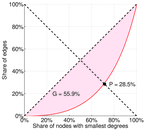
| Gini coefficient | G = | 0.623 814
|
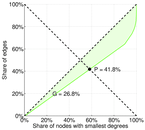
| Balanced inequality ratio | P = | 0.263 288
|
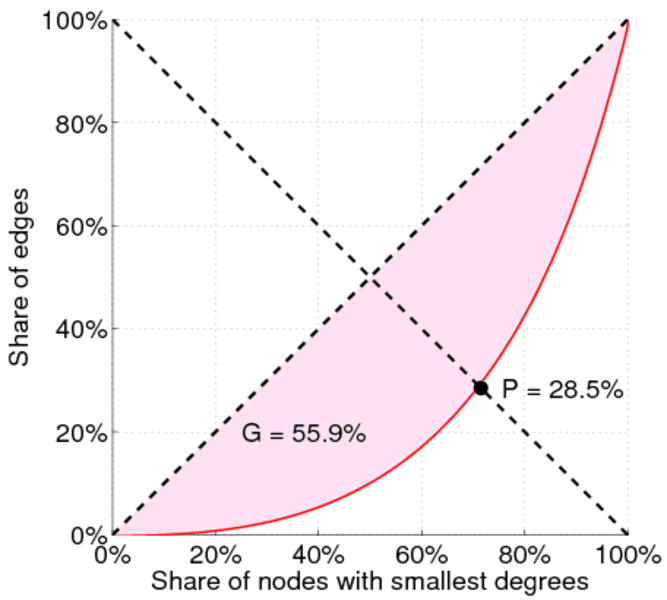
| Left balanced inequality ratio | P1 = | 0.285 079
|
| Right balanced inequality ratio | P2 = | 0.418 375
|
| Relative edge distribution entropy | Her = | 0.906 108
|
| Power law exponent | γ = | 8.945 62
|
| Tail power law exponent | γt = | 3.261 00
|
| Degree assortativity | ρ = | −0.042 714 3
|
| Degree assortativity p-value | pρ = | 0.000 00
|
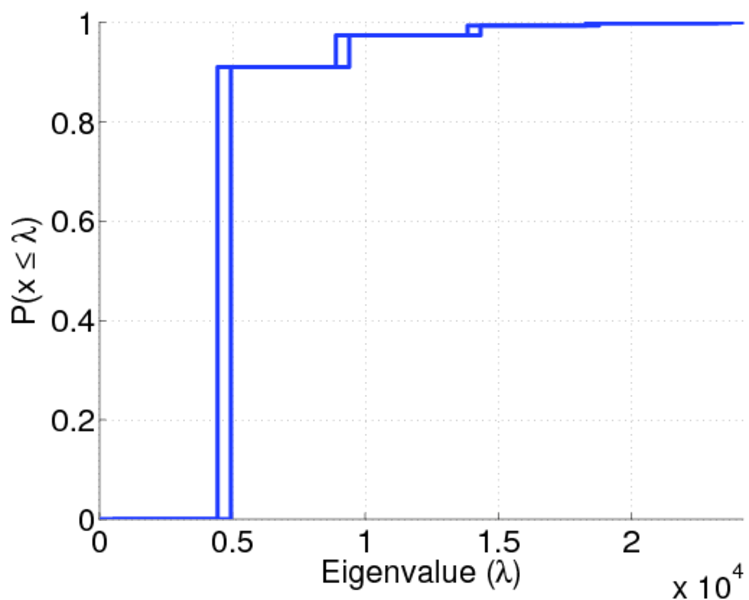
| Spectral norm | α = | 1,713.76
|
| Spectral separation | |λ1[A] / λ2[A]| = | 1.750 05
|
| Controllability | C = | 8,893,258
|
| Relative controllability | Cr = | 0.948 695
|
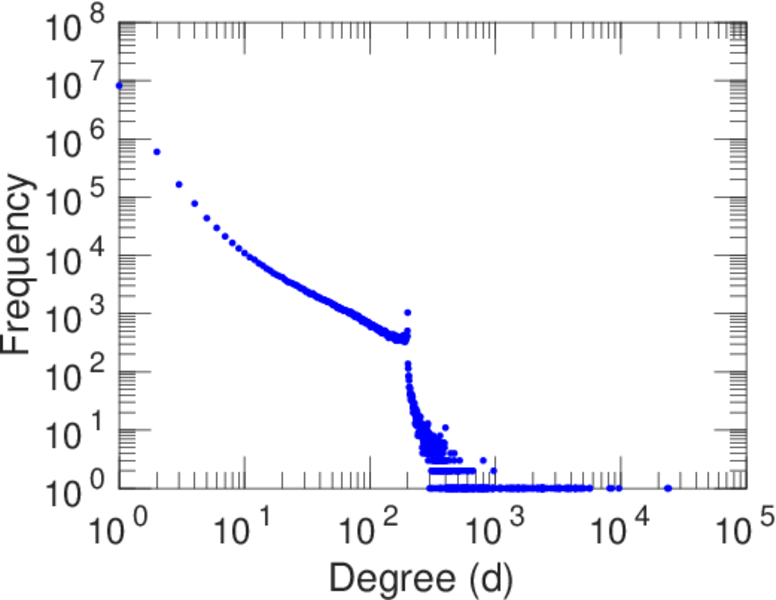
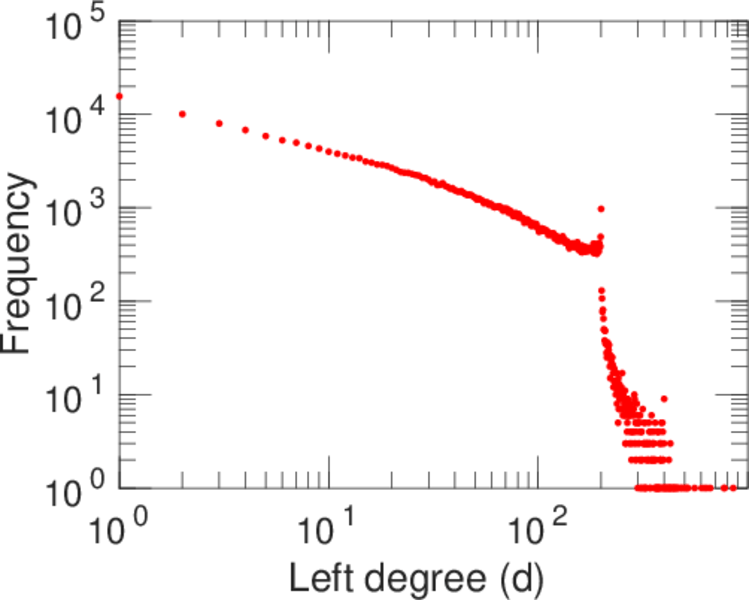
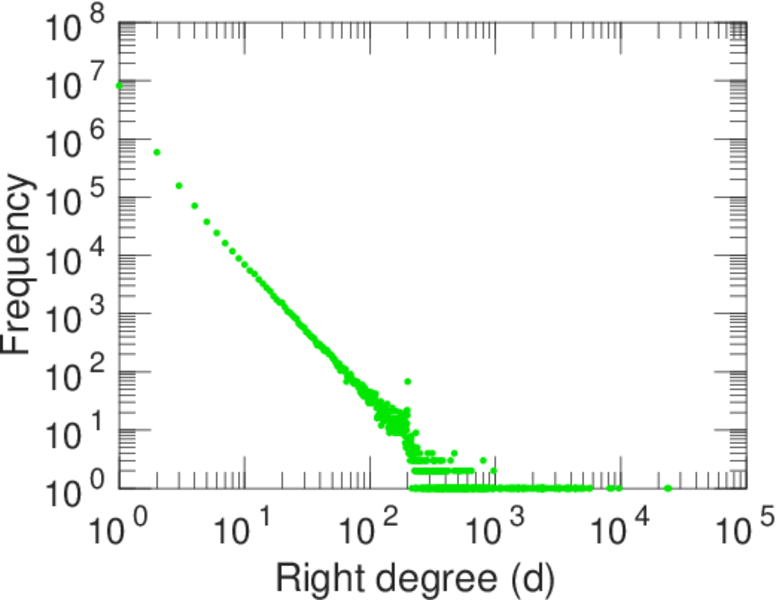
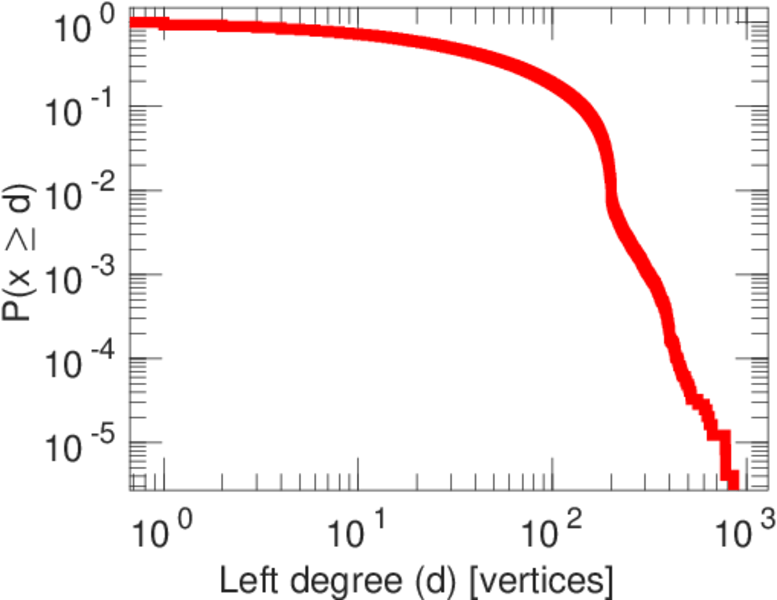
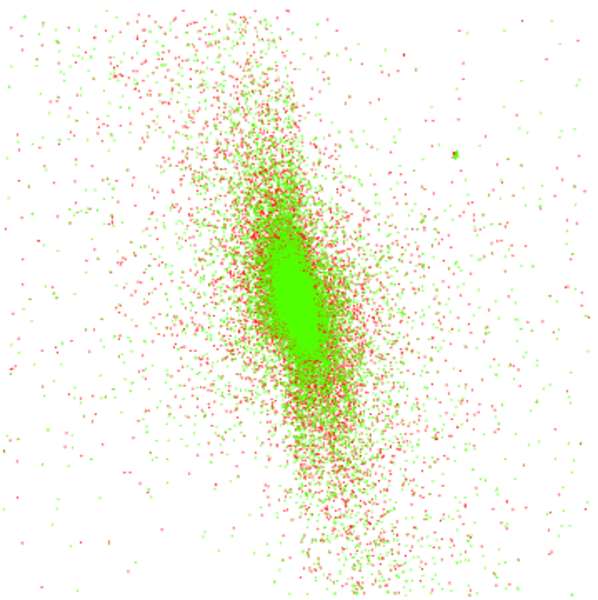
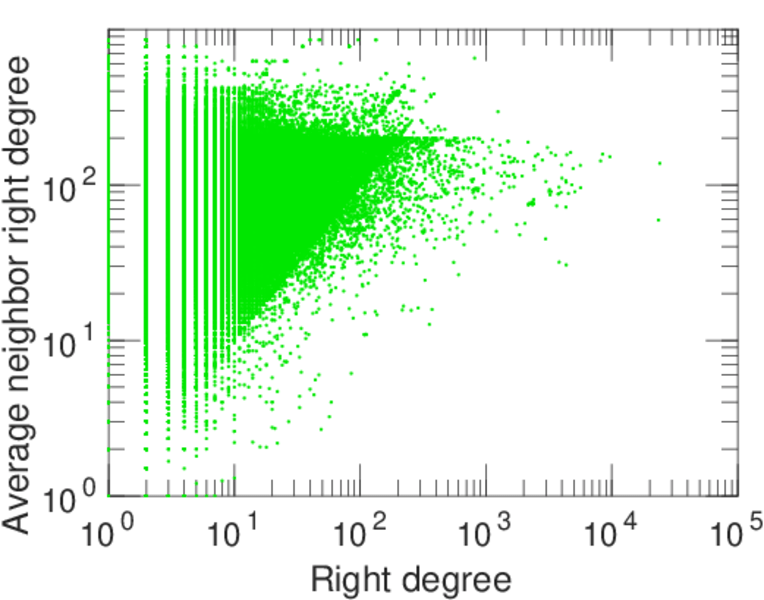
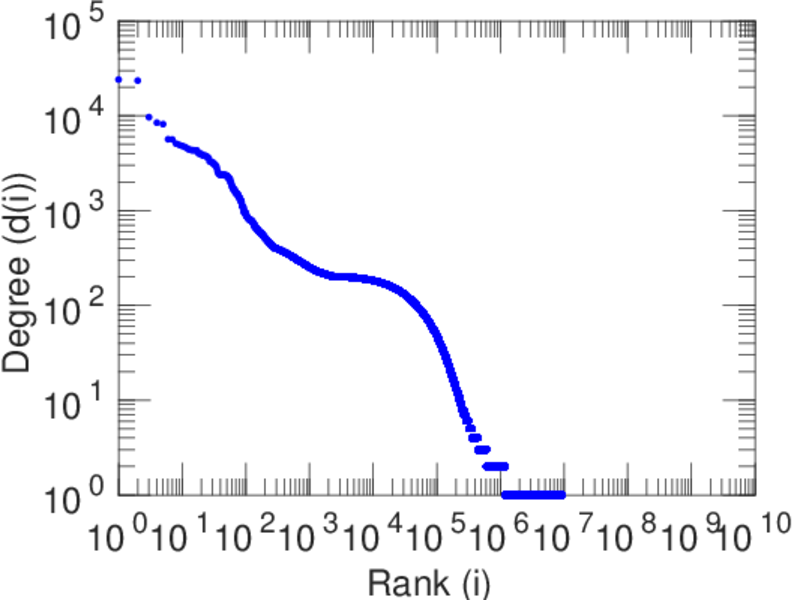
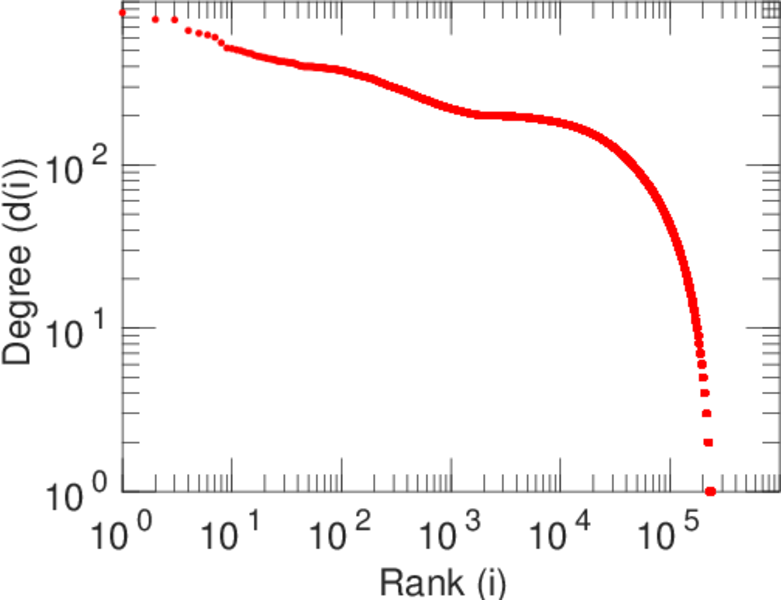
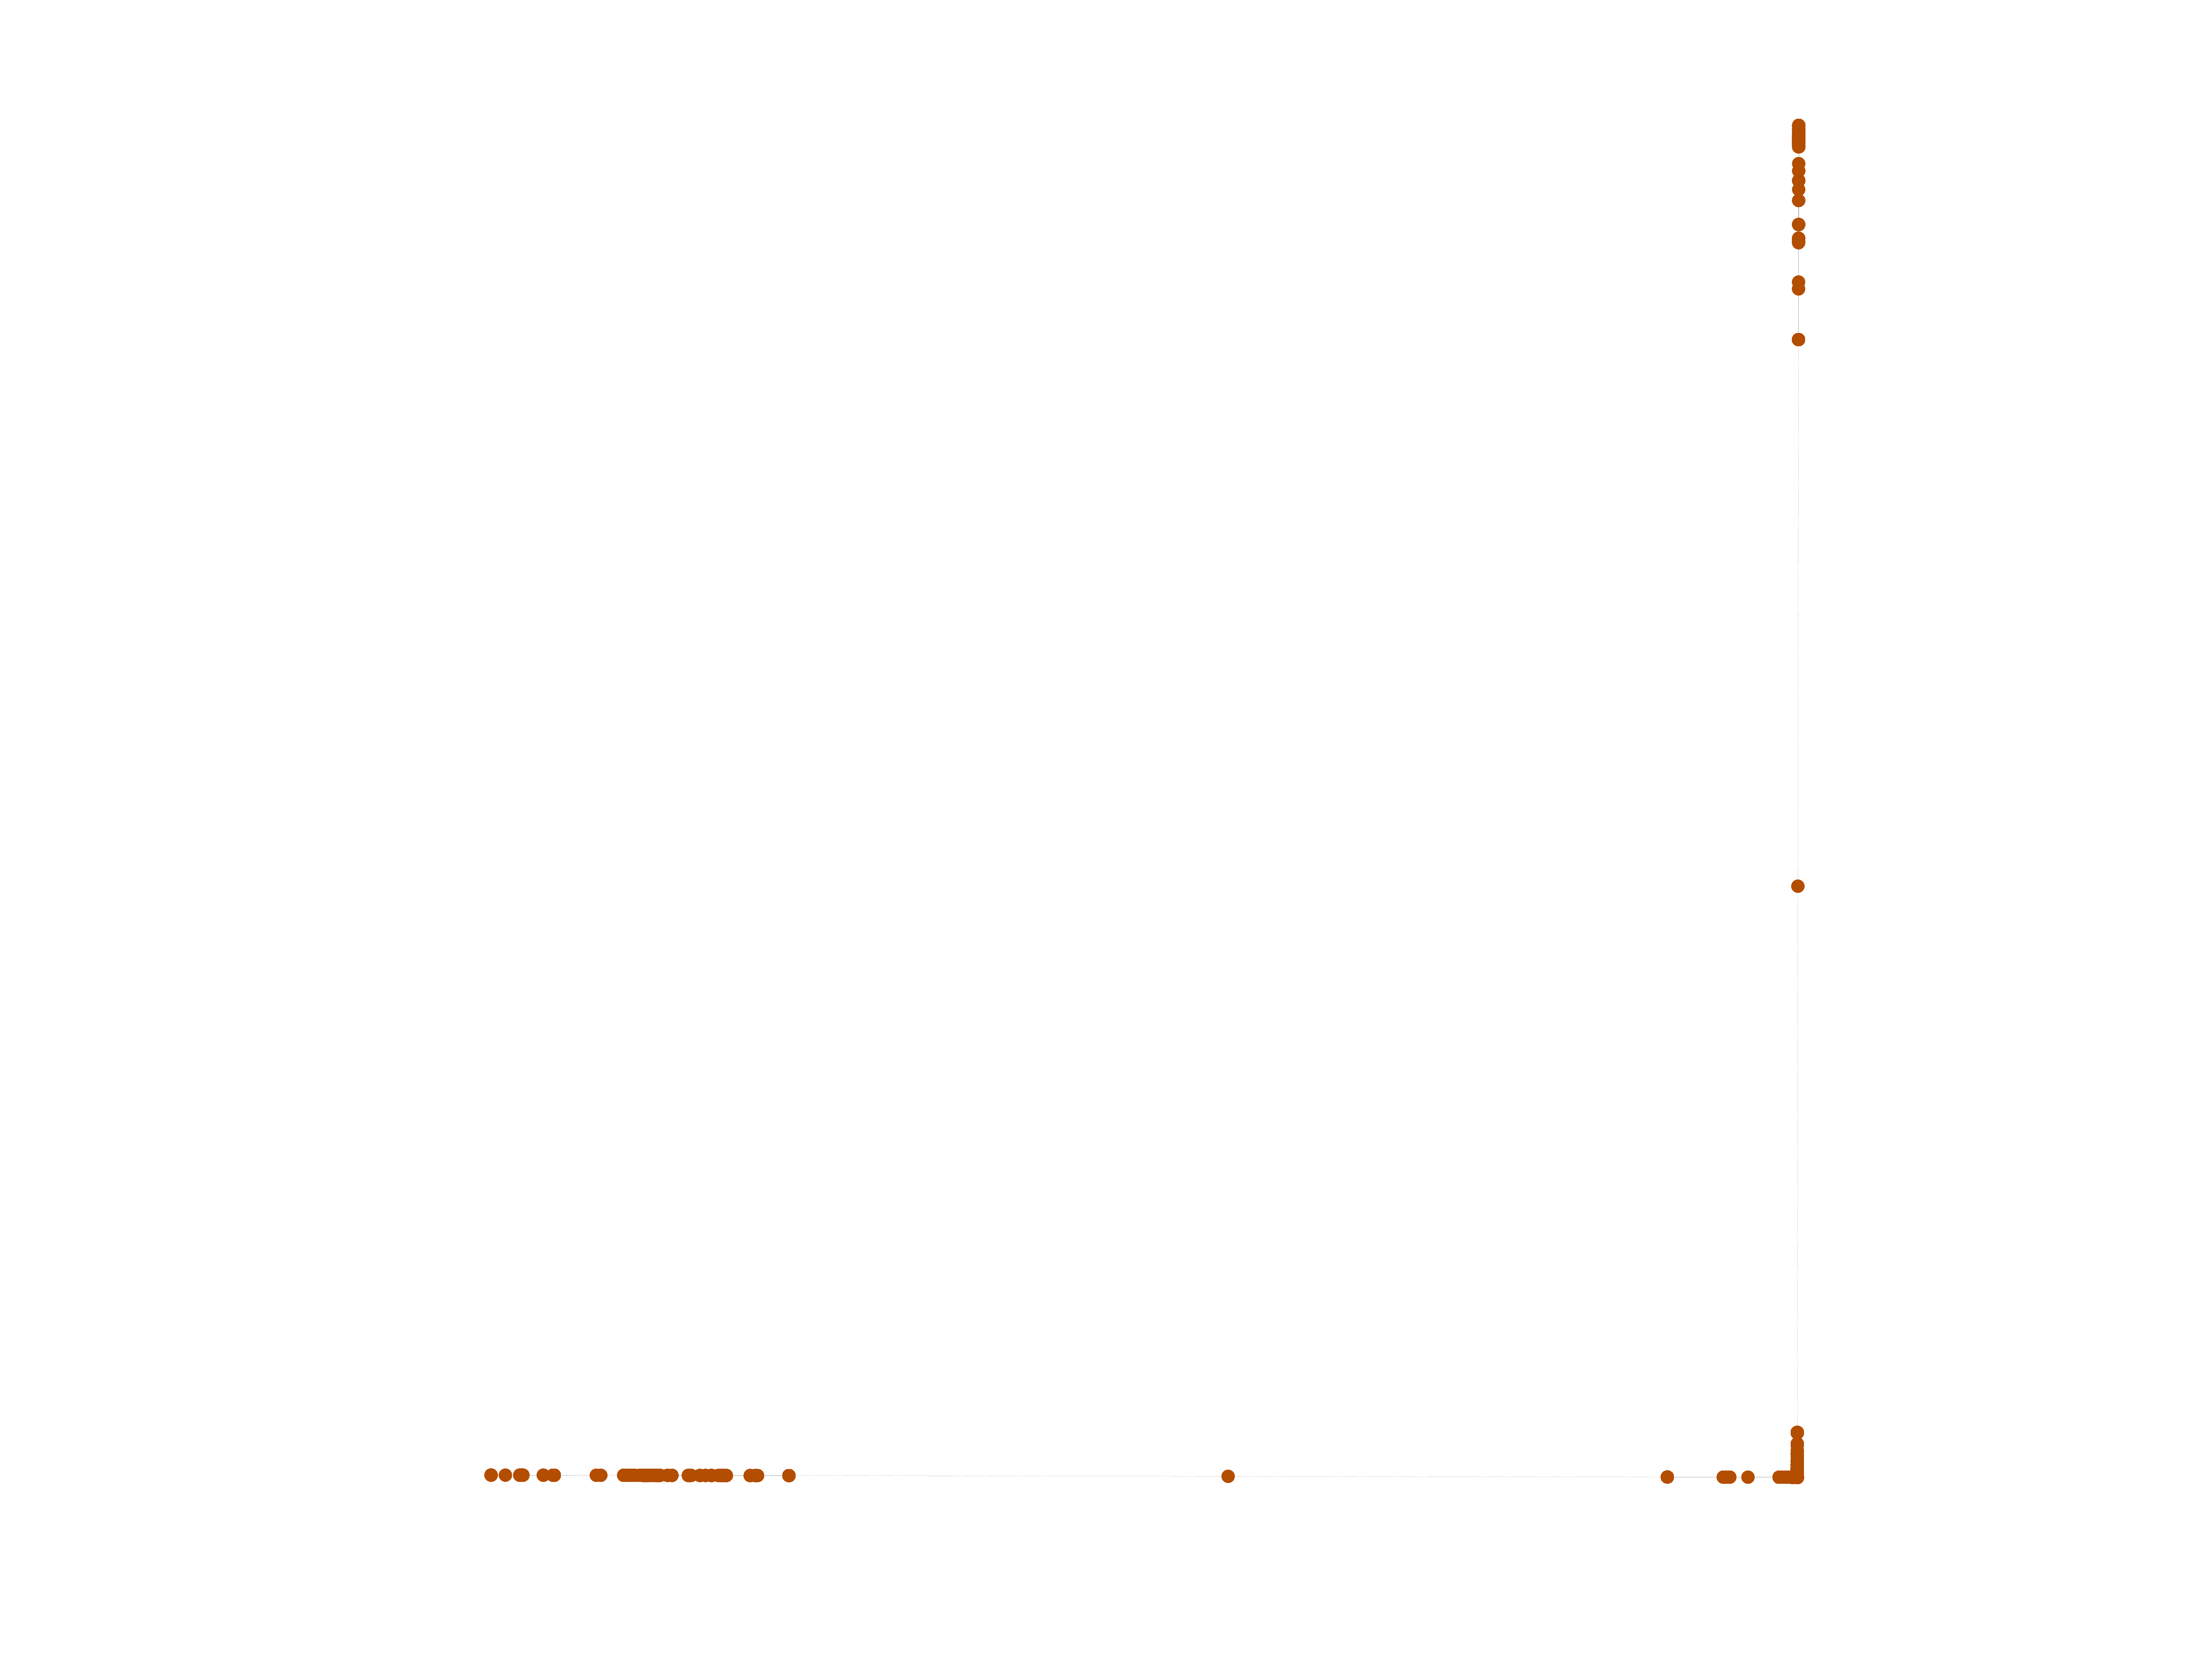
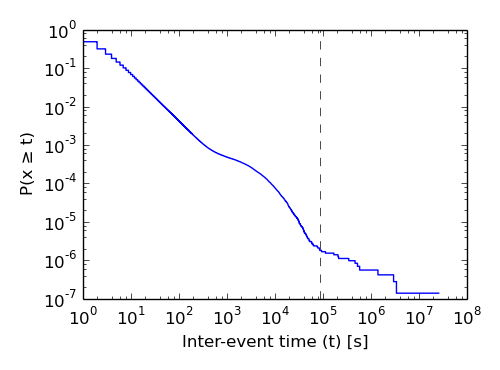
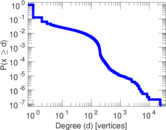
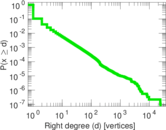
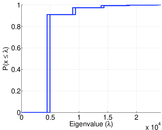
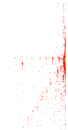
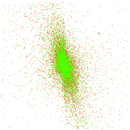
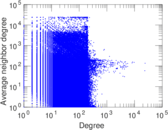
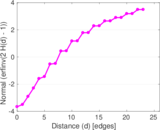
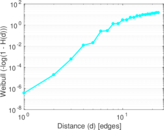
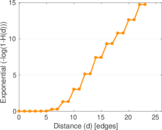
Plots


Downloads
References
|
[1]
|
Jérôme Kunegis.
KONECT – The Koblenz Network Collection.
In Proc. Int. Conf. on World Wide Web Companion, pages
1343–1350, 2013.
[ http ]
|
|
[2]
|
Munmun De Choudhury, Yu-Ru Lin, Hari Sundaram, K. Selçuk Candan, Lexing Xie,
and Aisling Kelliher.
How does the data sampling strategy impact the discovery of
information diffusion in social media?
In ICWSM, pages 34–41, 2010.
|
 KONECT ‣ Networks ‣
Buy Me a Coffee
KONECT ‣ Networks ‣
Buy Me a Coffee