Twitter user–tag
This is a bipartite network consisting of Twitter users and tags they mentioned
in their postings. Left nodes represent users and right nodes represent tags.
An edge shows that a tag was used by a user in a tweet.
Metadata
Statistics
| Size | n = | 705,632
|
| Left size | n1 = | 175,214
|
| Right size | n2 = | 530,418
|
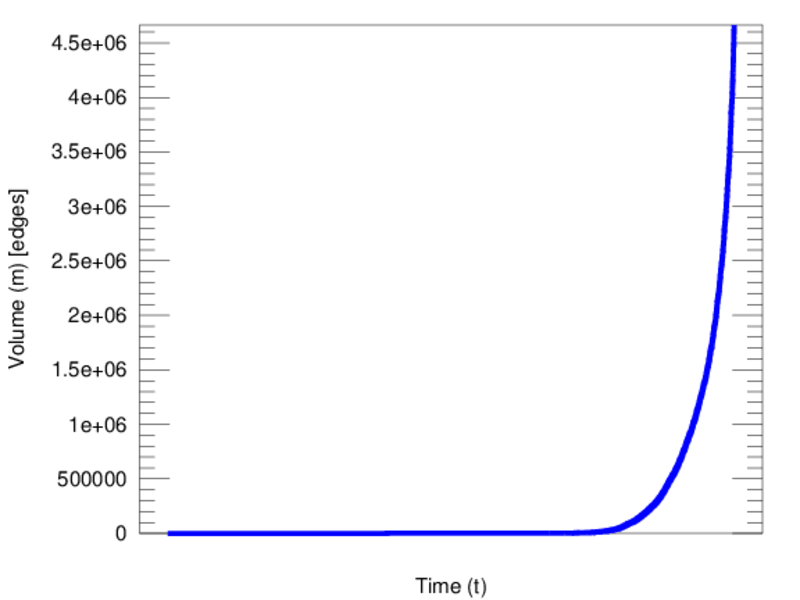
| Volume | m = | 4,664,605
|
| Unique edge count | m̿ = | 1,890,661
|
| Wedge count | s = | 1,006,768,611
|
| Claw count | z = | 3,620,991,361,242
|
| Cross count | x = | 14,011,028,889,674,202
|
| Square count | q = | 206,508,691
|
| 4-Tour count | T4 = | 5,682,999,878
|
| Maximum degree | dmax = | 90,362
|
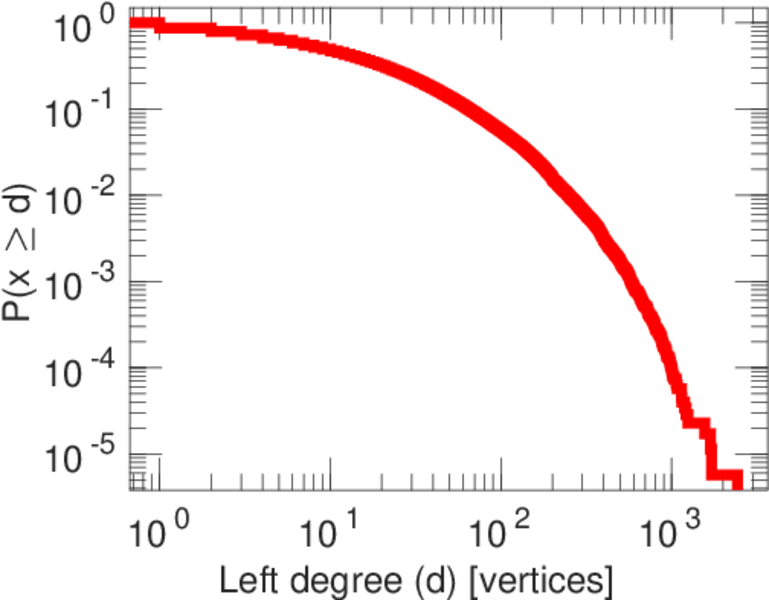
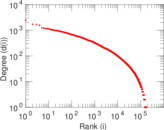
| Maximum left degree | d1max = | 2,431
|
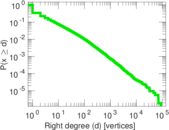
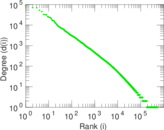
| Maximum right degree | d2max = | 90,362
|
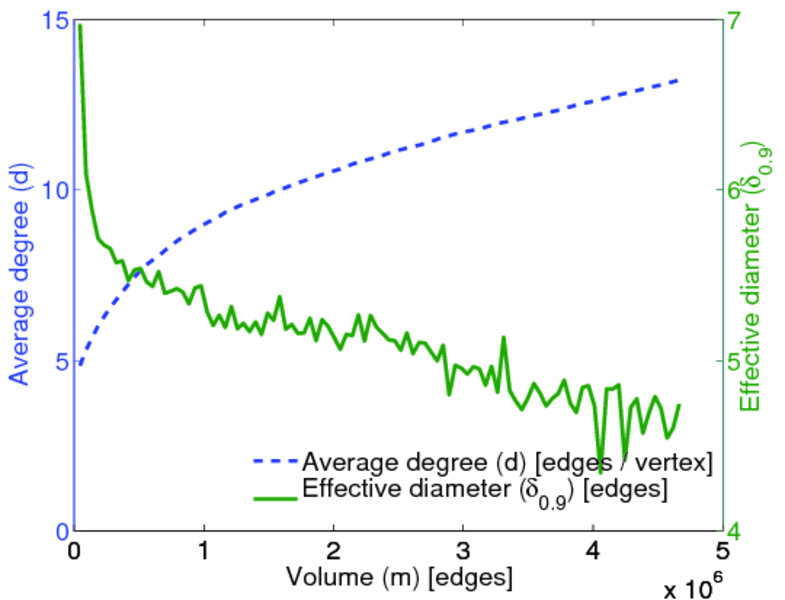
| Average degree | d = | 13.221 1
|
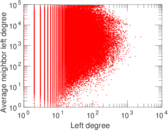
| Average left degree | d1 = | 26.622 3
|
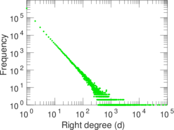
| Average right degree | d2 = | 8.794 21
|
| Fill | p = | 2.034 35 × 10−5
|
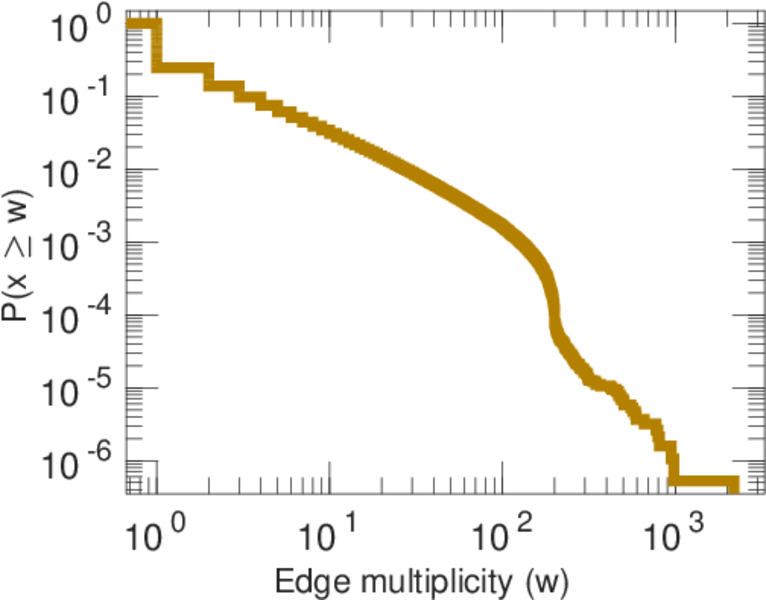
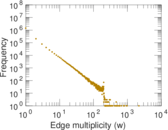
| Average edge multiplicity | m̃ = | 2.467 18
|
| Size of LCC | N = | 690,906
|
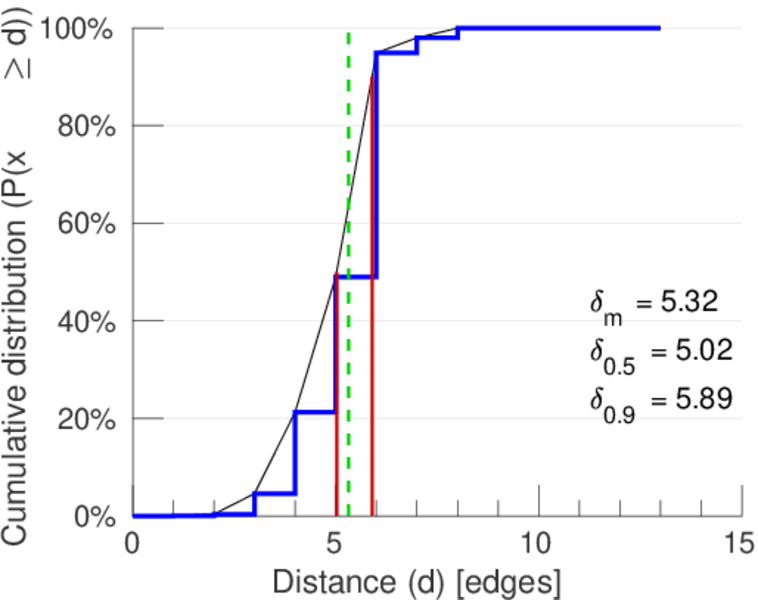
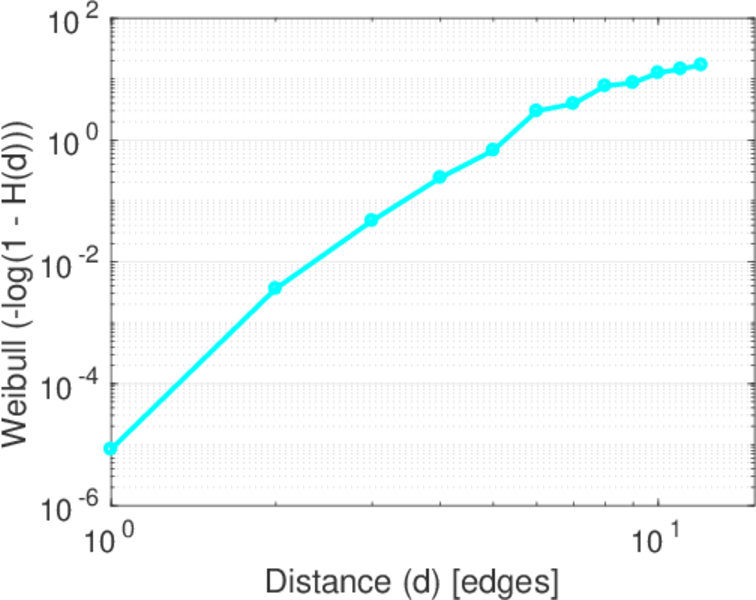
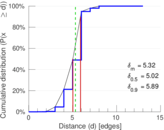
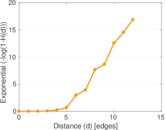
| Diameter | δ = | 16
|
| 50-Percentile effective diameter | δ0.5 = | 5.022 02
|
| 90-Percentile effective diameter | δ0.9 = | 5.893 74
|
| Median distance | δM = | 6
|
| Mean distance | δm = | 5.319 70
|
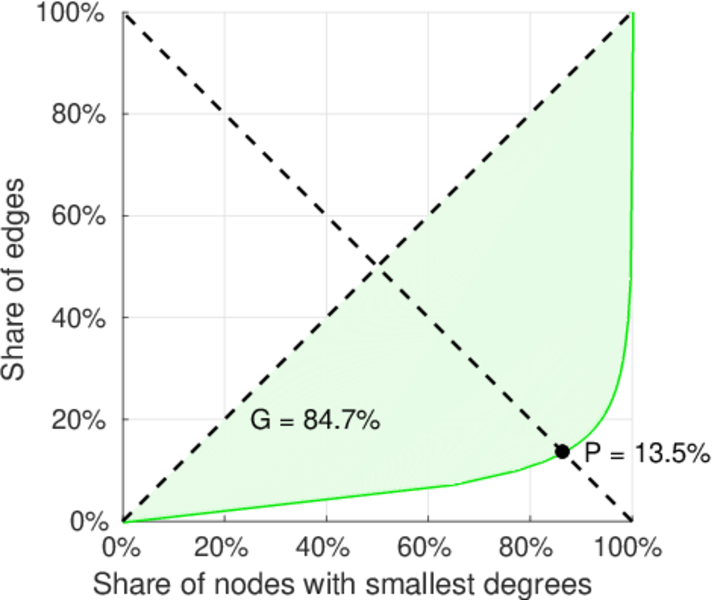
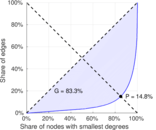
| Gini coefficient | G = | 0.842 861
|
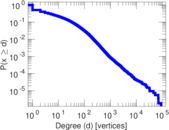
| Balanced inequality ratio | P = | 0.149 222
|
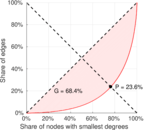
| Left balanced inequality ratio | P1 = | 0.236 392
|
| Right balanced inequality ratio | P2 = | 0.135 109
|
| Relative edge distribution entropy | Her = | 0.882 745
|
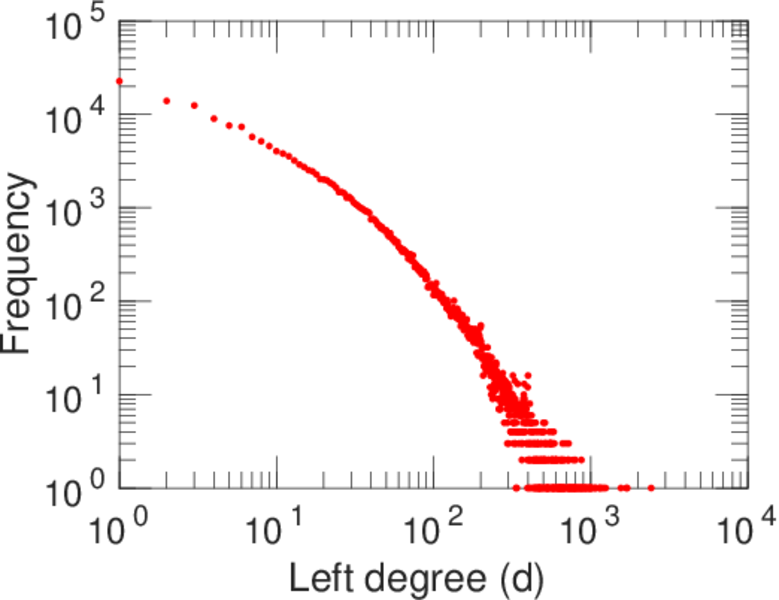
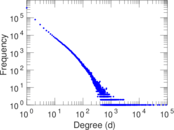
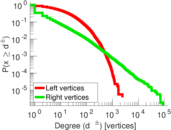
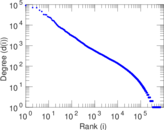
| Power law exponent | γ = | 2.460 48
|
| Tail power law exponent | γt = | 2.601 00
|
| Degree assortativity | ρ = | −0.098 655 9
|
| Degree assortativity p-value | pρ = | 0.000 00
|
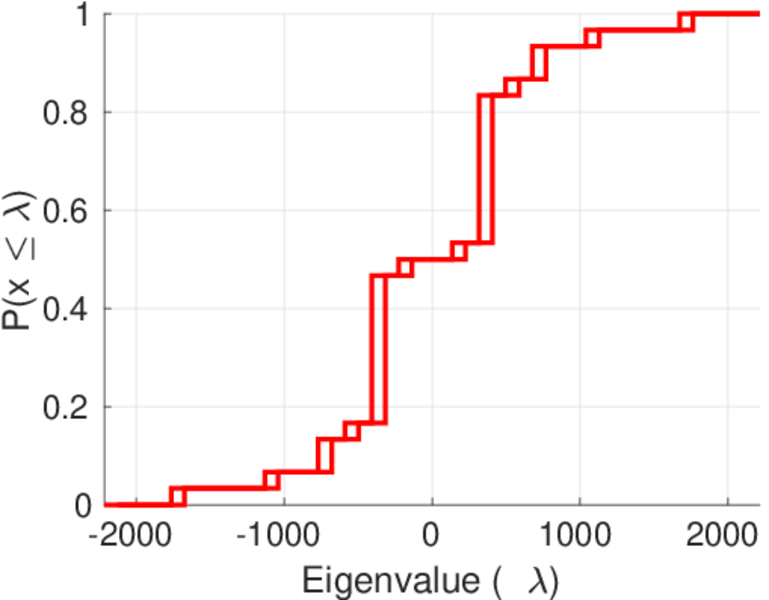
| Spectral norm | α = | 2,216.48
|
| Algebraic connectivity | a = | 0.003 077 89
|
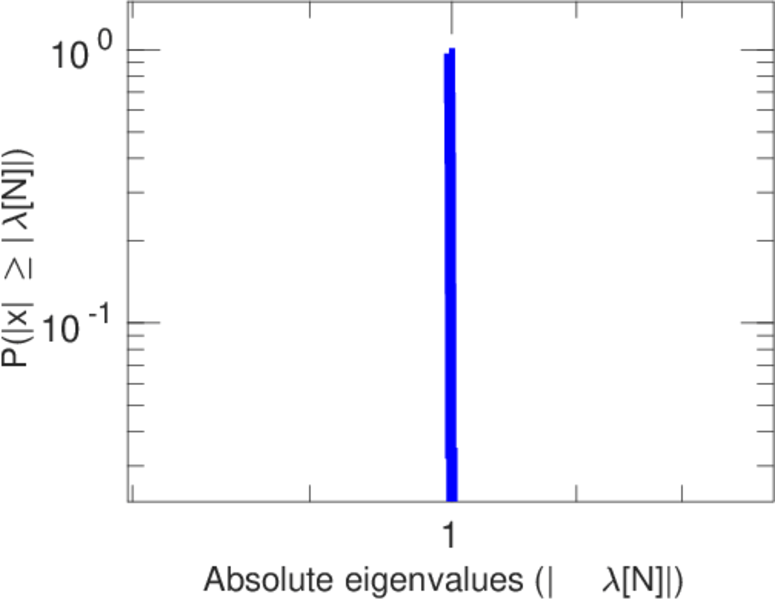
| Spectral separation | |λ1[A] / λ2[A]| = | 1.010 44
|
| Controllability | C = | 437,932
|
| Relative controllability | Cr = | 0.620 624
|
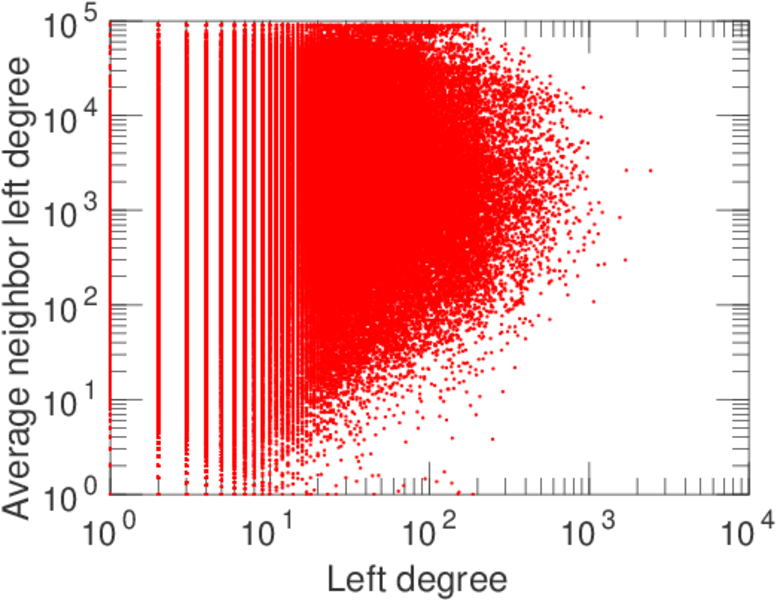
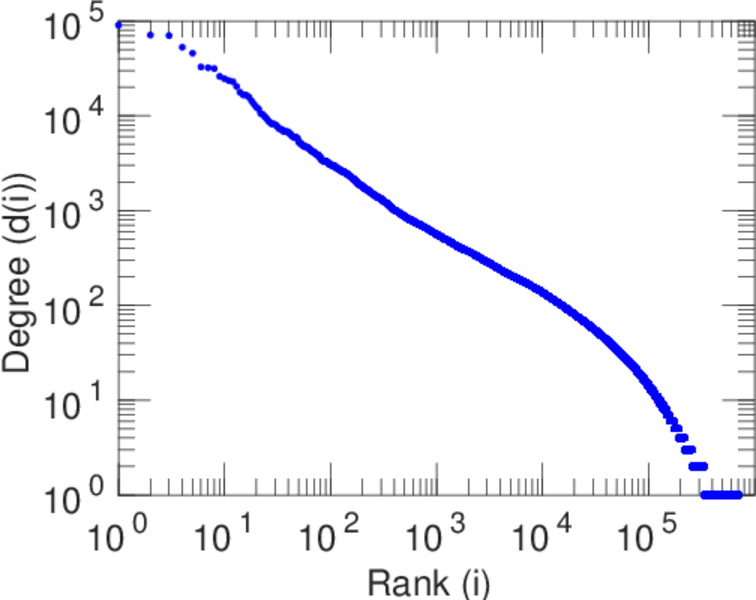
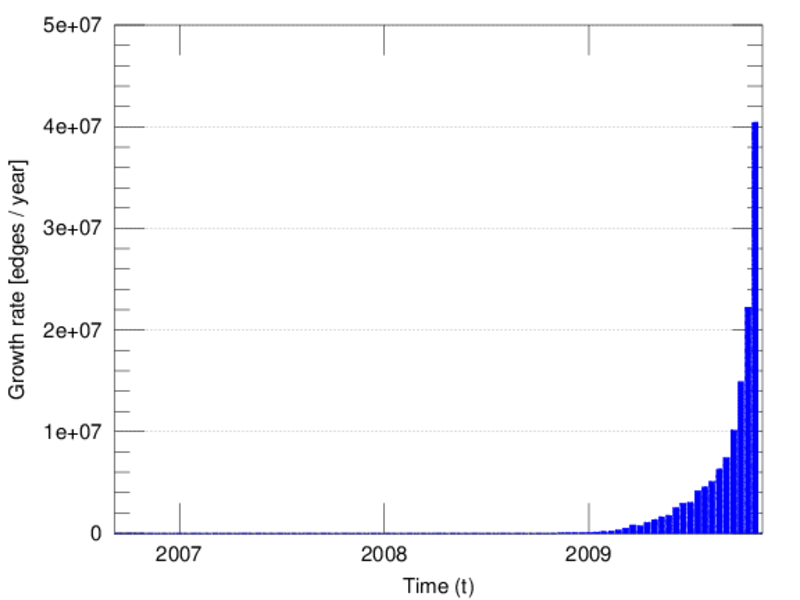
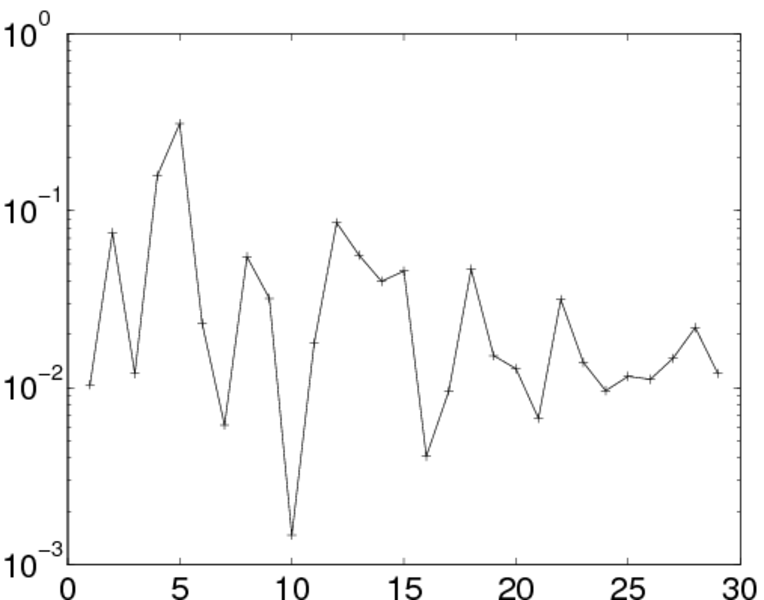
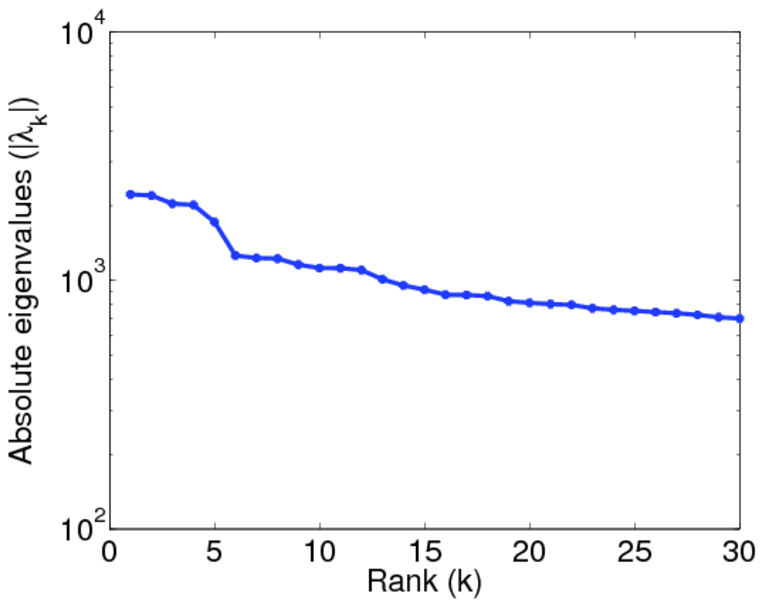
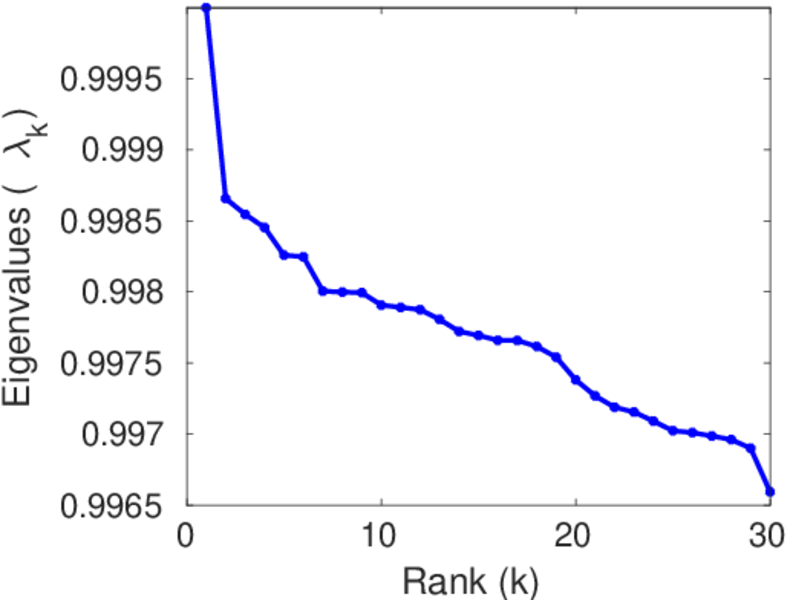
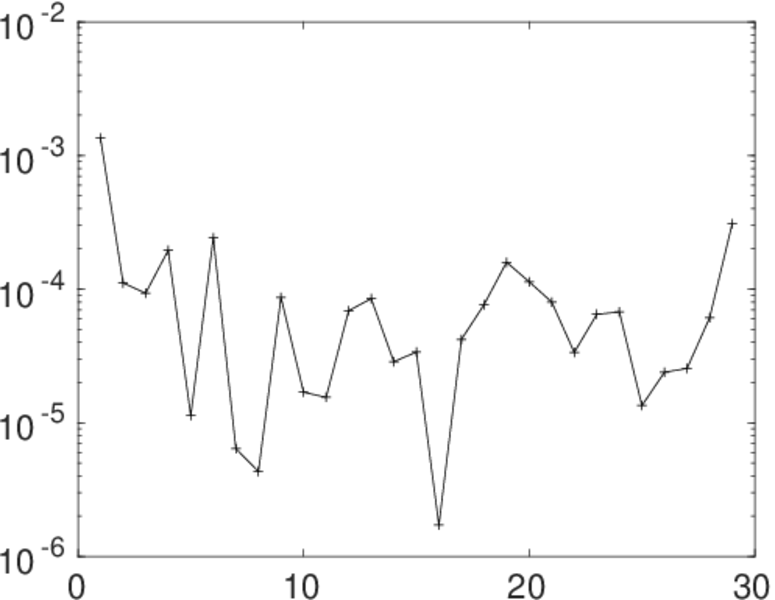
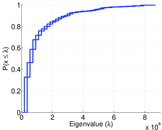
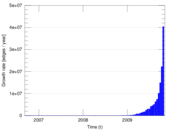
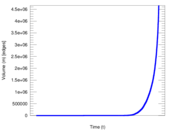
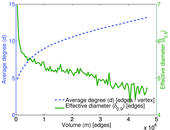
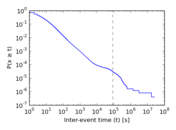
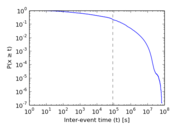
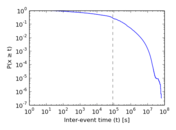
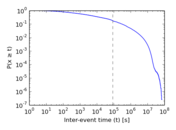
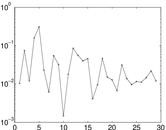
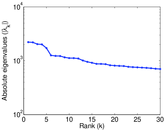
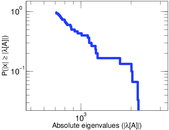
Plots


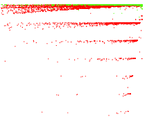
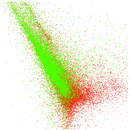


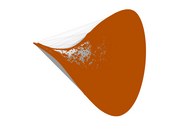


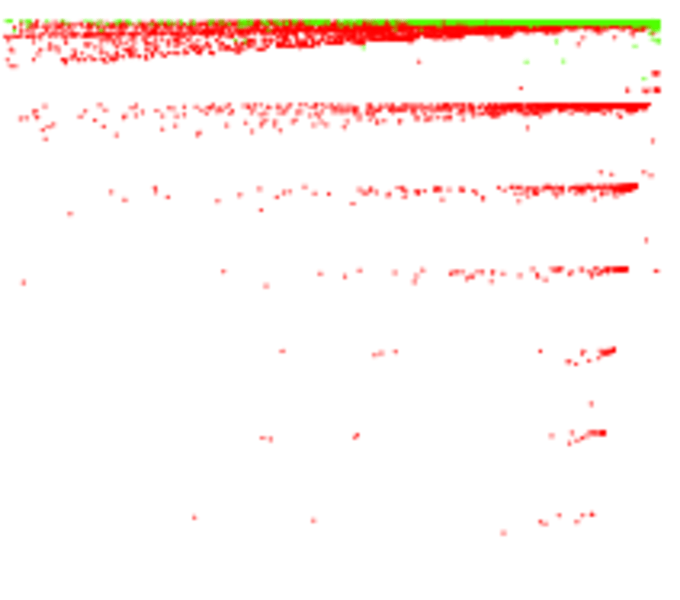
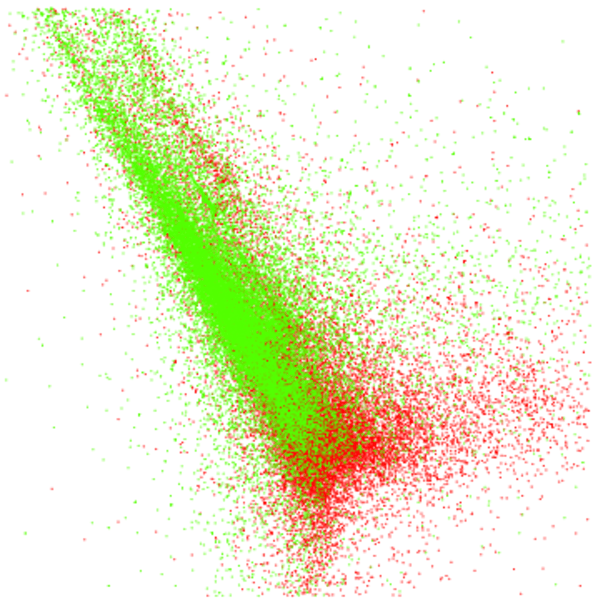
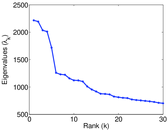
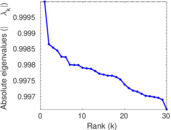
Matrix decompositions plots


Downloads
References
|
[1]
|
Jérôme Kunegis.
KONECT – The Koblenz Network Collection.
In Proc. Int. Conf. on World Wide Web Companion, pages
1343–1350, 2013.
[ http ]
|
|
[2]
|
Munmun De Choudhury, Yu-Ru Lin, Hari Sundaram, K. Selçuk Candan, Lexing Xie,
and Aisling Kelliher.
How does the data sampling strategy impact the discovery of
information diffusion in social media?
In ICWSM, pages 34–41, 2010.
|
 KONECT ‣ Networks ‣
Buy Me a Coffee
KONECT ‣ Networks ‣
Buy Me a Coffee