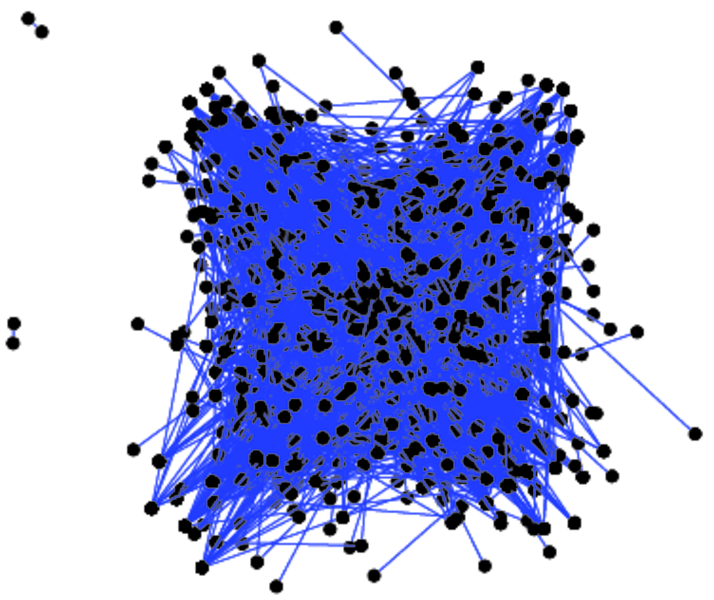
UC Irvine forum
This bipartite network contains user posts to forums. The users are students at
the University of California, Irvine. An edge represents a forum message.
Metadata
Statistics
| Size | n = | 1,421
|
| Left size | n1 = | 899
|
| Right size | n2 = | 522
|
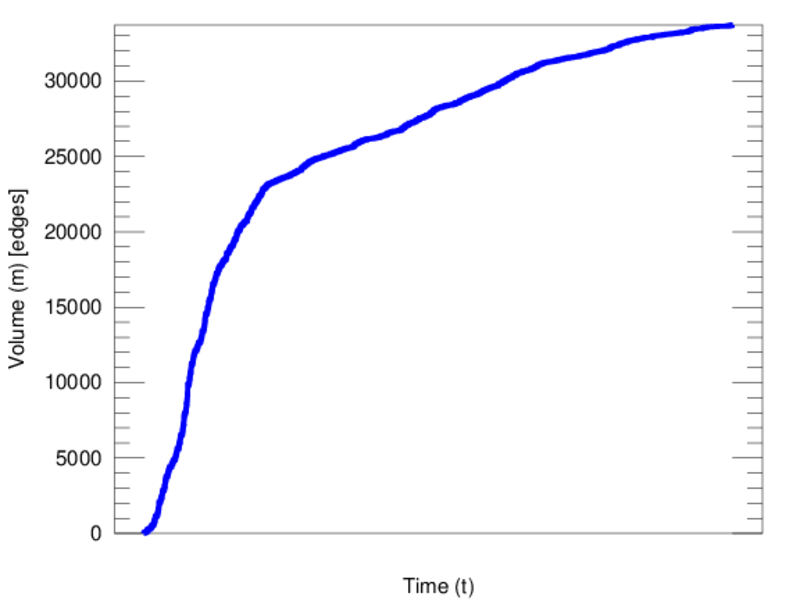
| Volume | m = | 33,720
|
| Unique edge count | m̿ = | 7,089
|
| Wedge count | s = | 174,069
|
| Claw count | z = | 2,807,597
|
| Cross count | x = | 50,117,282
|
| Square count | q = | 76,095
|
| 4-Tour count | T4 = | 1,322,222
|
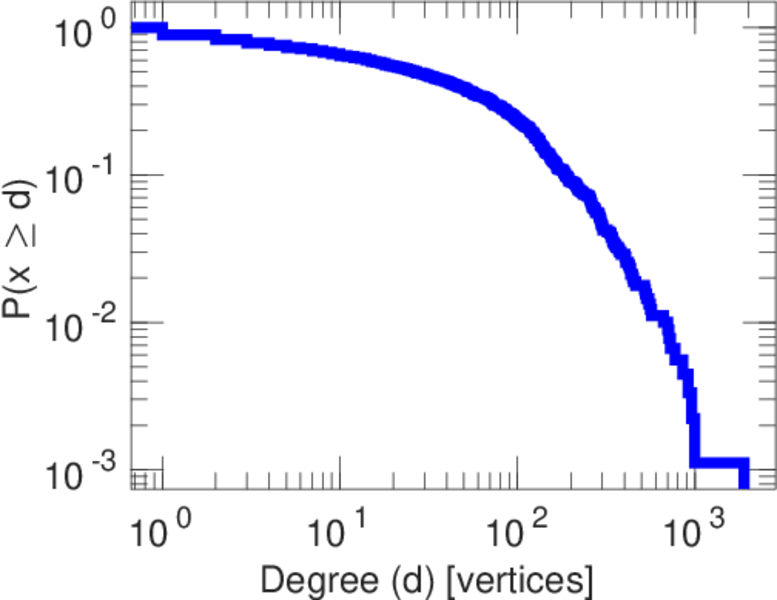
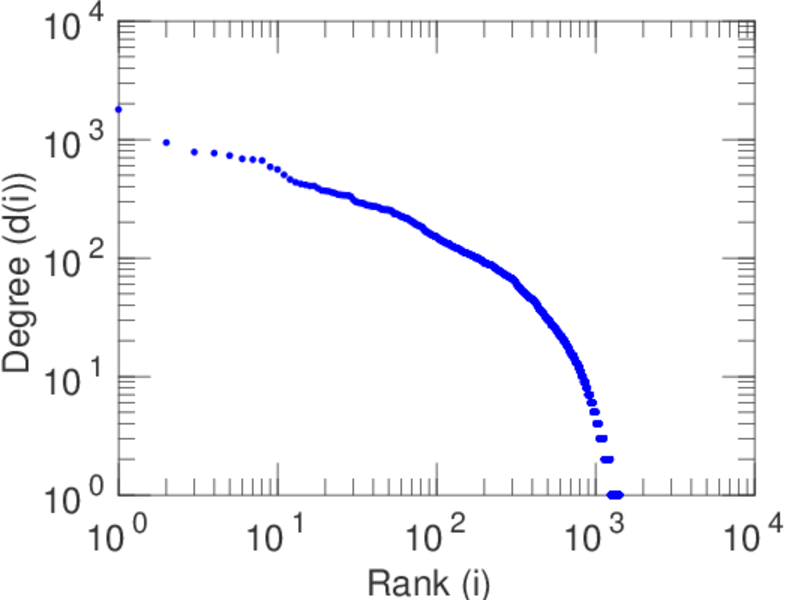
| Maximum degree | dmax = | 1,792
|
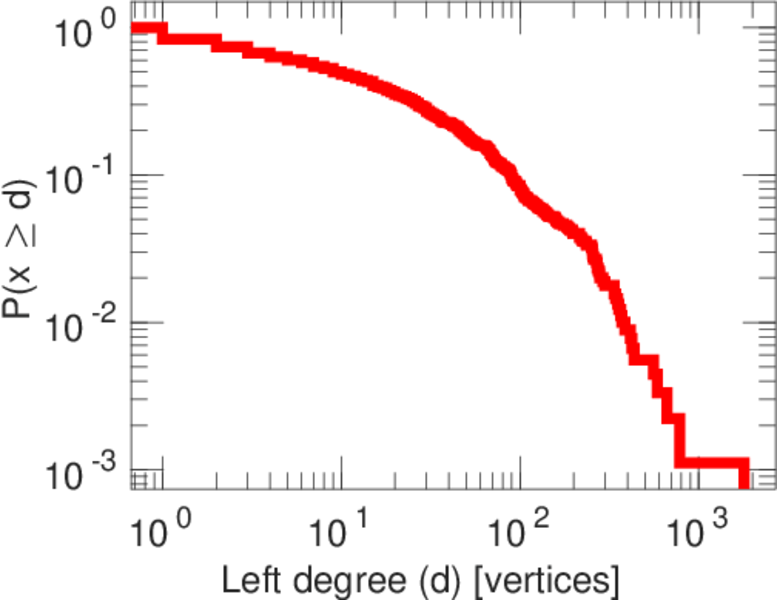
| Maximum left degree | d1max = | 1,792
|
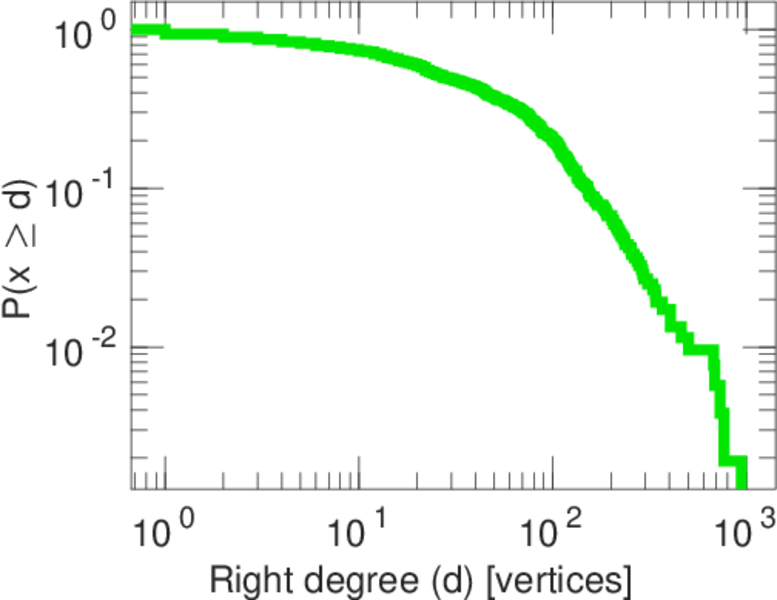
| Maximum right degree | d2max = | 942
|
| Average degree | d = | 47.459 5
|
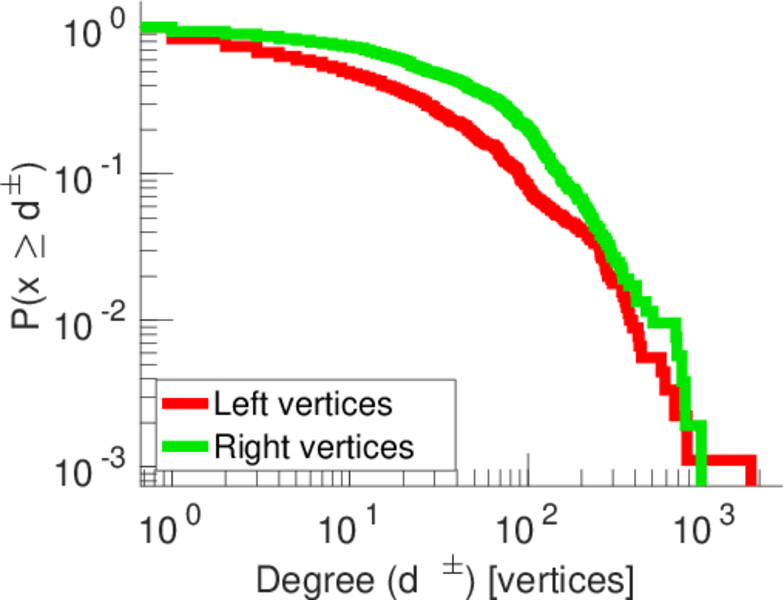
| Average left degree | d1 = | 37.508 3
|
| Average right degree | d2 = | 64.597 7
|
| Fill | p = | 0.015 106 2
|
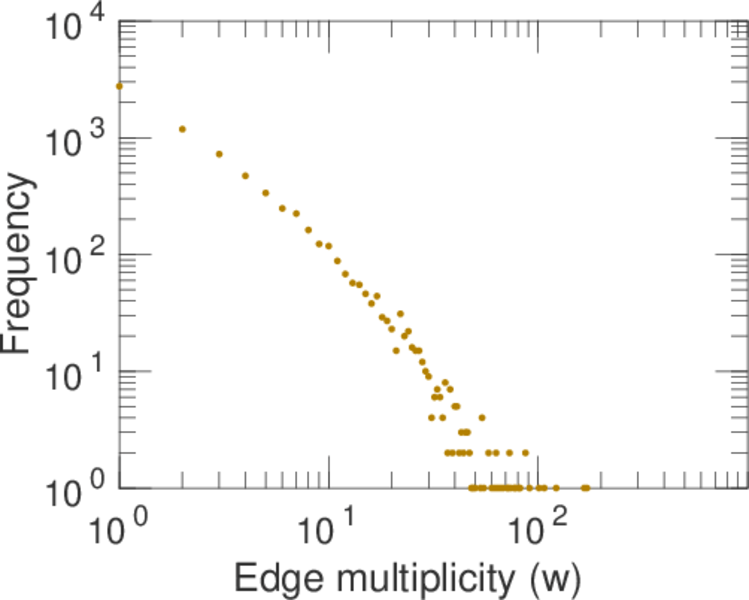
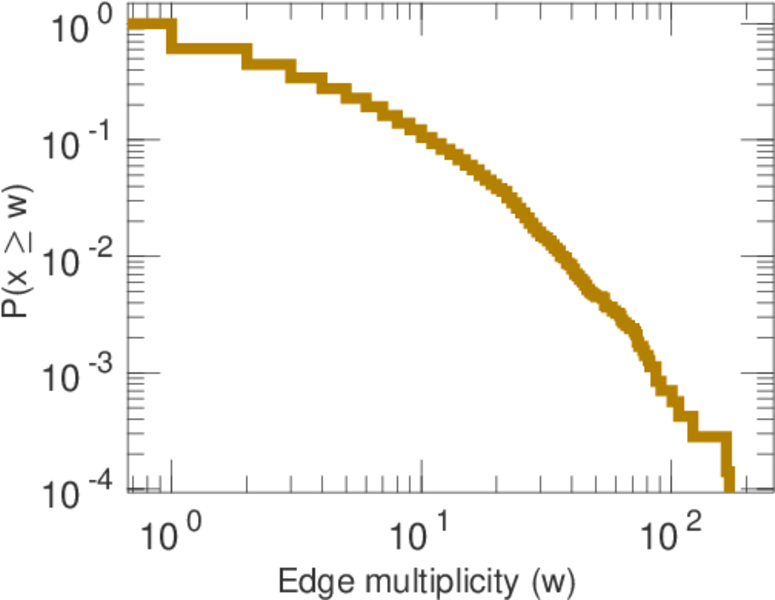
| Average edge multiplicity | m̃ = | 4.756 67
|
| Size of LCC | N = | 1,417
|
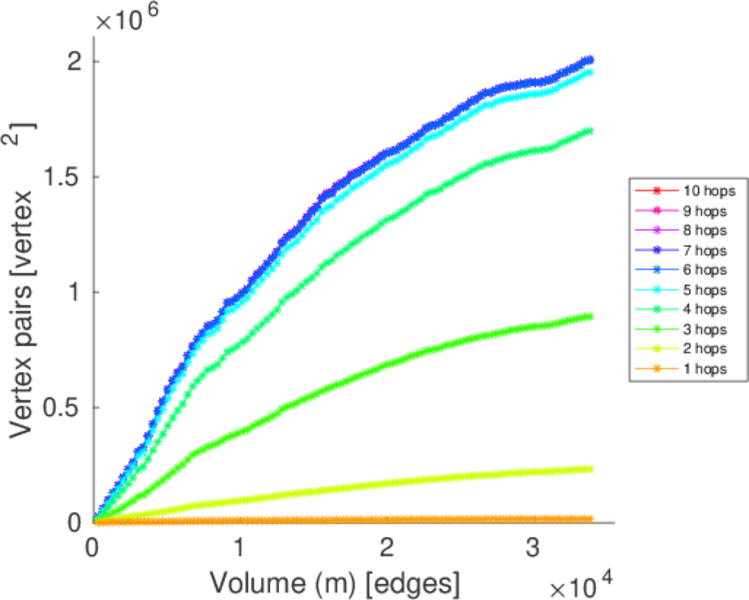
| Diameter | δ = | 8
|
| 50-Percentile effective diameter | δ0.5 = | 3.126 95
|
| 90-Percentile effective diameter | δ0.9 = | 4.402 38
|
| Median distance | δM = | 4
|
| Mean distance | δm = | 3.605 28
|
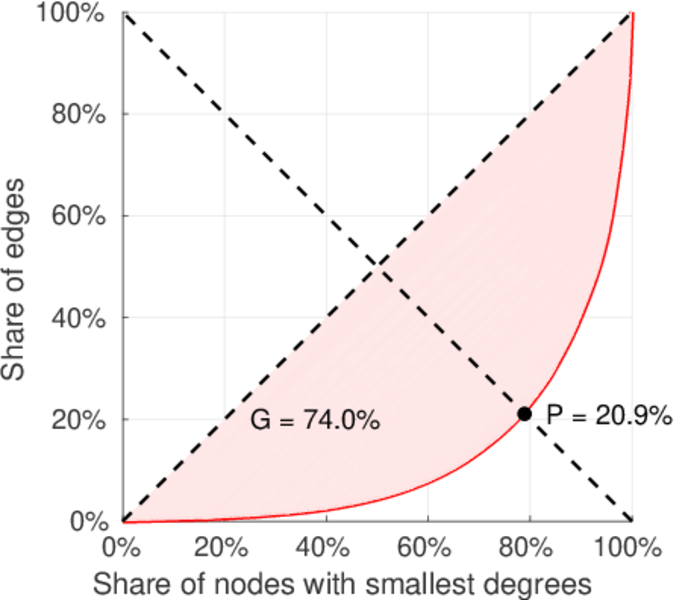
| Gini coefficient | G = | 0.681 900
|
| Balanced inequality ratio | P = | 0.242 067
|
| Left balanced inequality ratio | P1 = | 0.209 342
|
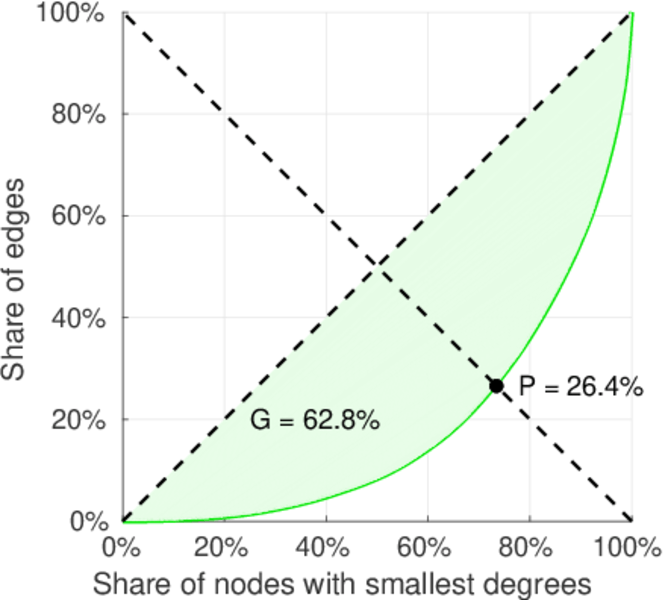
| Right balanced inequality ratio | P2 = | 0.264 116
|
| Relative edge distribution entropy | Her = | 0.926 953
|
| Power law exponent | γ = | 1.584 63
|
| Tail power law exponent | γt = | 3.301 00
|
| Tail power law exponent with p | γ3 = | 3.301 00
|
| p-value | p = | 0.393 000
|
| Left tail power law exponent with p | γ3,1 = | 3.851 00
|
| Left p-value | p1 = | 0.923 000
|
| Right tail power law exponent with p | γ3,2 = | 3.031 00
|
| Right p-value | p2 = | 0.229 000
|
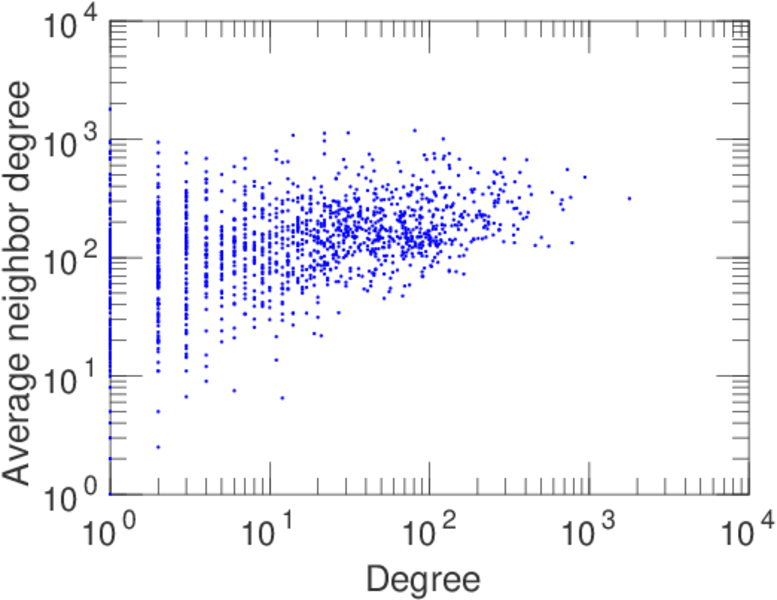
| Degree assortativity | ρ = | −0.092 975 0
|
| Degree assortativity p-value | pρ = | 4.372 55 × 10−15
|
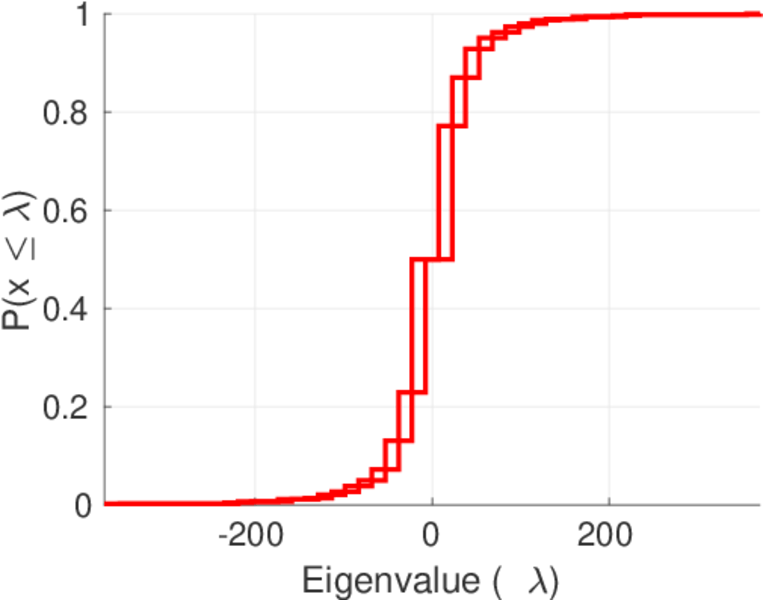
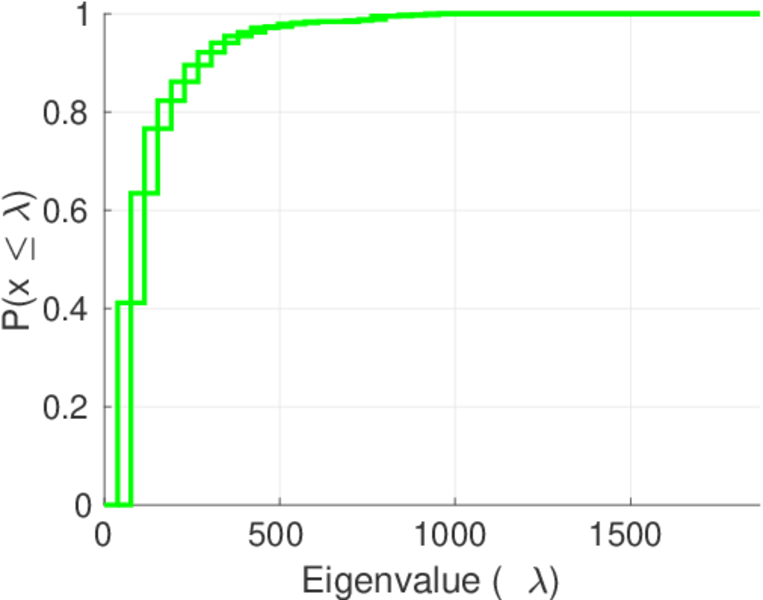
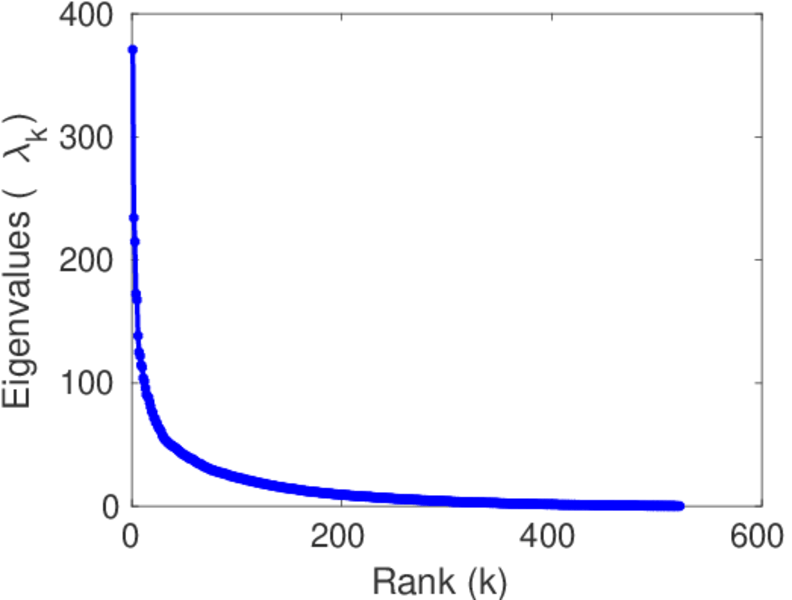
| Spectral norm | α = | 370.755
|
| Algebraic connectivity | a = | 0.375 203
|
| Spectral separation | |λ1[A] / λ2[A]| = | 1.583 30
|
| Controllability | C = | 387
|
| Relative controllability | Cr = | 0.272 343
|
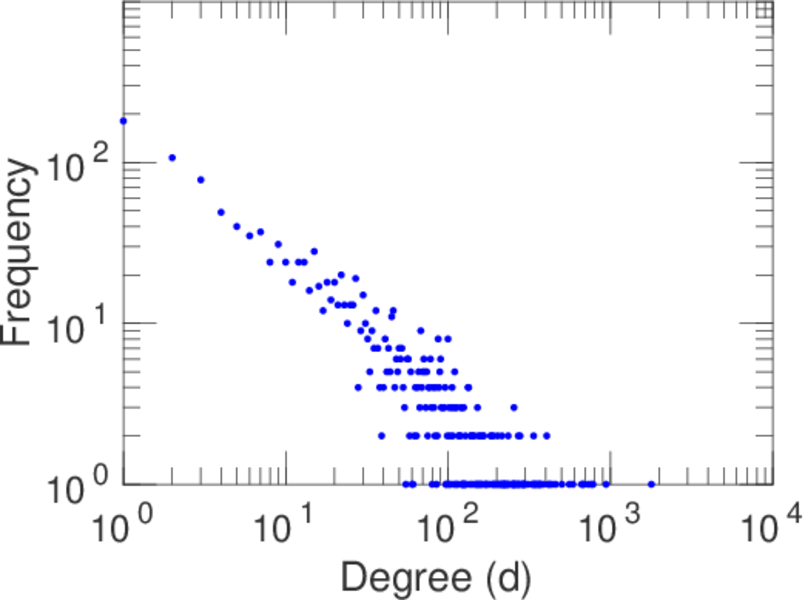
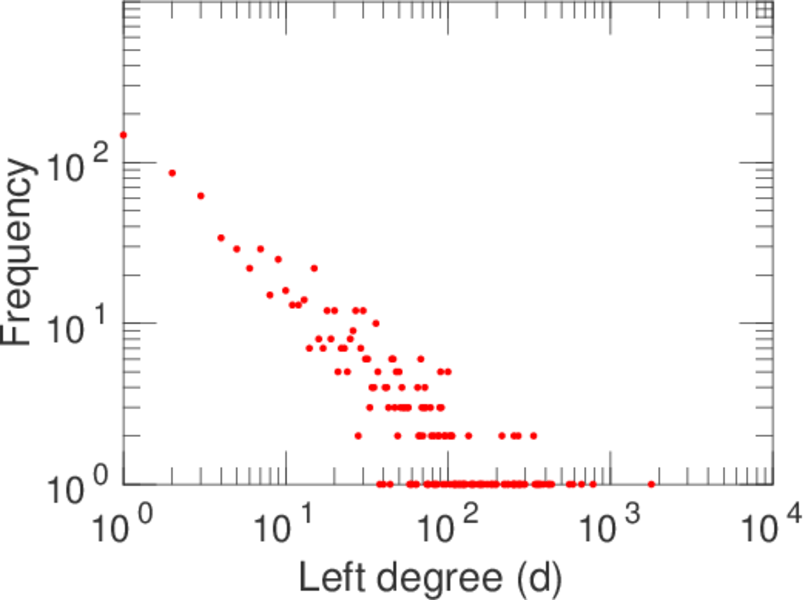
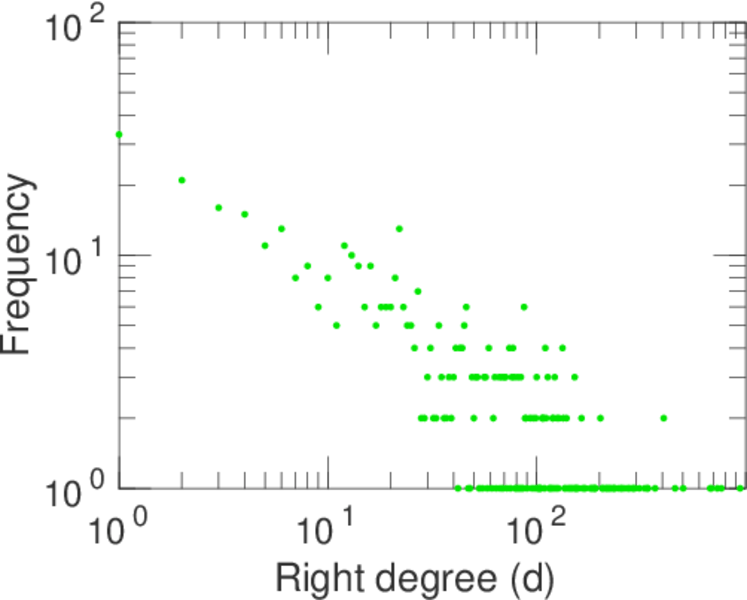
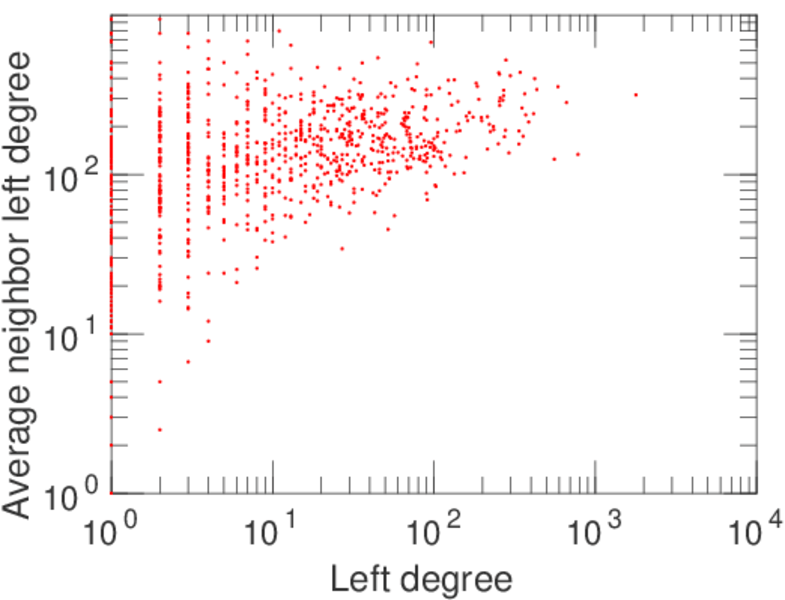
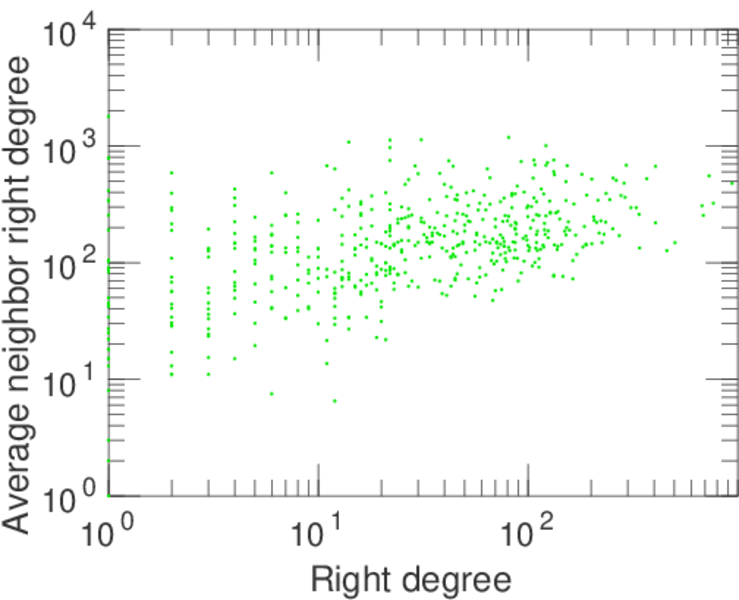
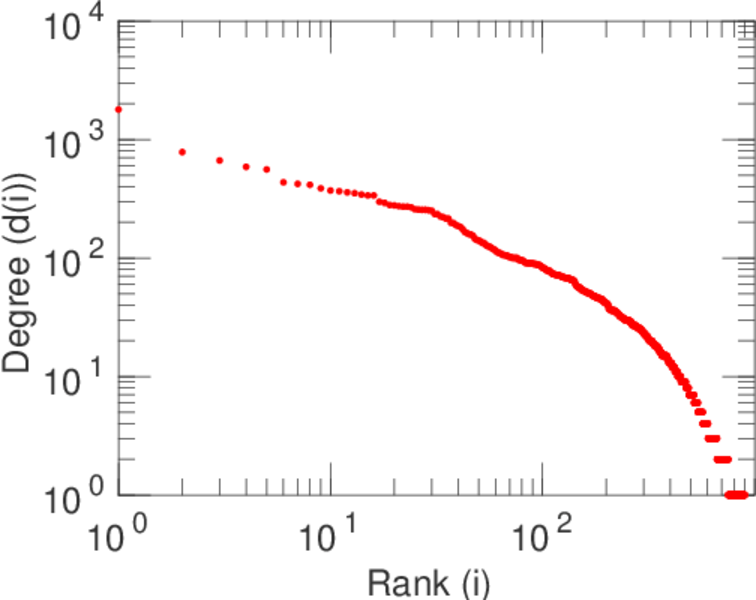
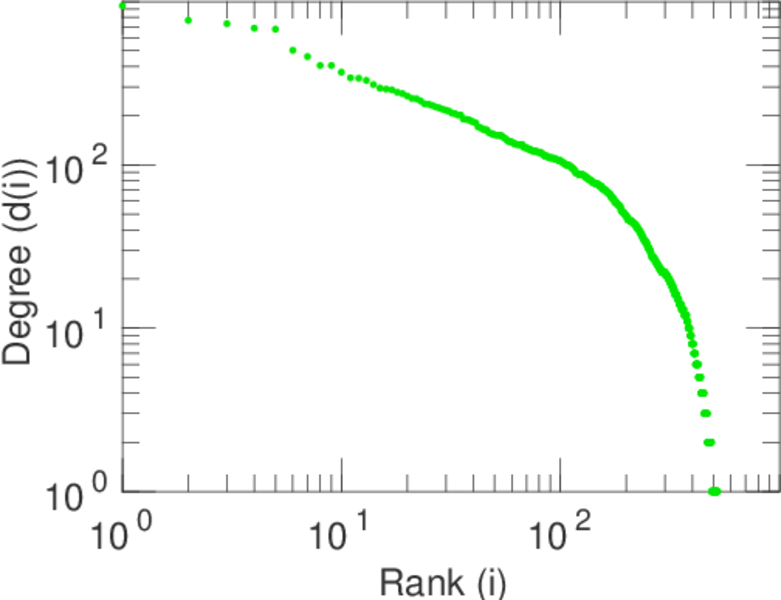
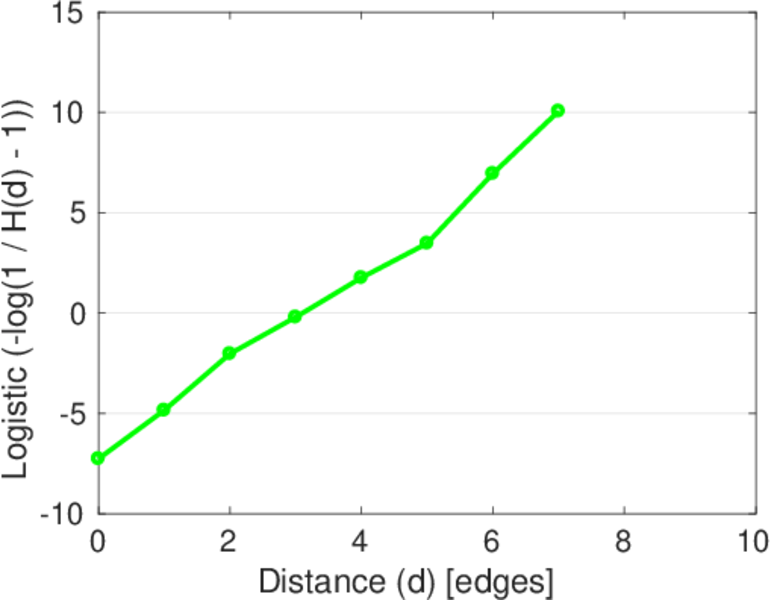
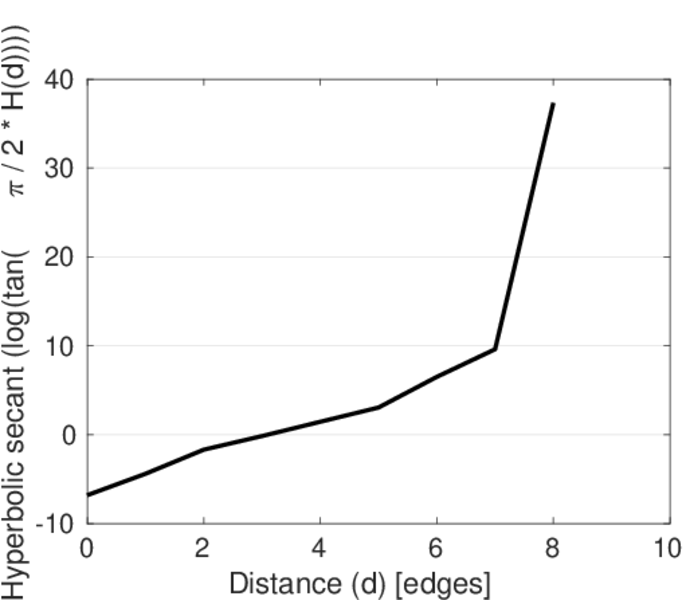
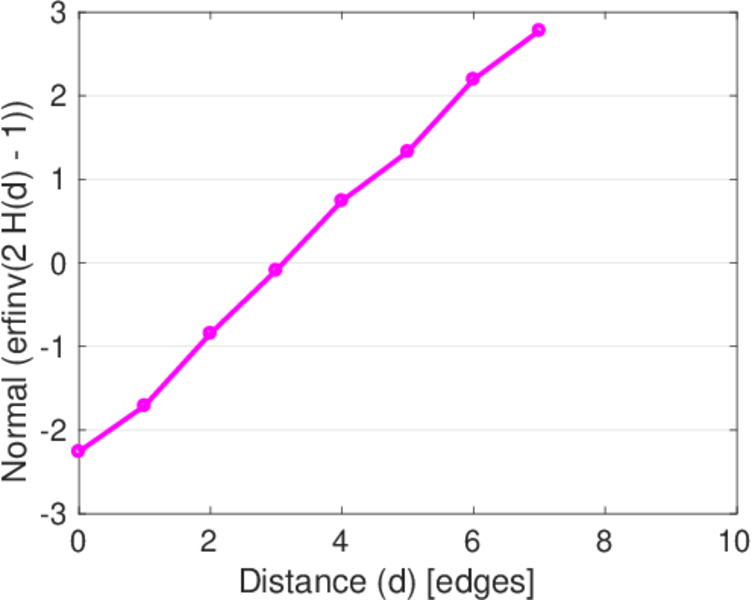
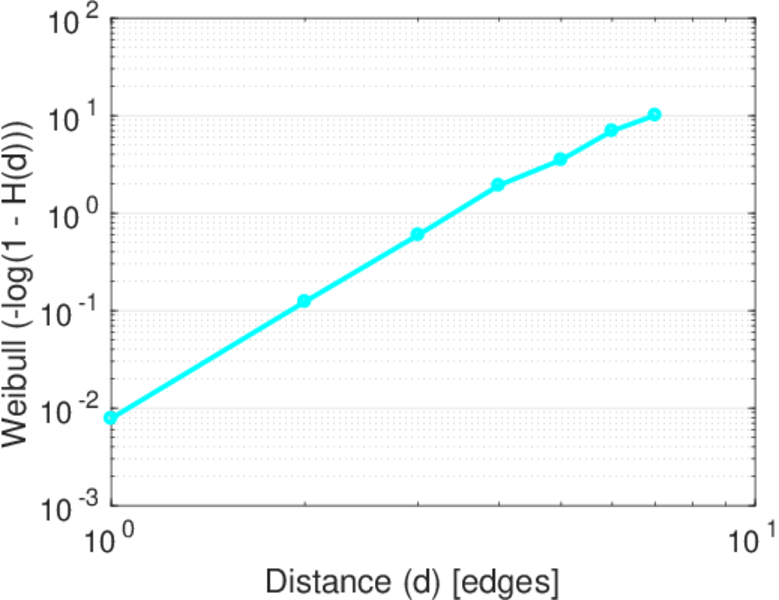
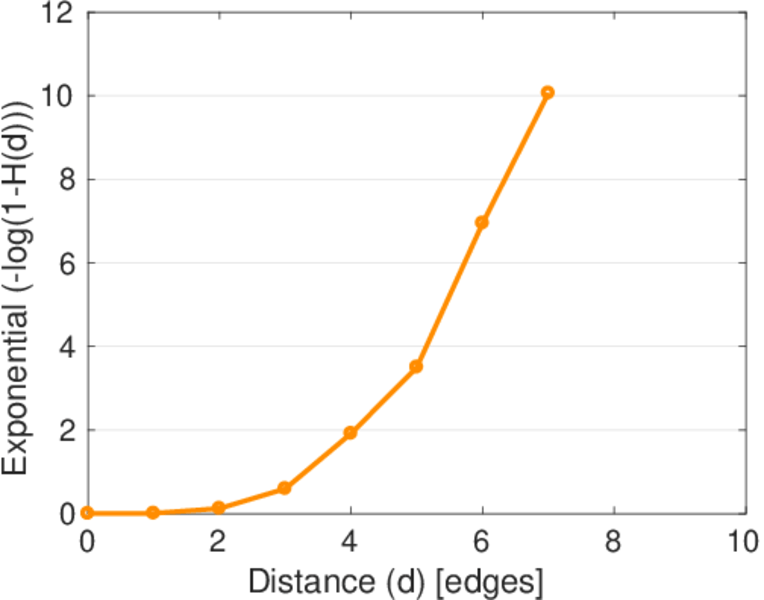
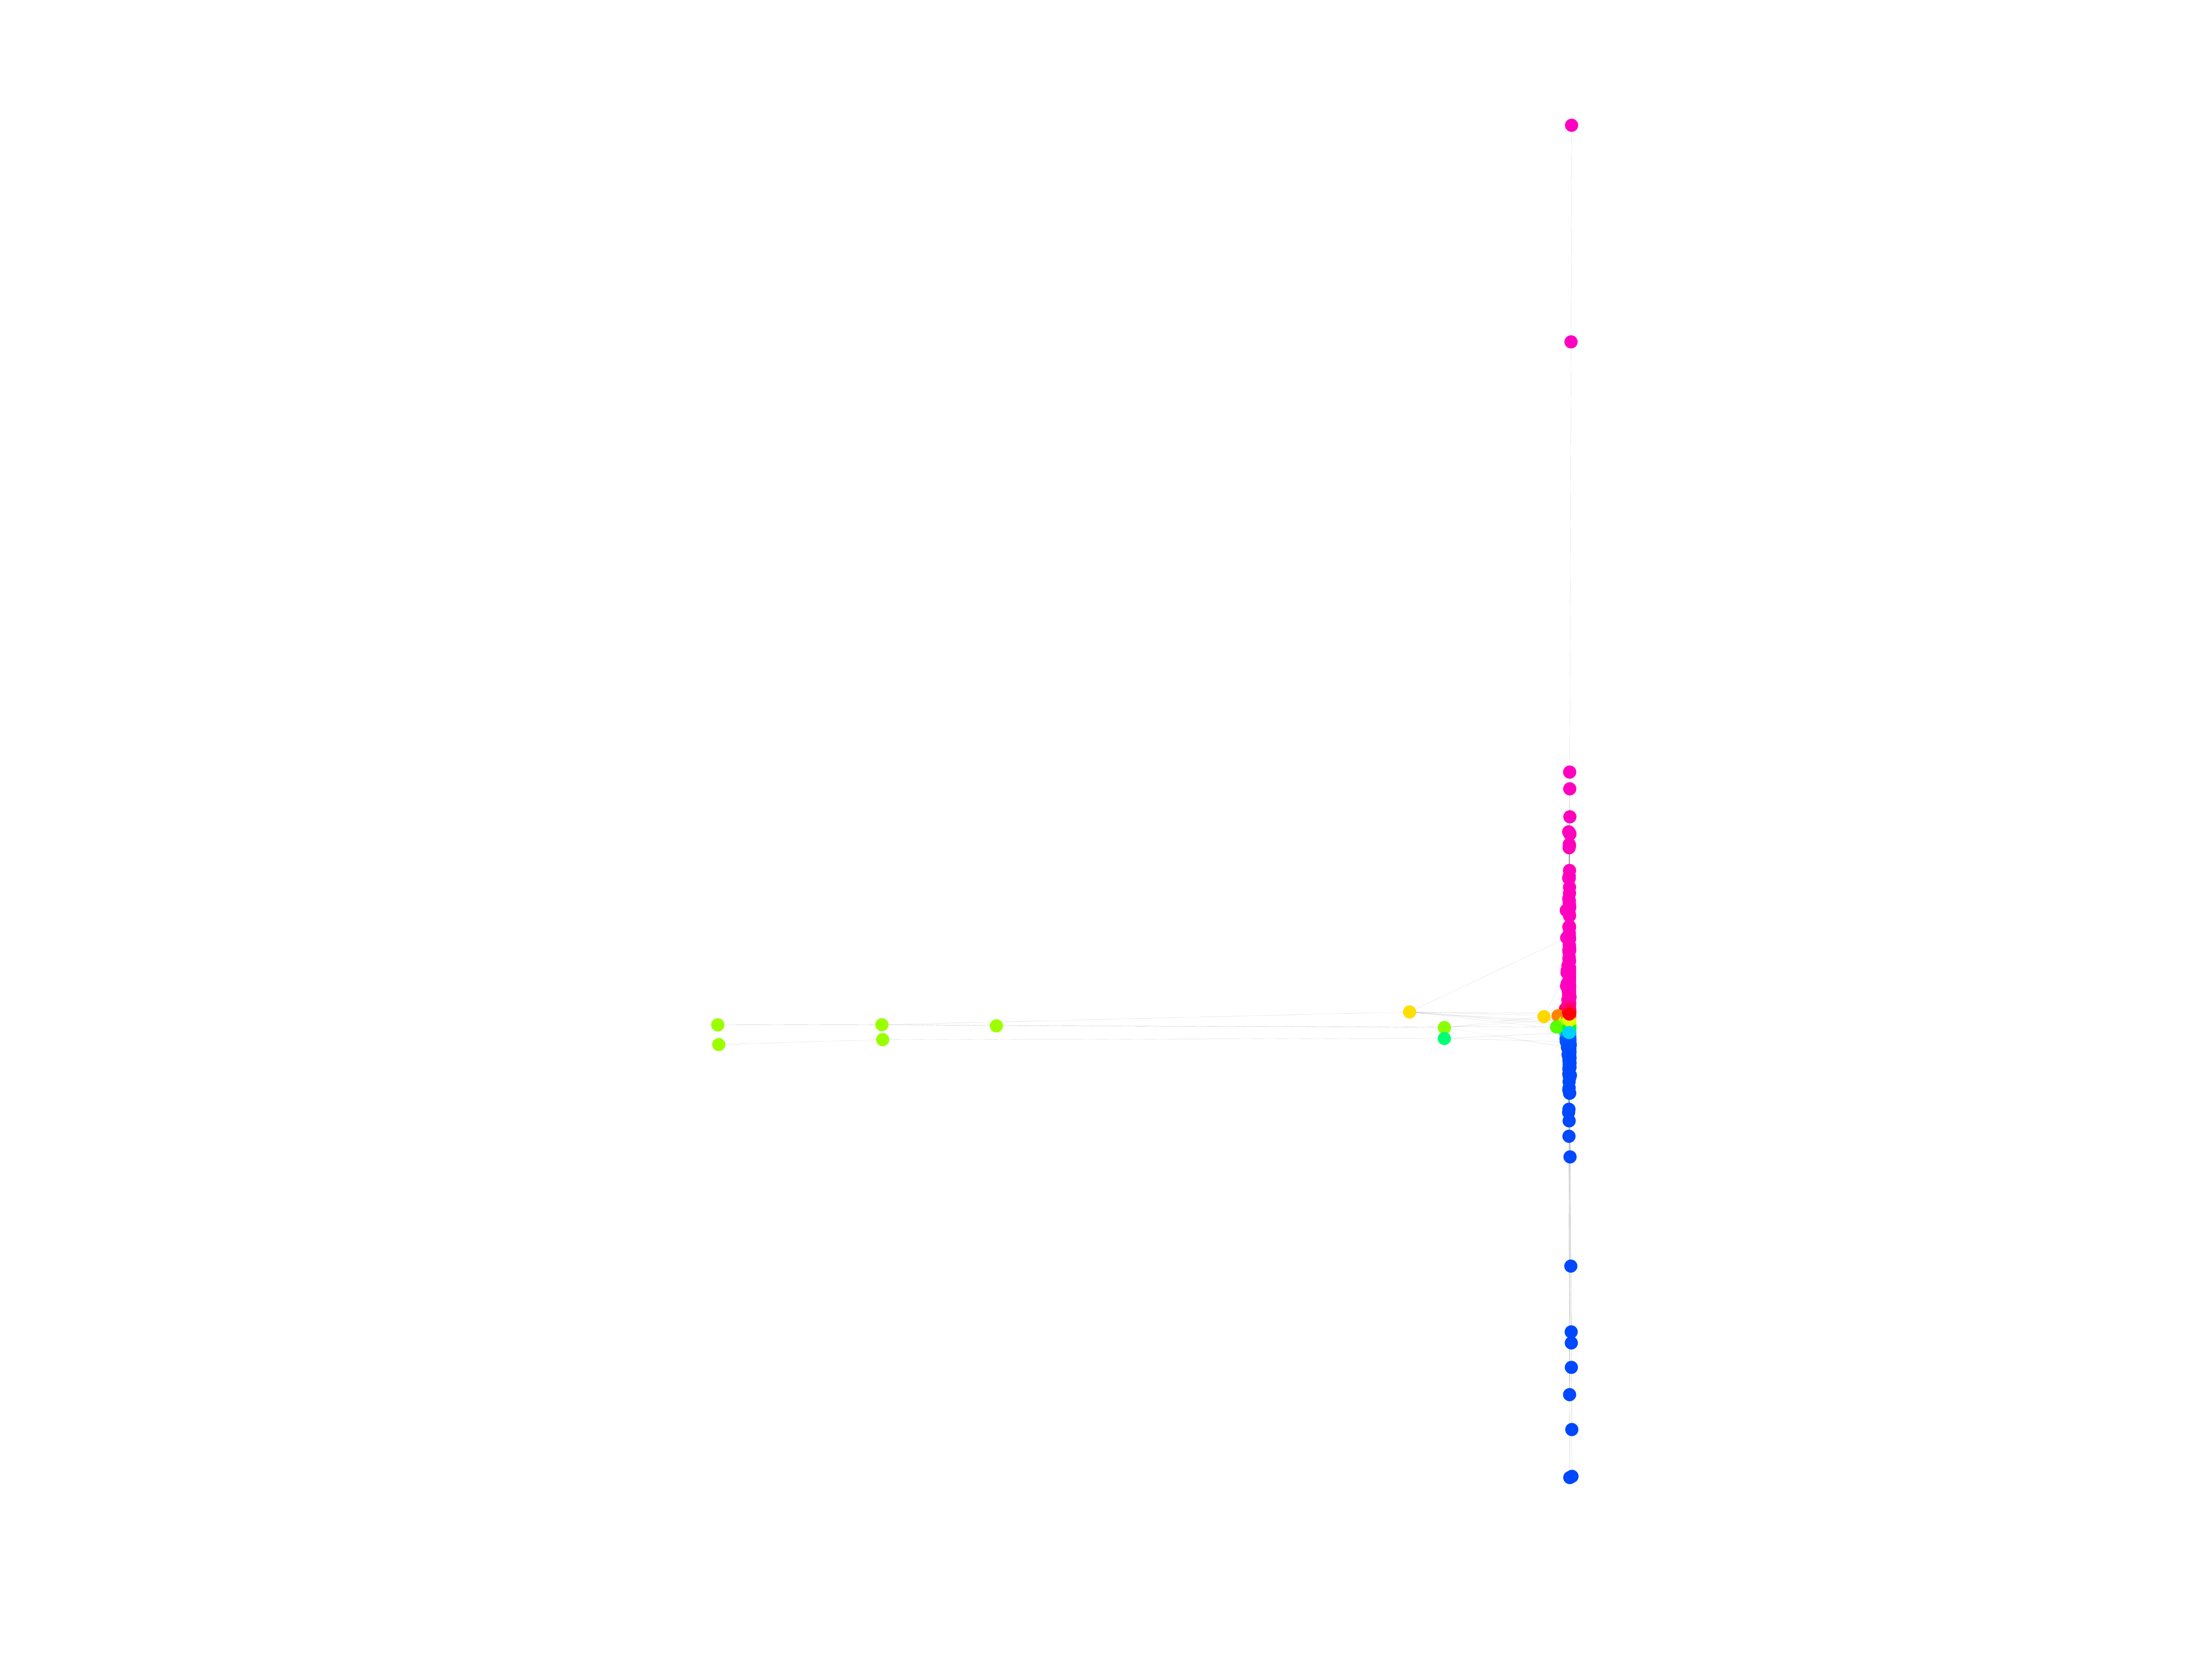
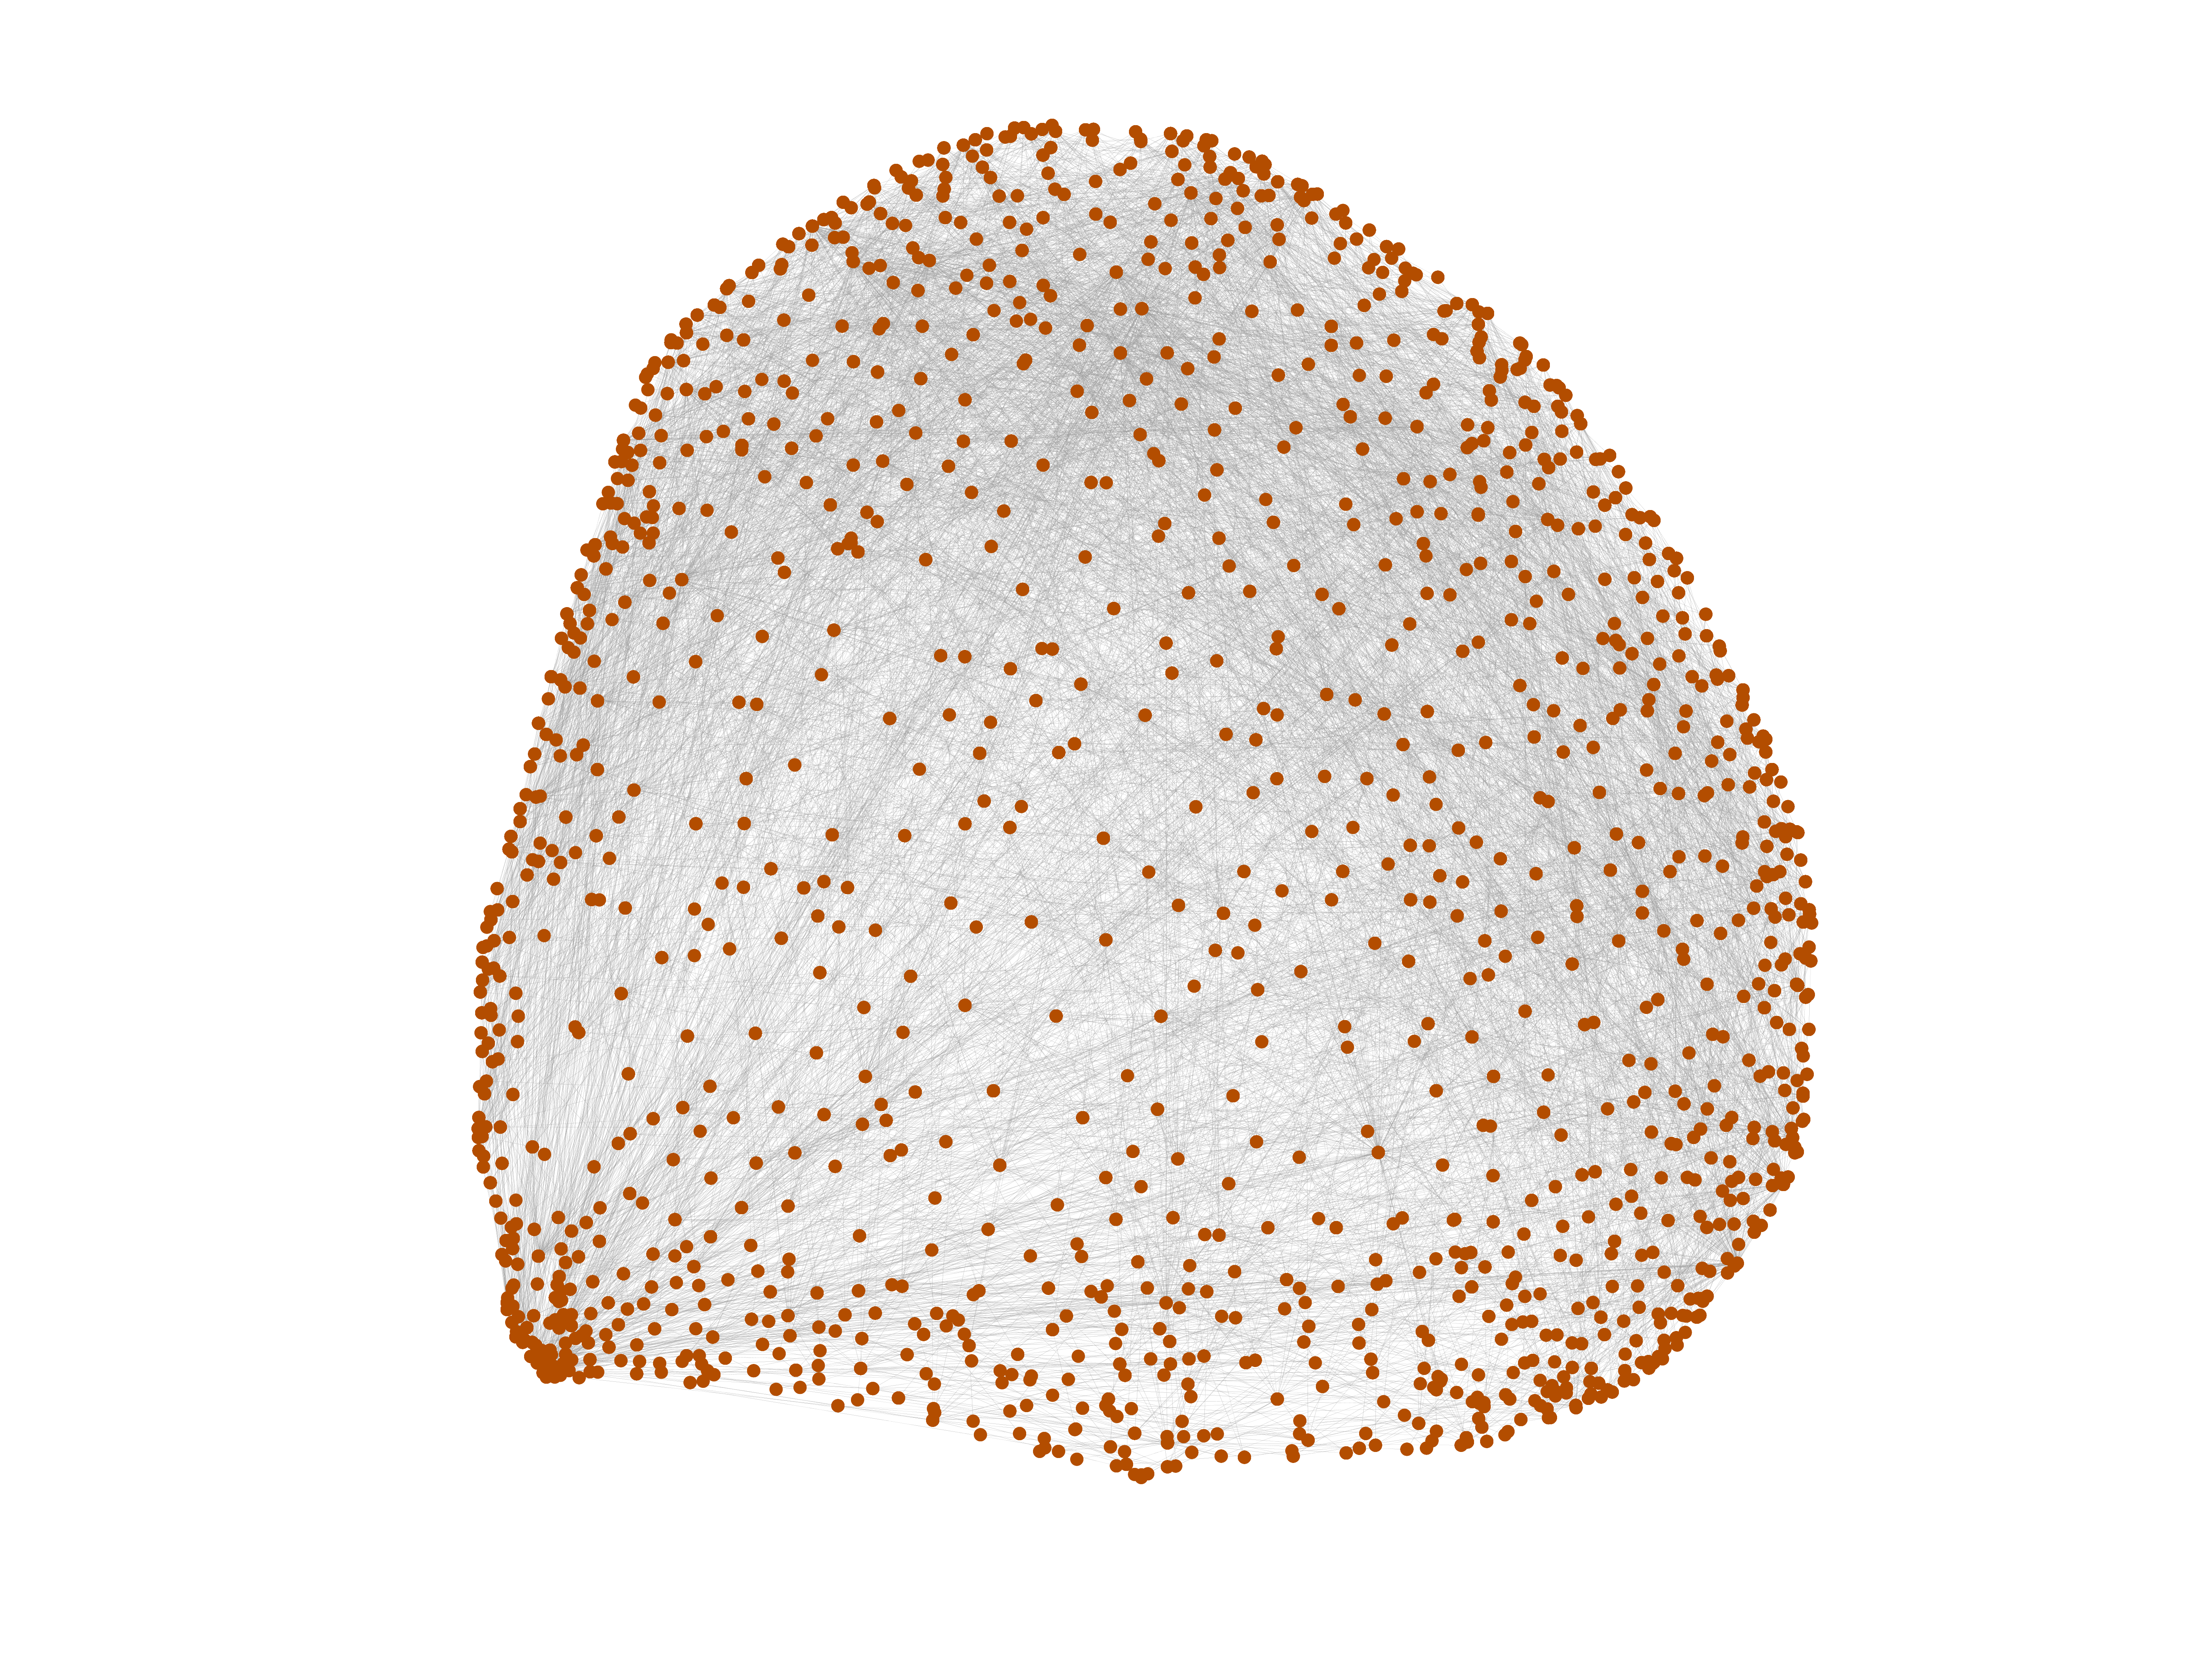
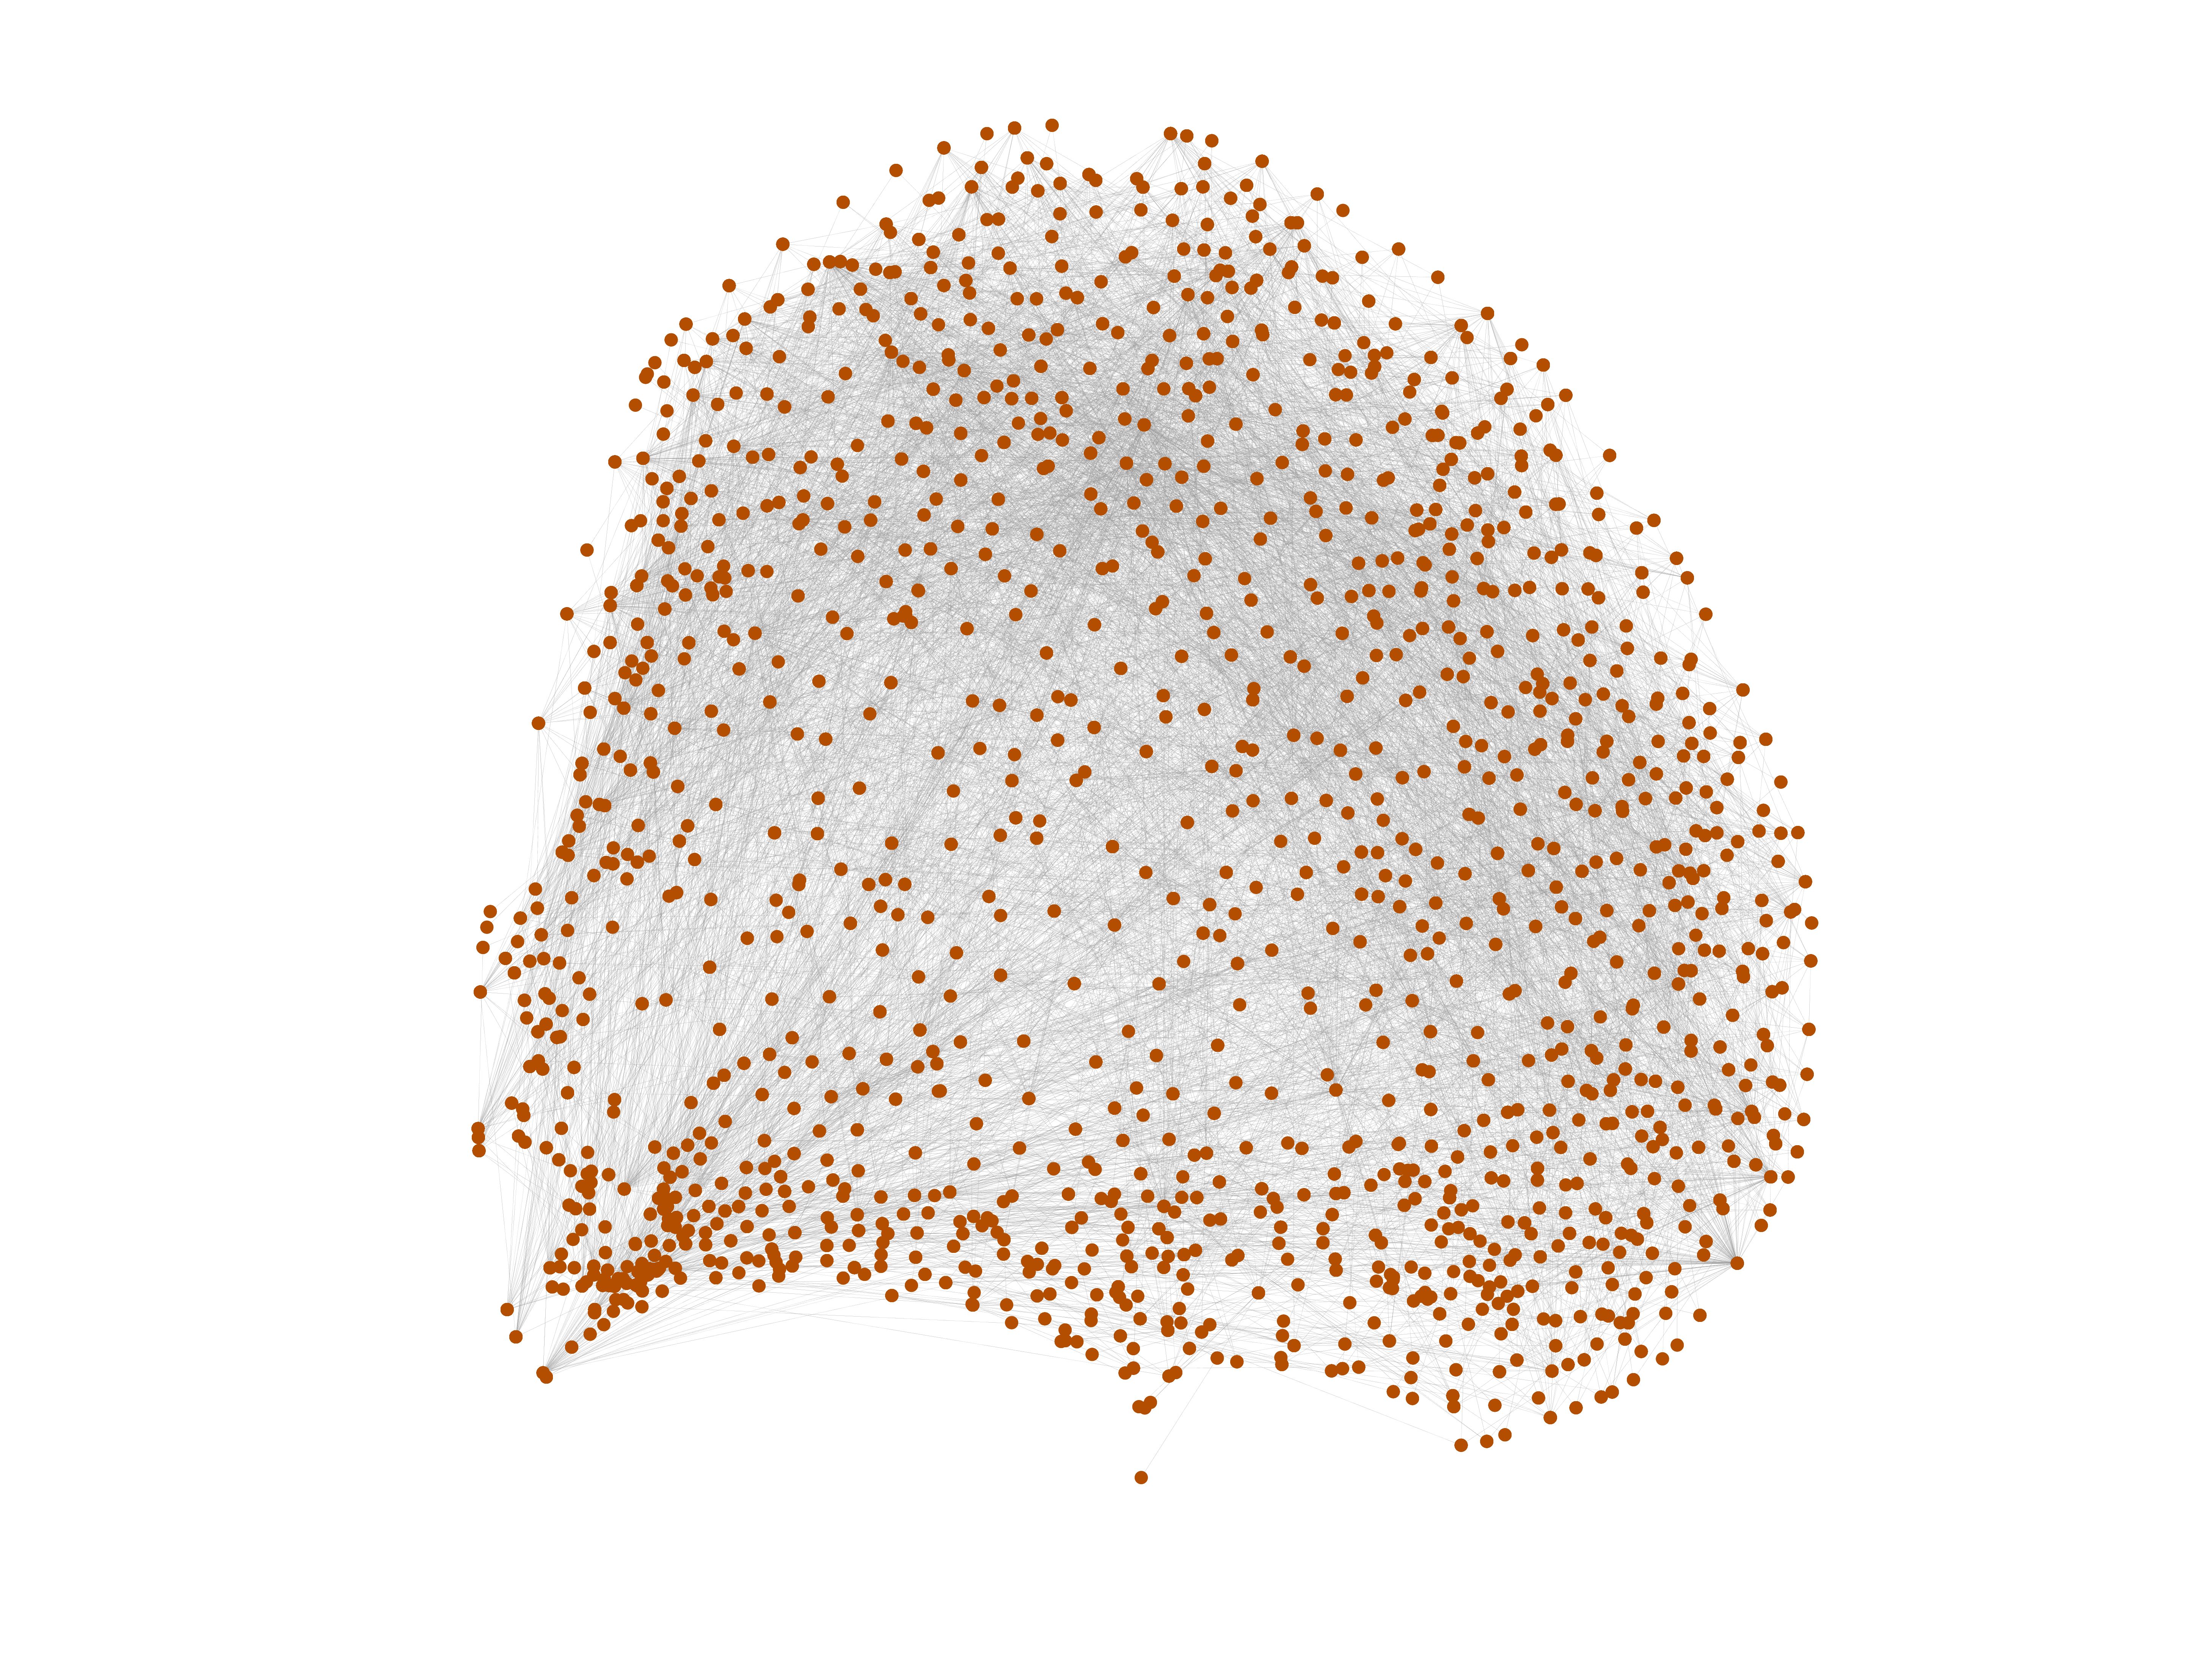
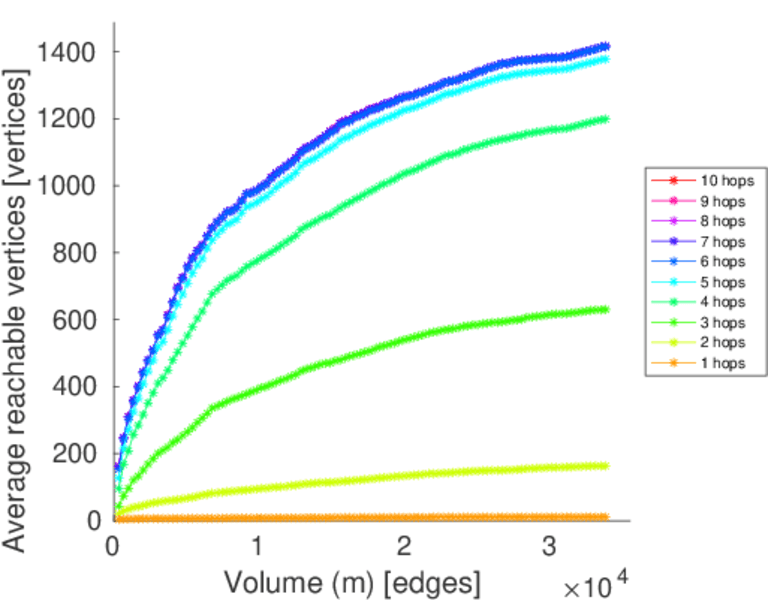
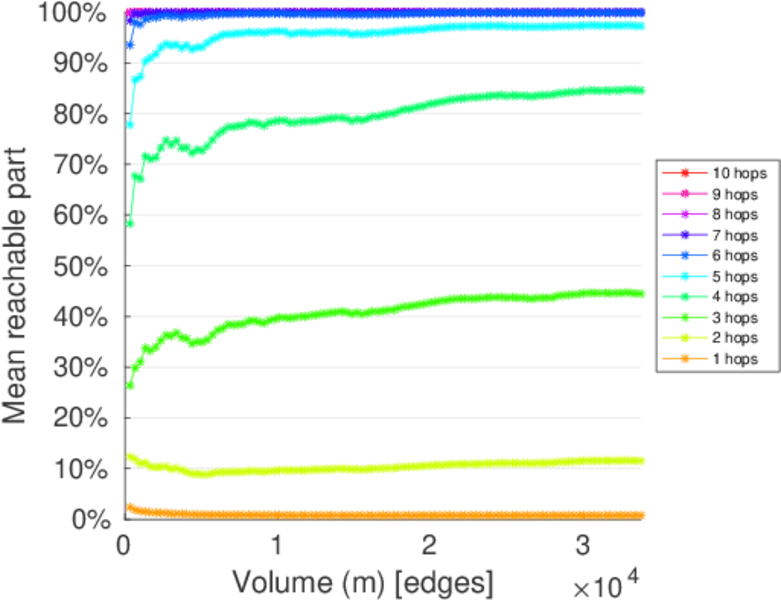
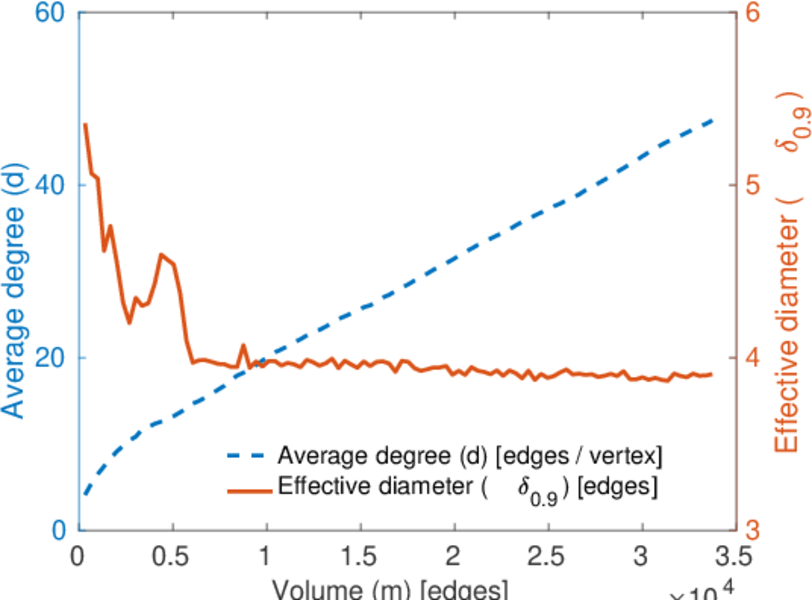
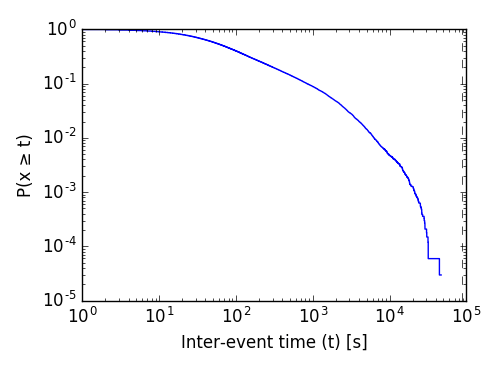
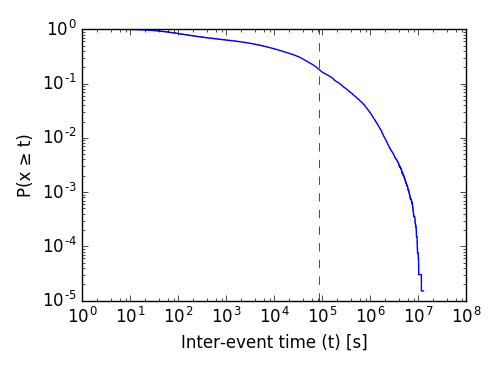
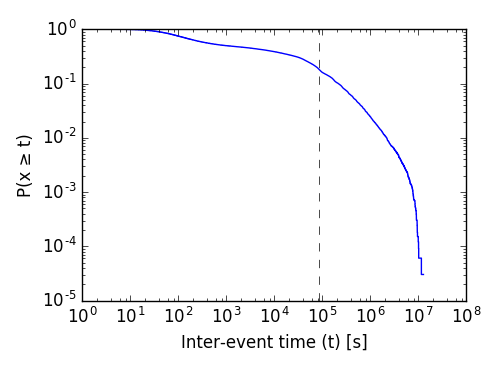
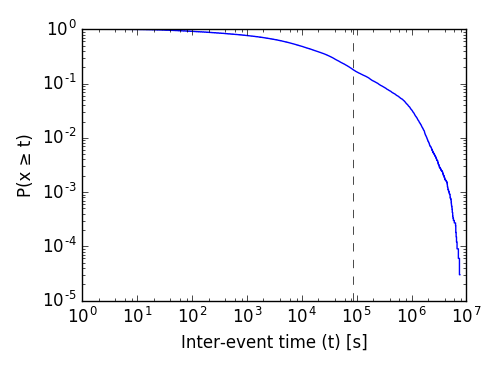
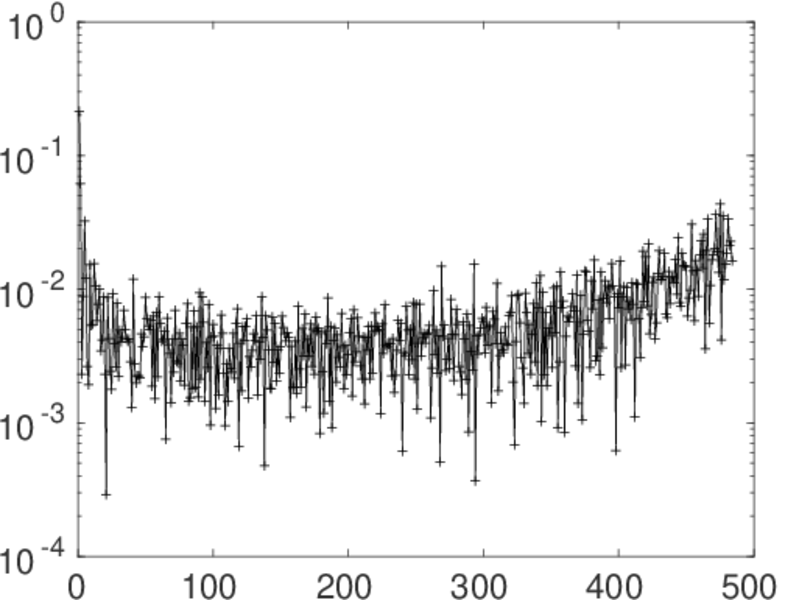
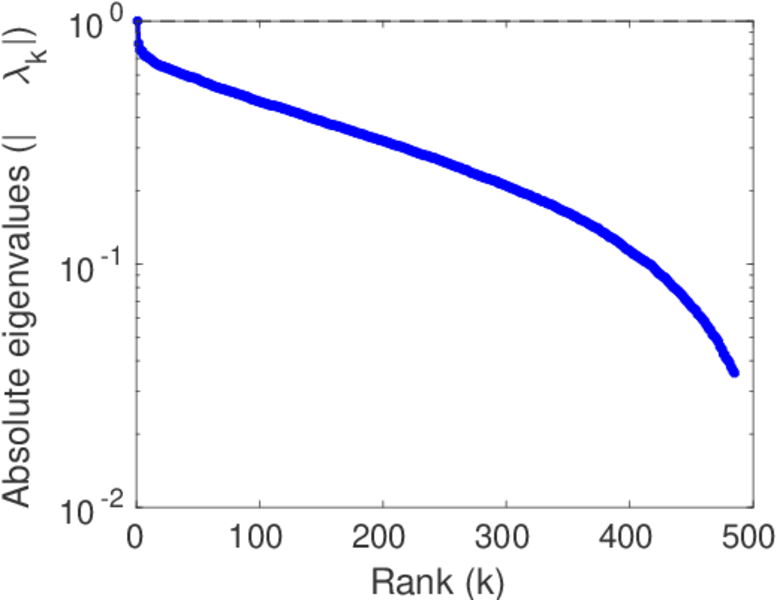
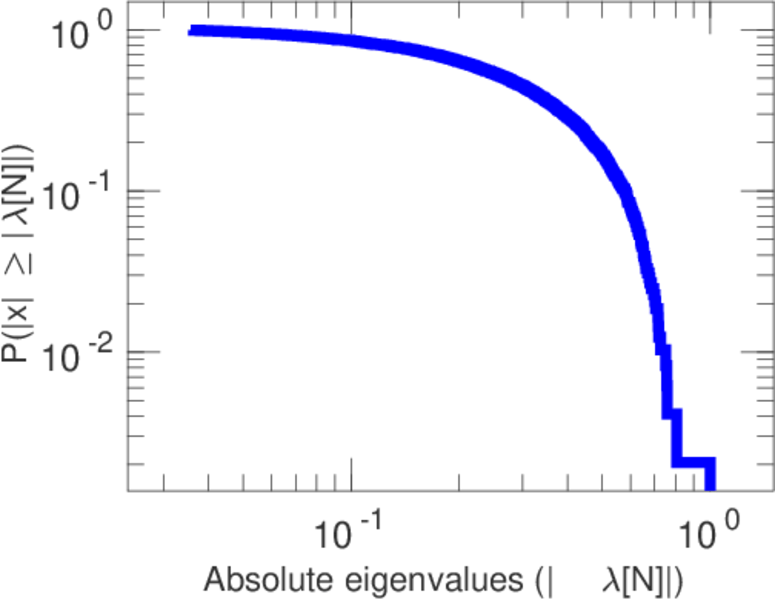
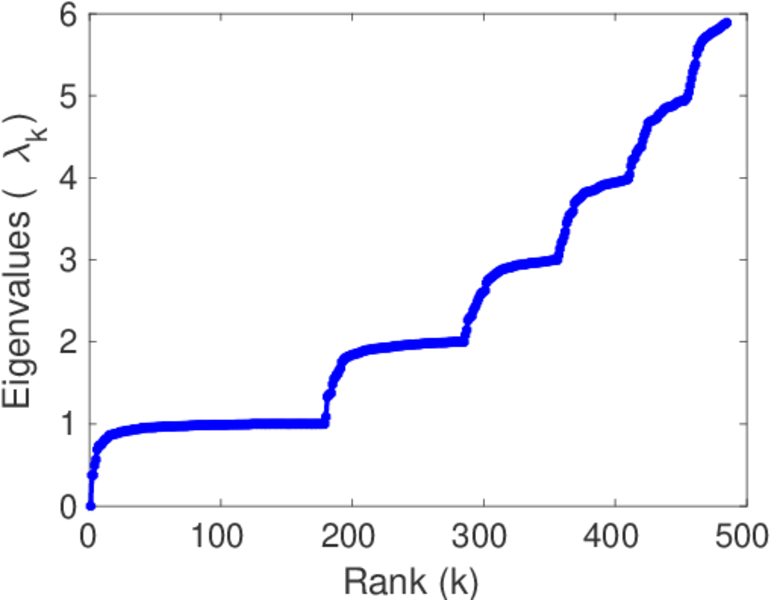
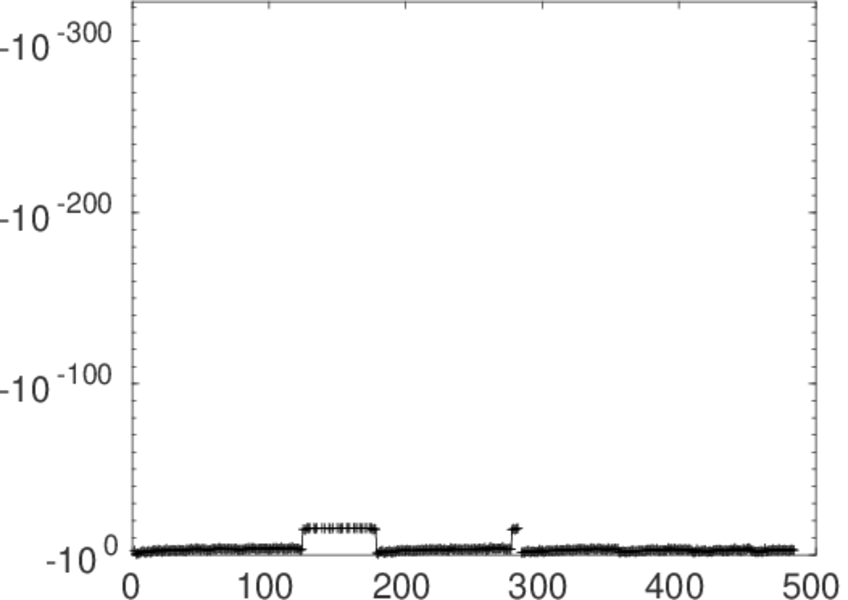
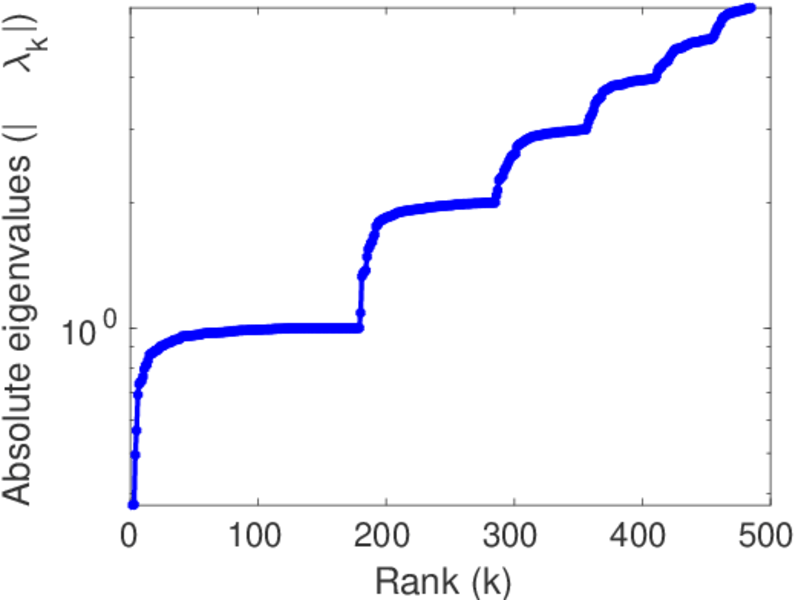
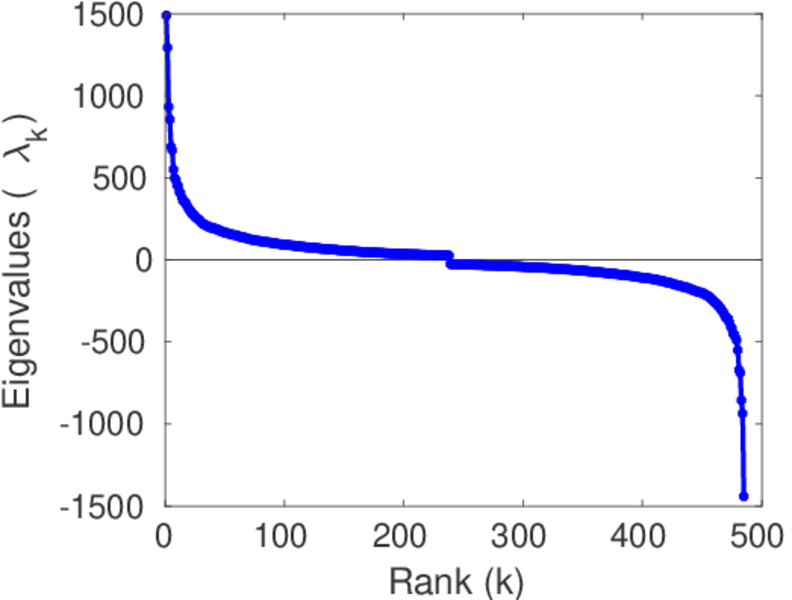
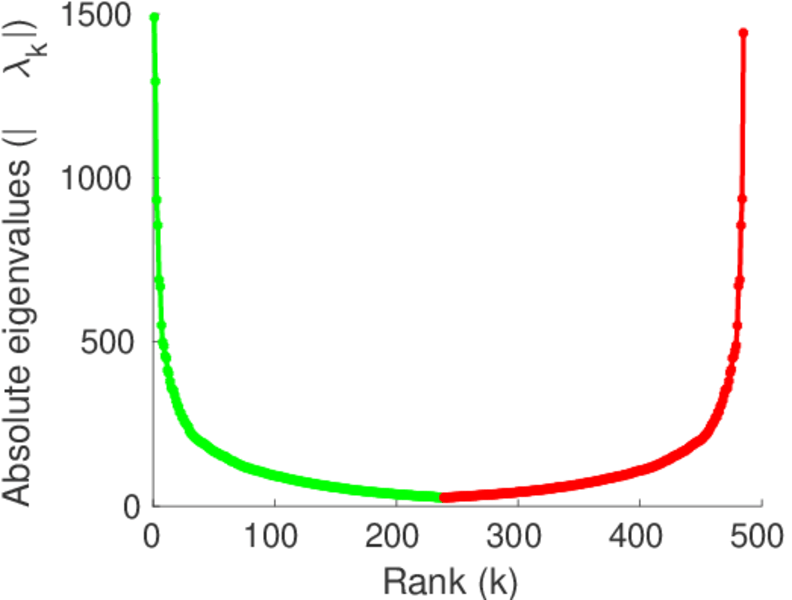
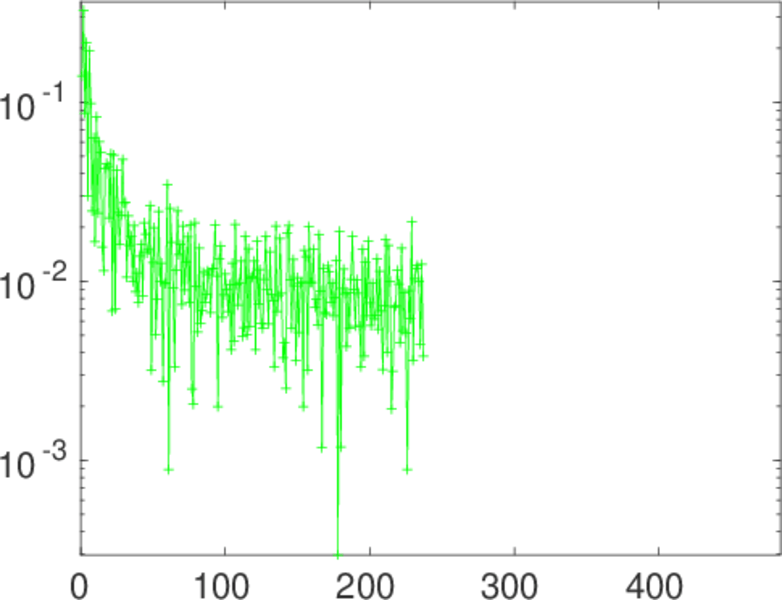
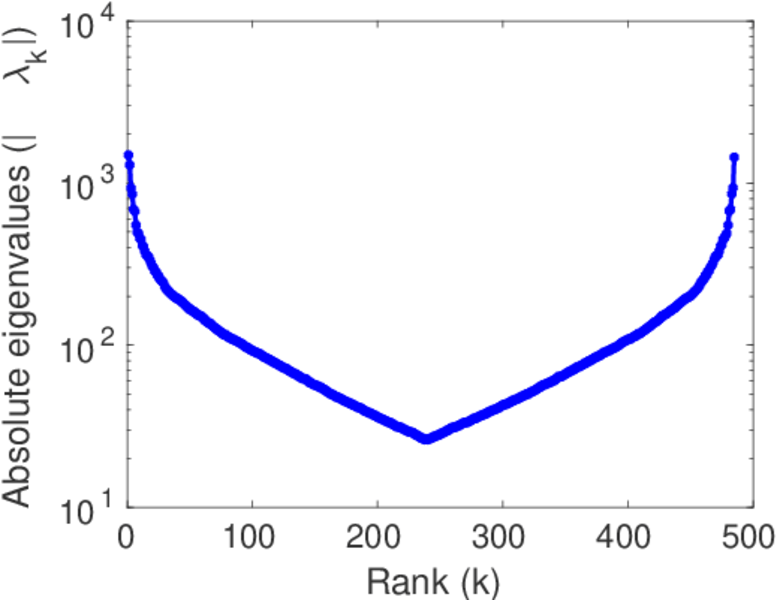
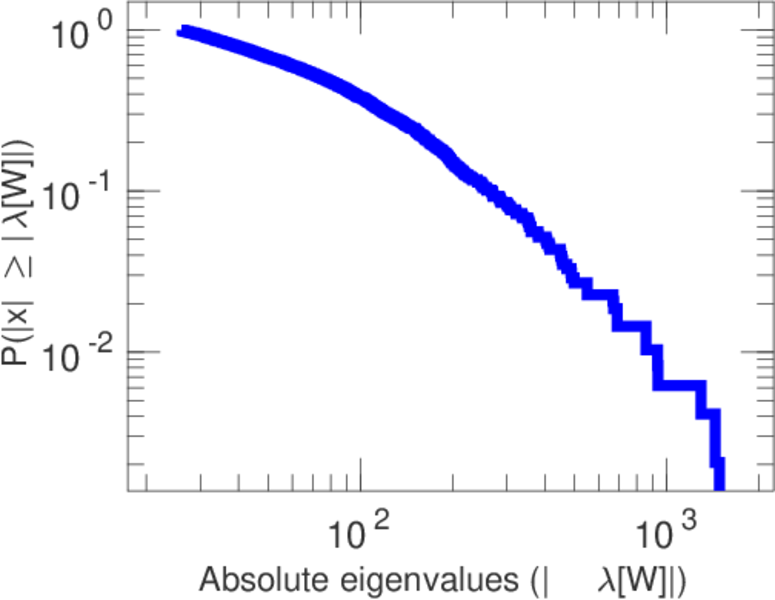
Plots


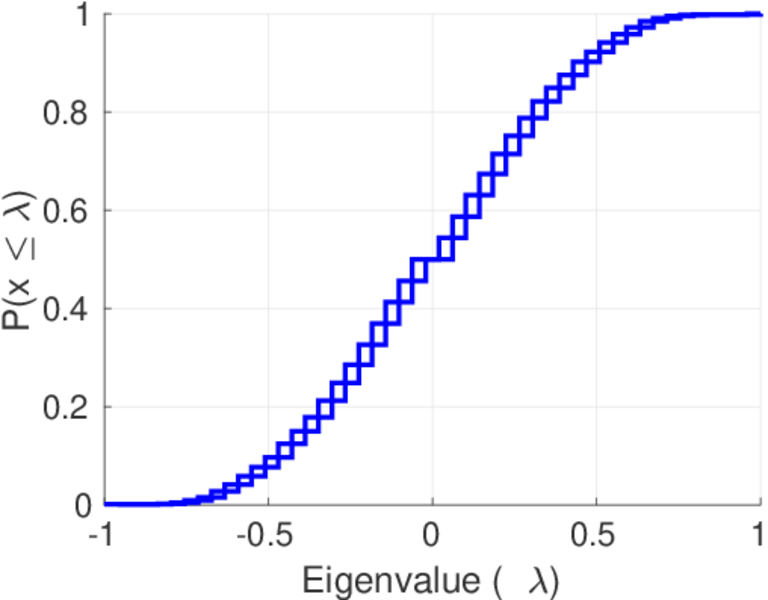
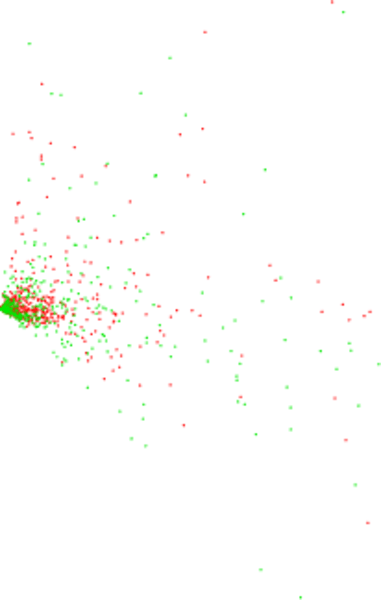
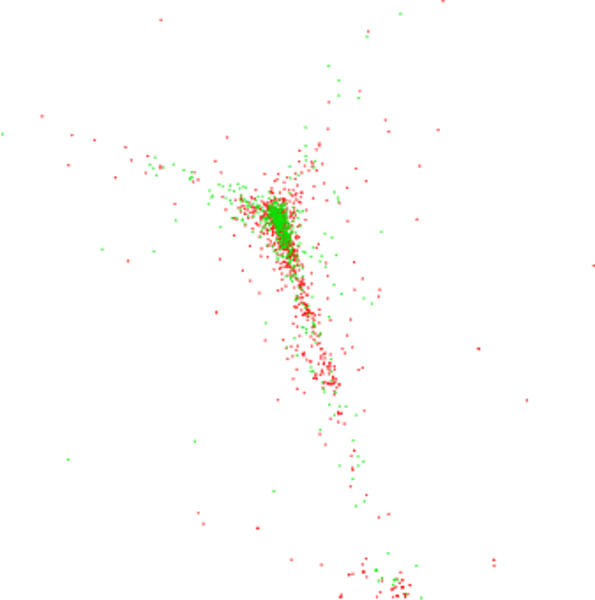
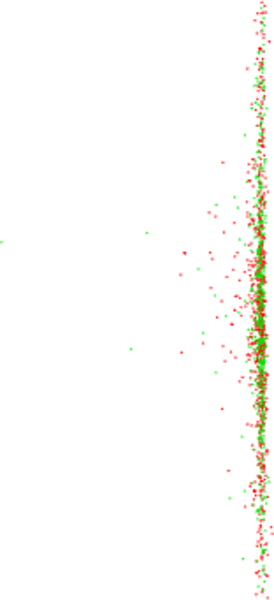
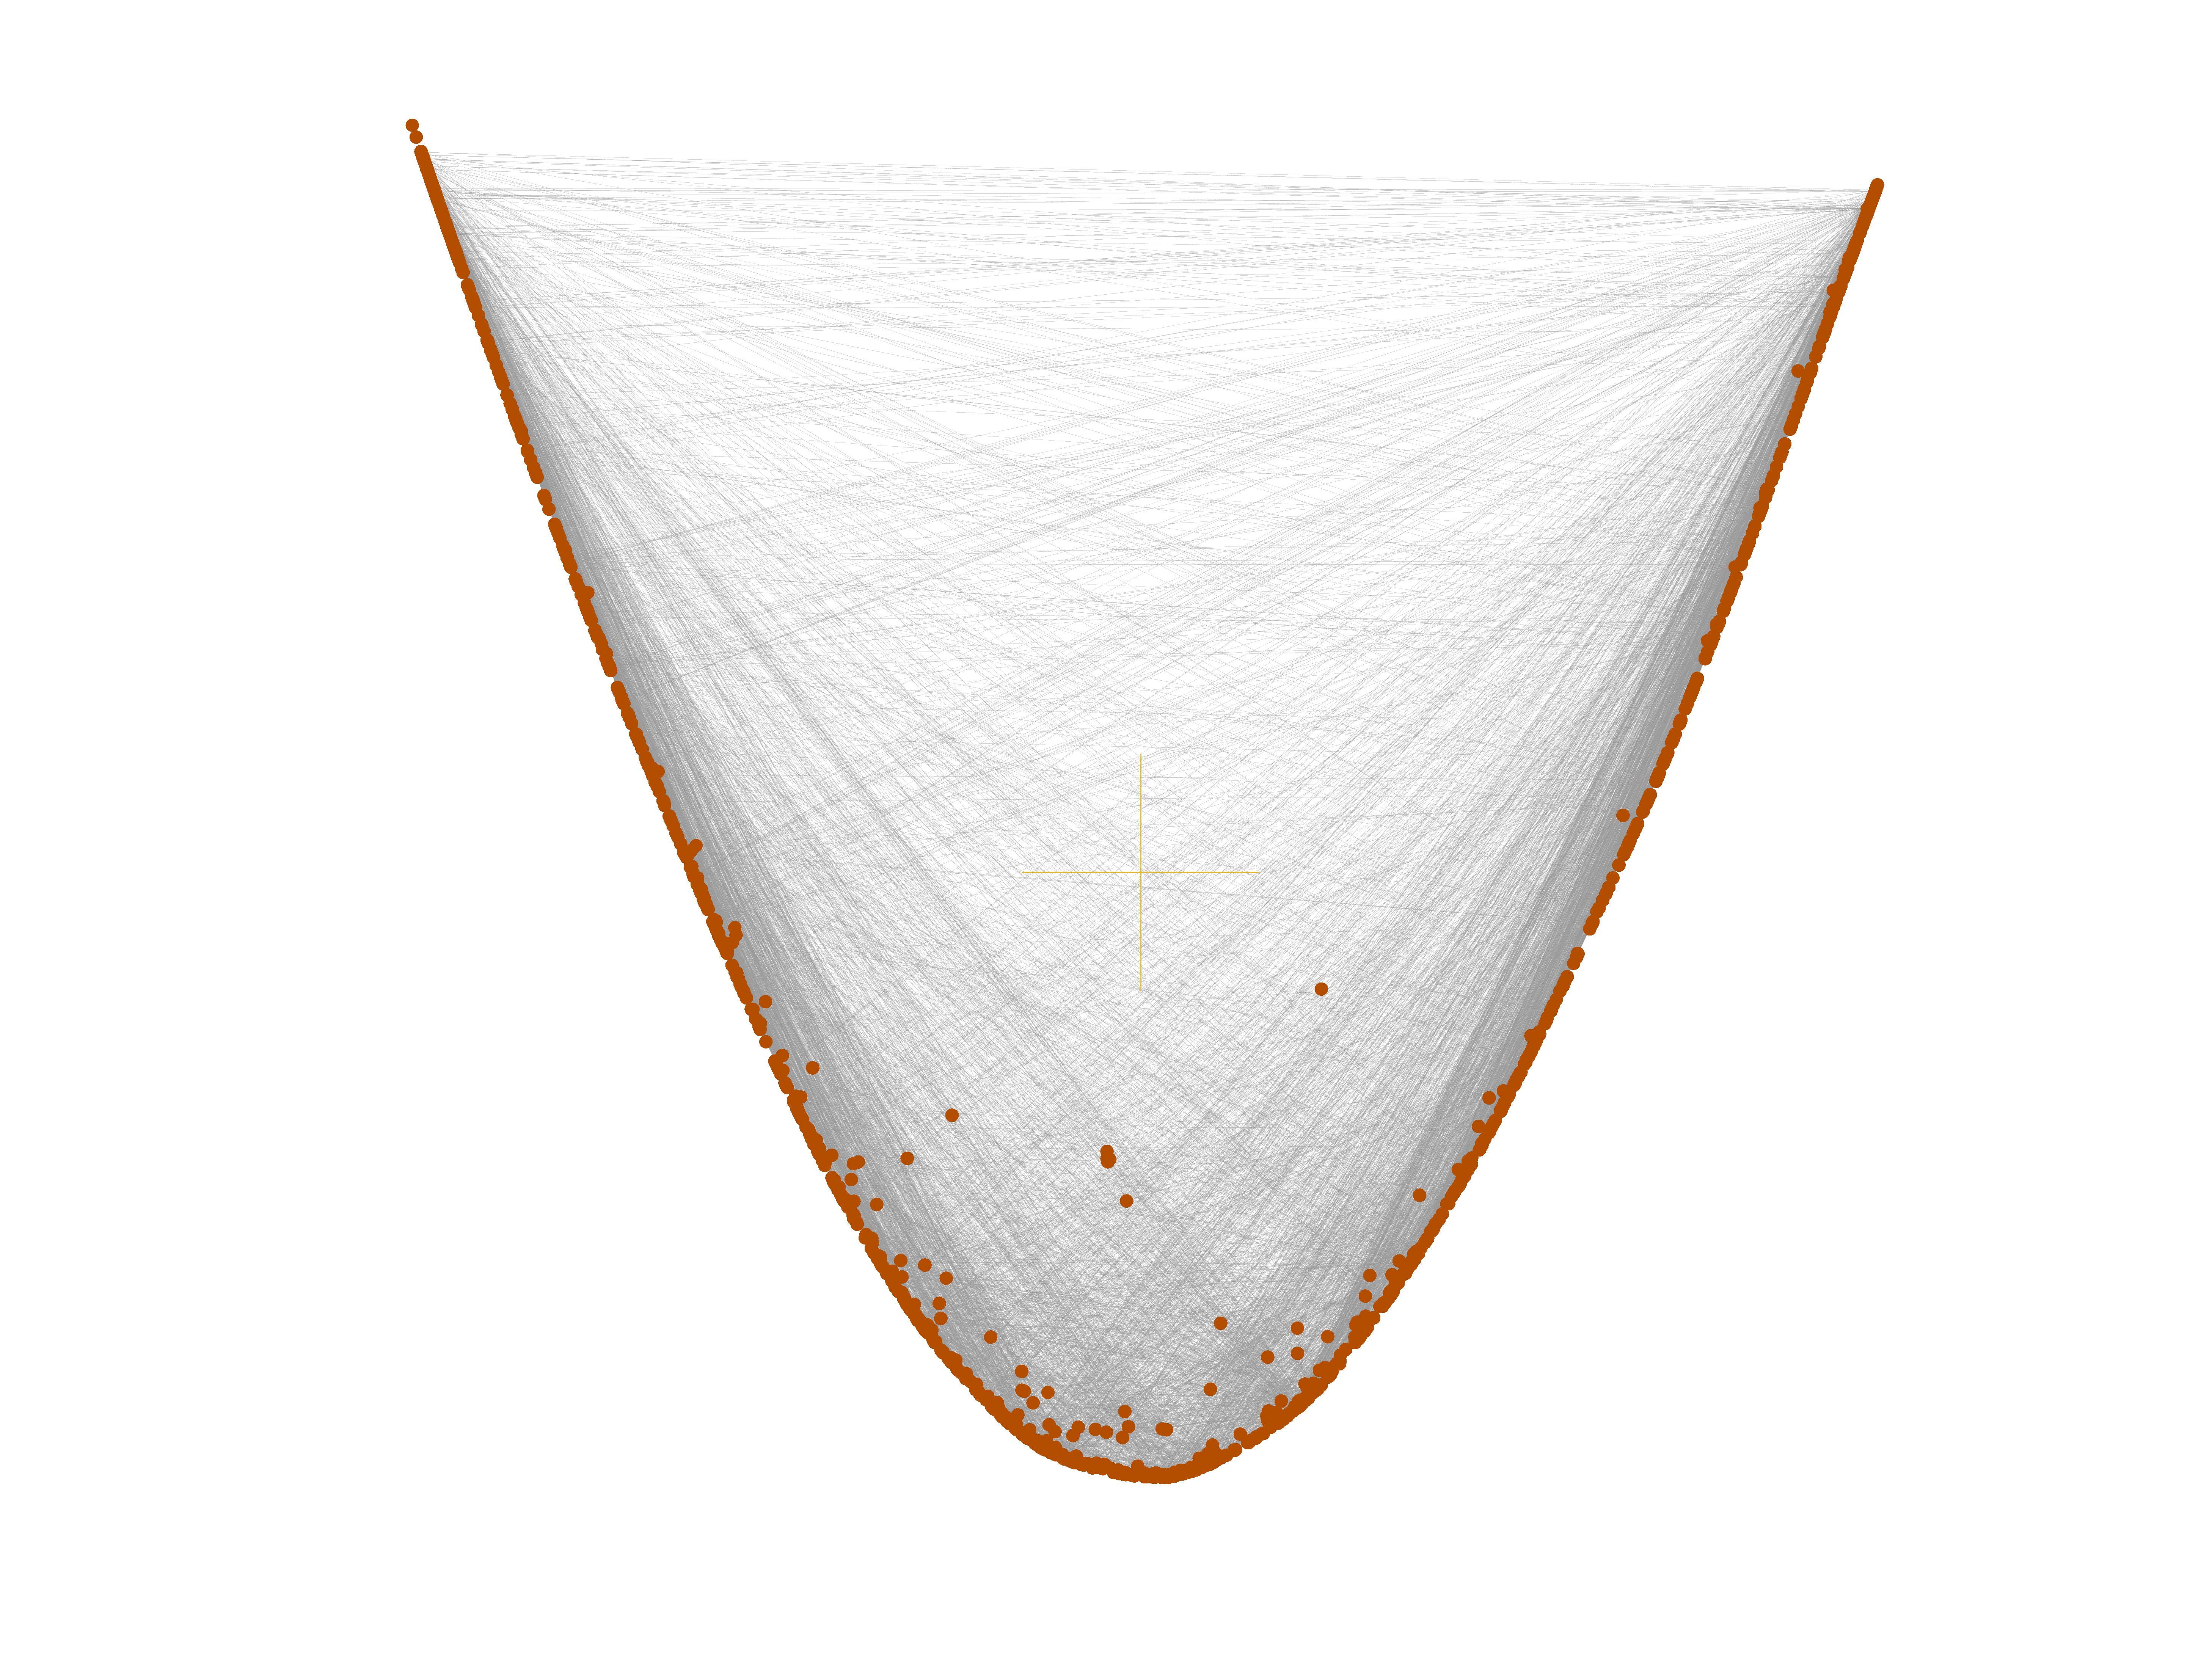
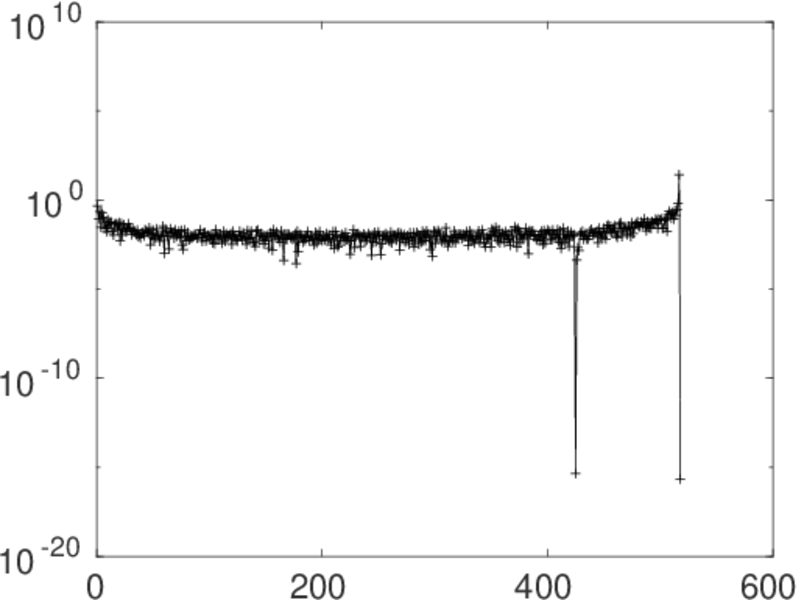
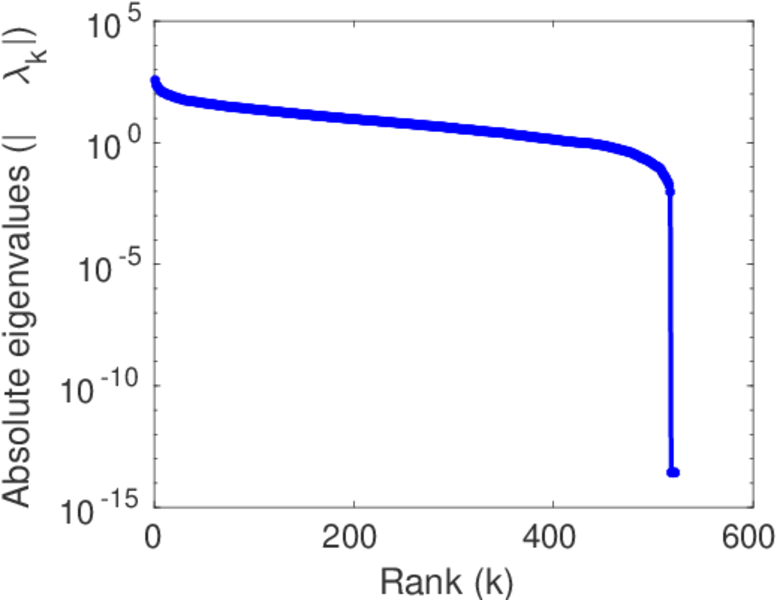
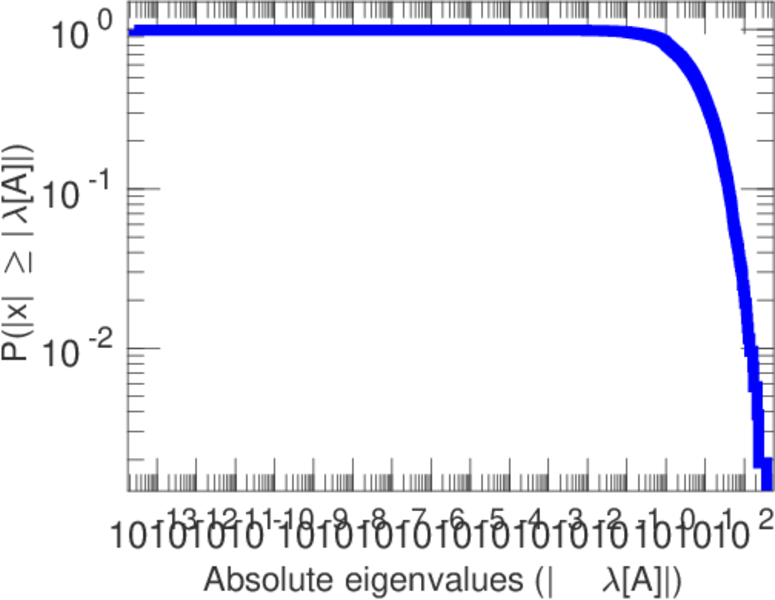
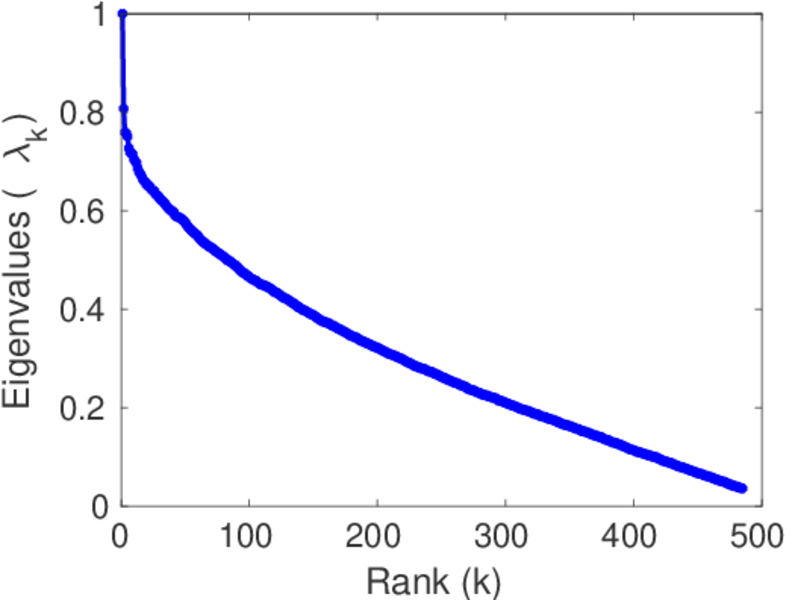
Matrix decompositions plots


Downloads
References
|
[1]
|
Jérôme Kunegis.
KONECT – The Koblenz Network Collection.
In Proc. Int. Conf. on World Wide Web Companion, pages
1343–1350, 2013.
[ http ]
|
|
[2]
|
Tore Opsahl and Pietro Panzarasa.
Triadic closure in two-mode networks: Redefining the global and local
clustering coefficients.
Soc. Netw., 34, 2011.
|
 KONECT ‣ Networks ‣
Buy Me a Coffee
KONECT ‣ Networks ‣
Buy Me a Coffee