Prosper loans
This network represents loans between members of the peer-to-peer lending
network at Prosper.com. The online marketplace allows borrowers to post
listings requesting loans. Lenders bid on these listings, which become loans
if the amount requested is fully funded by the lenders. The network is directed
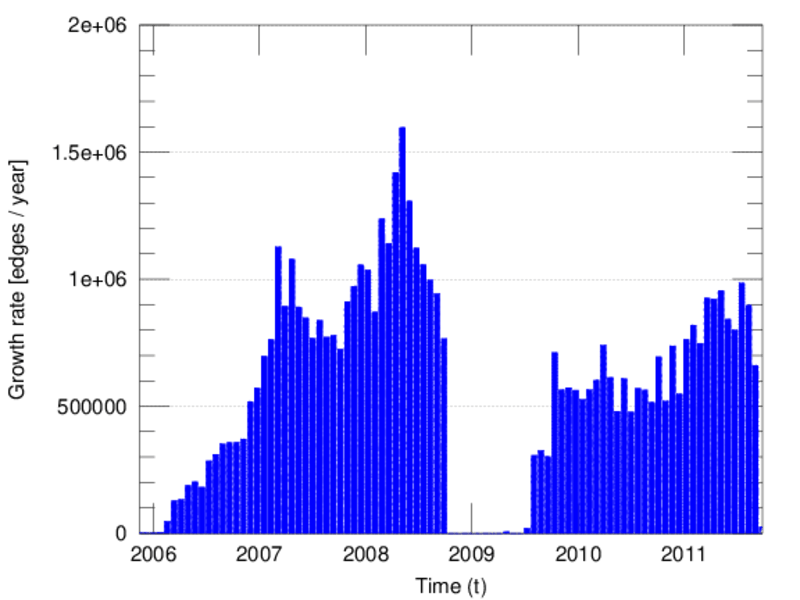
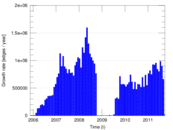
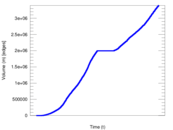
from lender to borrower. Each edge also contains the time at which the loan
originated, the amount requested, the loan status, the credit grade or rating
of the borrower, the lender rate and the borrower rate.
Metadata
Statistics
| Size | n = | 89,269
|
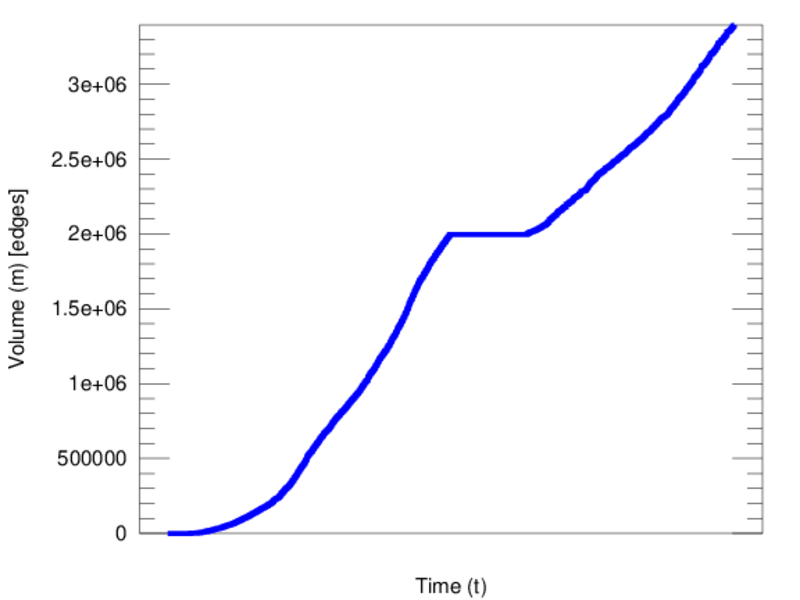
| Volume | m = | 3,394,979
|
| Unique edge count | m̿ = | 3,330,225
|
| Loop count | l = | 0
|
| Wedge count | s = | 1,112,425,463
|
| Claw count | z = | 455,534,068,547
|
| Cross count | x = | 307,514,582,925,604
|
| Triangle count | t = | 1,158,669
|
| Square count | q = | 3,930,622,348
|
| 4-Tour count | T4 = | 35,901,340,680
|
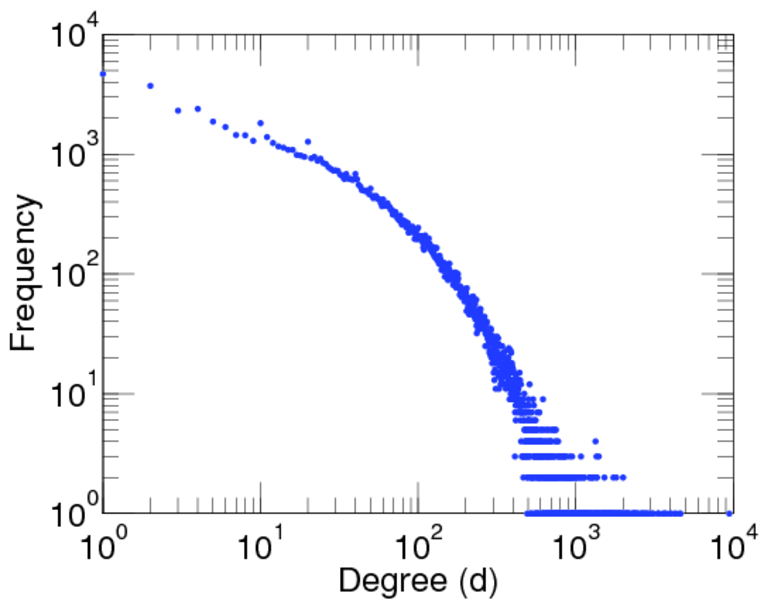
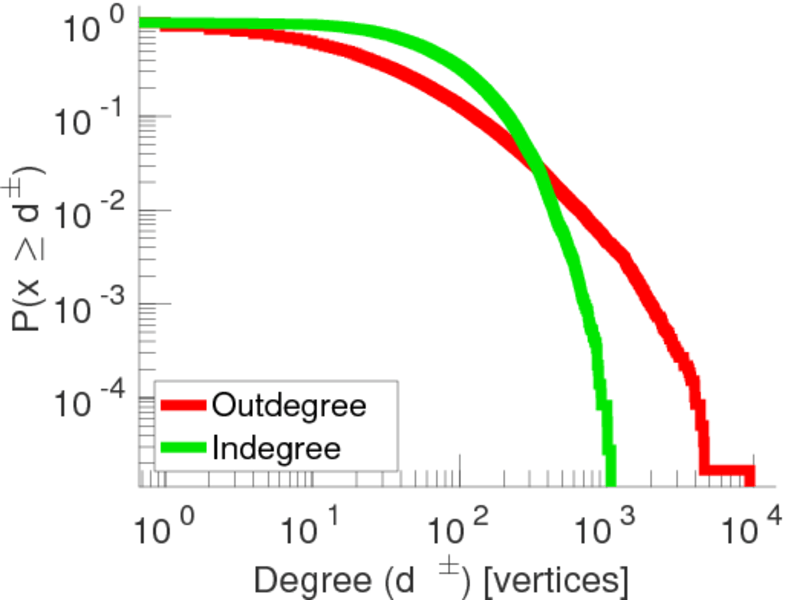
| Maximum degree | dmax = | 9,436
|
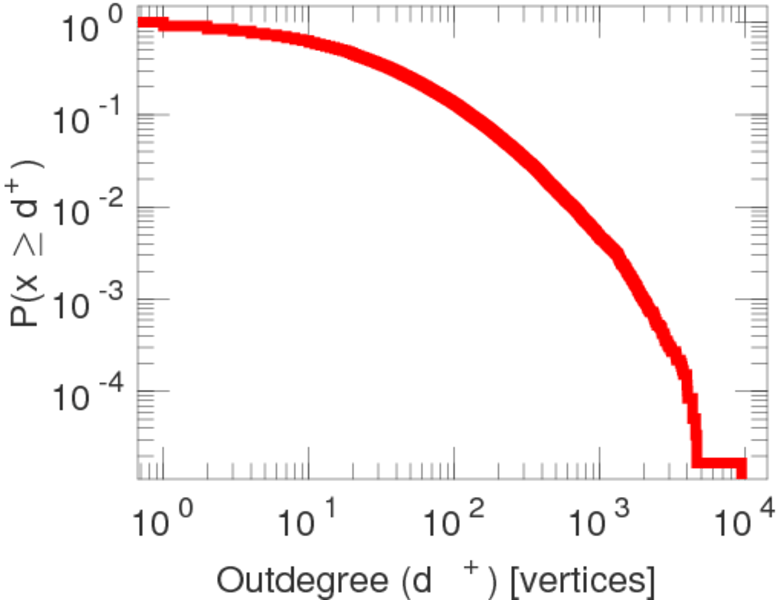
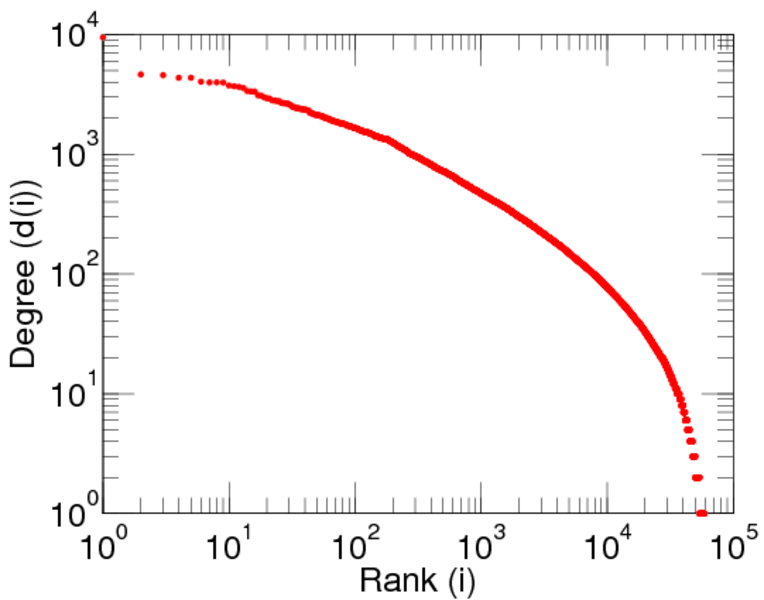
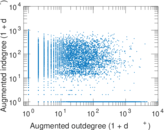
| Maximum outdegree | d+max = | 9,436
|
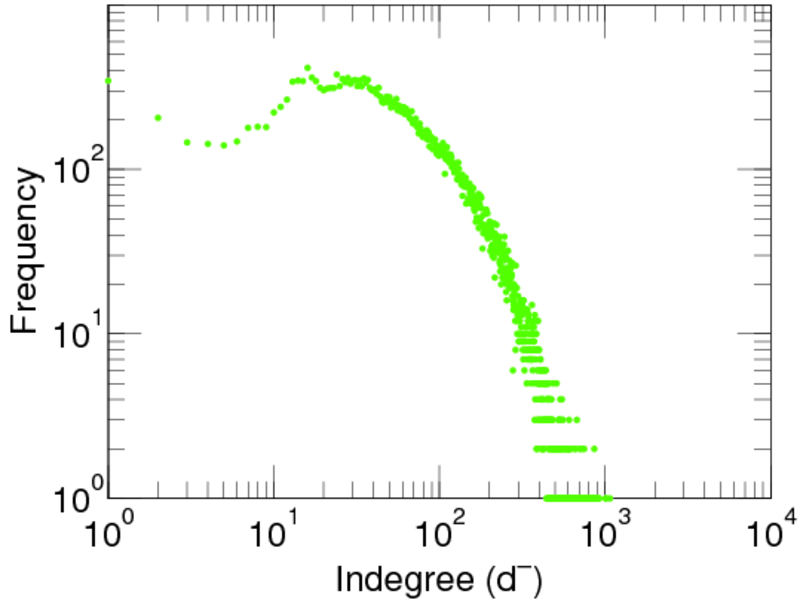
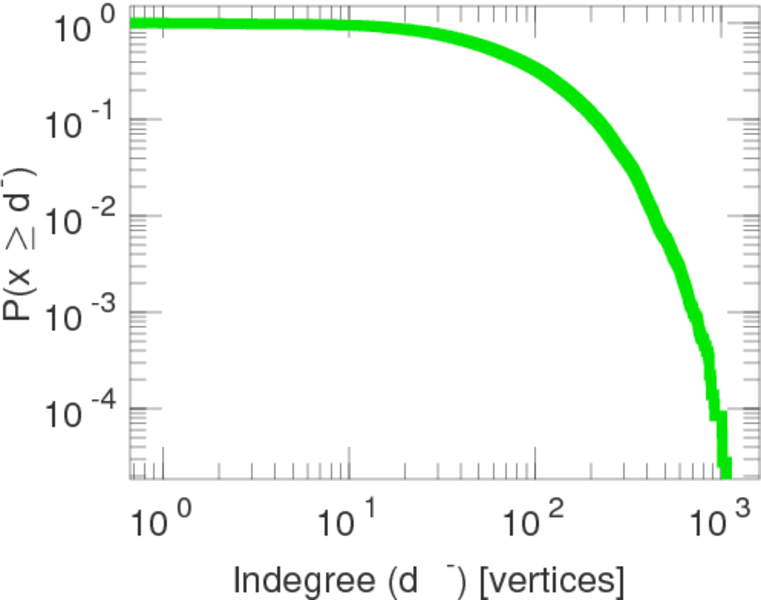
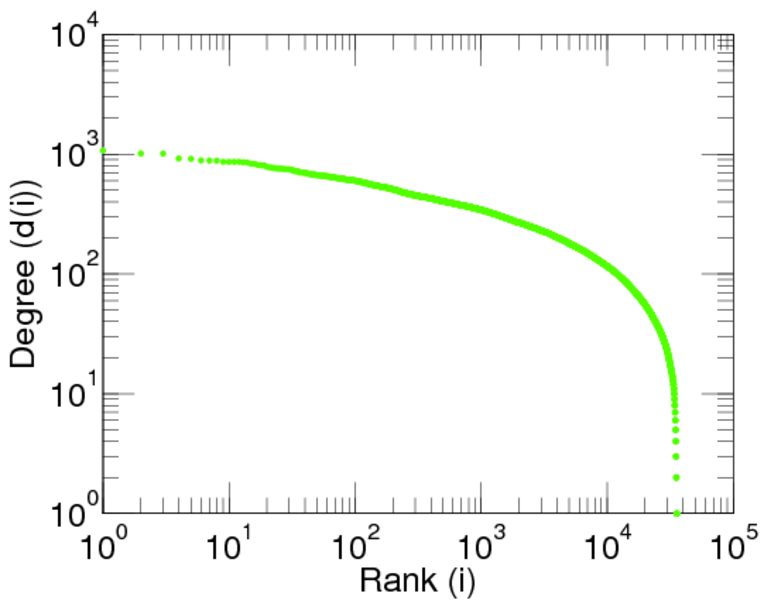
| Maximum indegree | d−max = | 1,071
|
| Average degree | d = | 76.061 8
|
| Fill | p = | 0.000 417 905
|
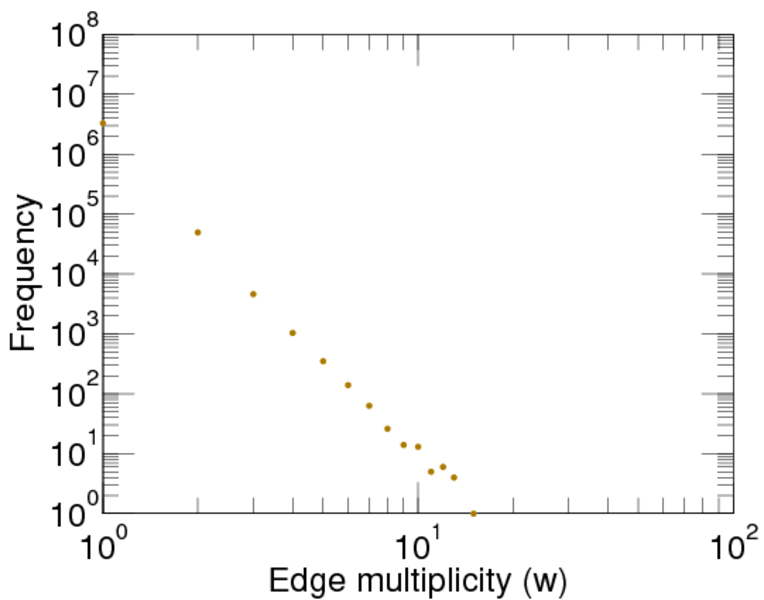
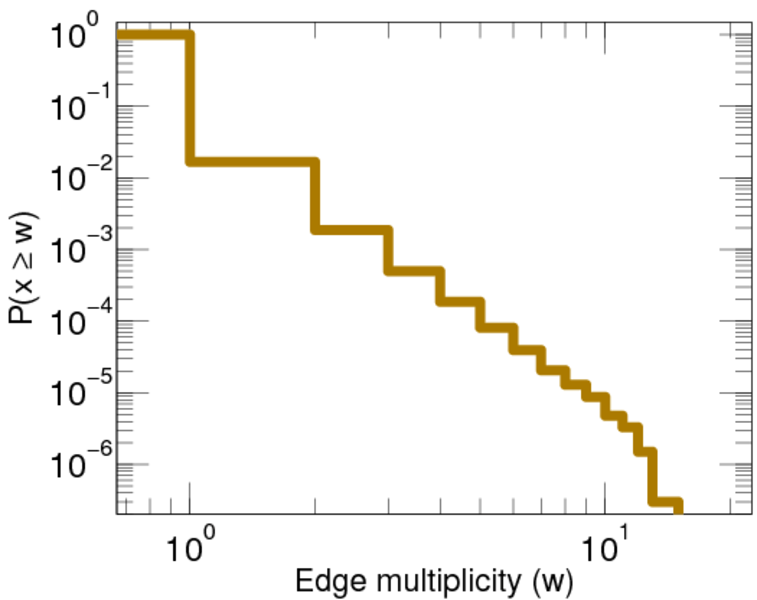
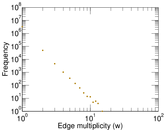
| Average edge multiplicity | m̃ = | 1.019 44
|
| Size of LCC | N = | 89,171
|
| Size of LSCC | Ns = | 3,513
|
| Relative size of LSCC | Nrs = | 0.039 353 0
|
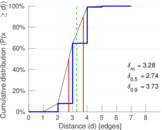
| Diameter | δ = | 8
|
| 50-Percentile effective diameter | δ0.5 = | 2.740 25
|
| 90-Percentile effective diameter | δ0.9 = | 3.734 94
|
| Median distance | δM = | 3
|
| Mean distance | δm = | 3.282 31
|
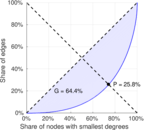
| Gini coefficient | G = | 0.644 290
|
| Balanced inequality ratio | P = | 0.258 008
|
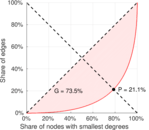
| Outdegree balanced inequality ratio | P+ = | 0.211 441
|
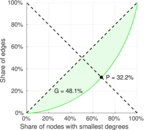
| Indegree balanced inequality ratio | P− = | 0.322 026
|
| Relative edge distribution entropy | Her = | 0.929 239
|
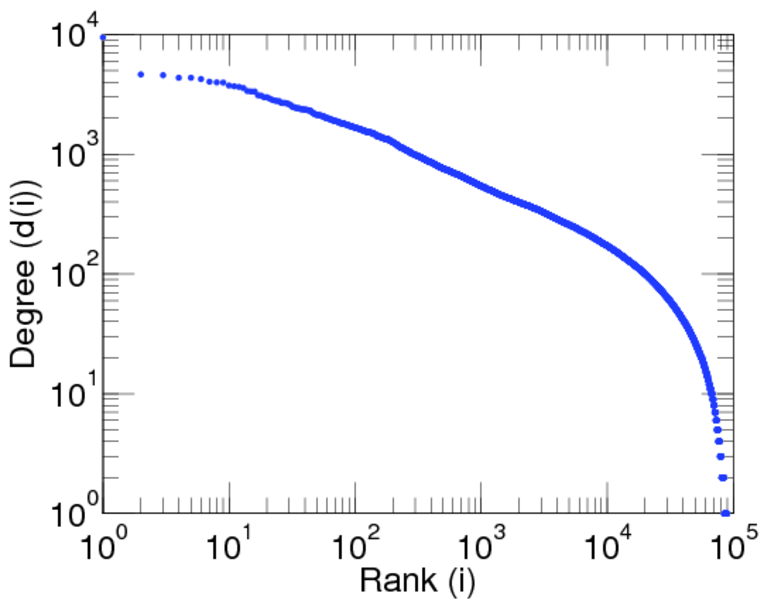
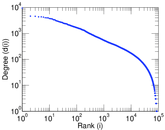
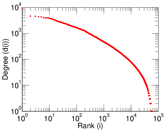
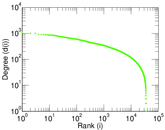
| Power law exponent | γ = | 1.300 63
|
| Tail power law exponent | γt = | 2.191 00
|
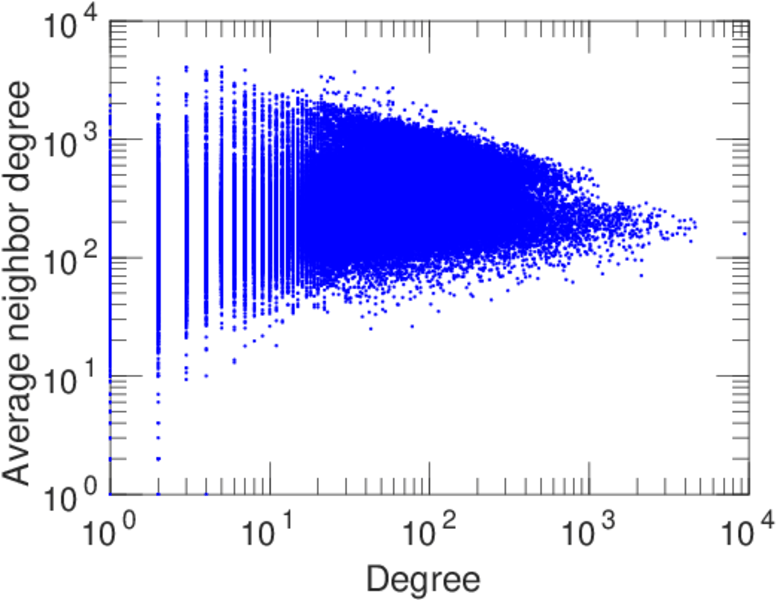
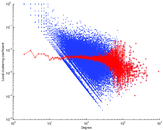
| Degree assortativity | ρ = | −0.078 326 1
|
| Degree assortativity p-value | pρ = | 0.000 00
|
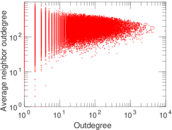
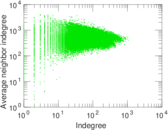
| In/outdegree correlation | ρ± = | −0.634 376
|
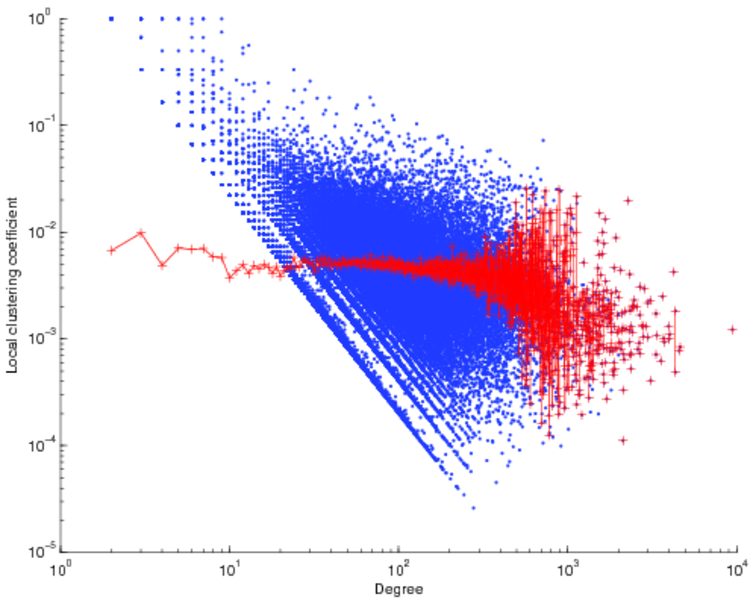
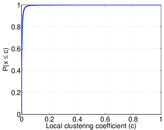
| Clustering coefficient | c = | 0.003 124 71
|
| Directed clustering coefficient | c± = | 0.033 515 0
|
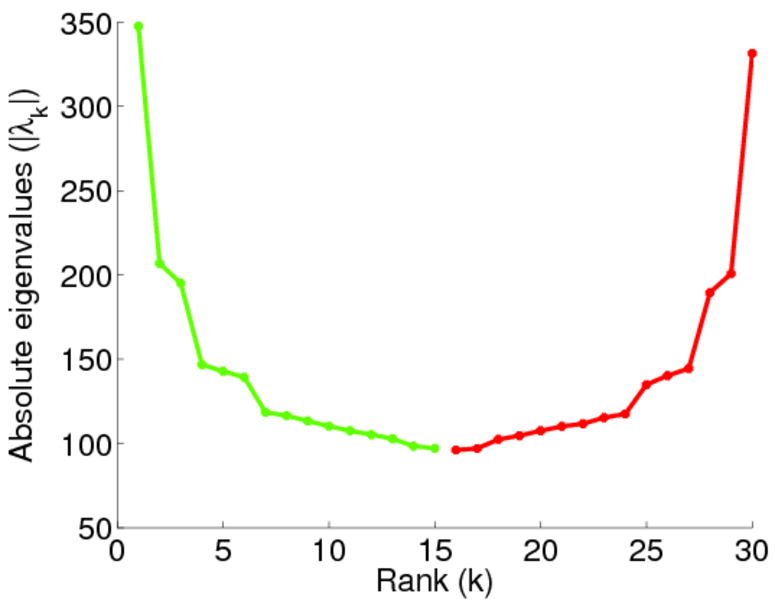
| Spectral norm | α = | 347.590
|
| Operator 2-norm | ν = | 339.390
|
| Cyclic eigenvalue | π = | 11.564 3
|
| Reciprocity | y = | 0.000 121 914
|
| Non-bipartivity | bA = | 0.046 288 4
|
| Normalized non-bipartivity | bN = | 0.058 899 8
|
| Algebraic non-bipartivity | χ = | 0.365 483
|
| Spectral bipartite frustration | bK = | 0.001 223 38
|
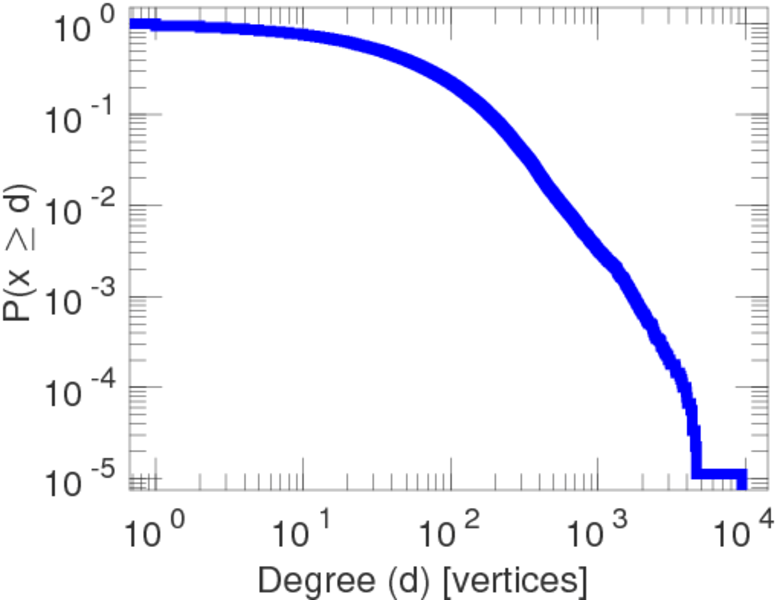
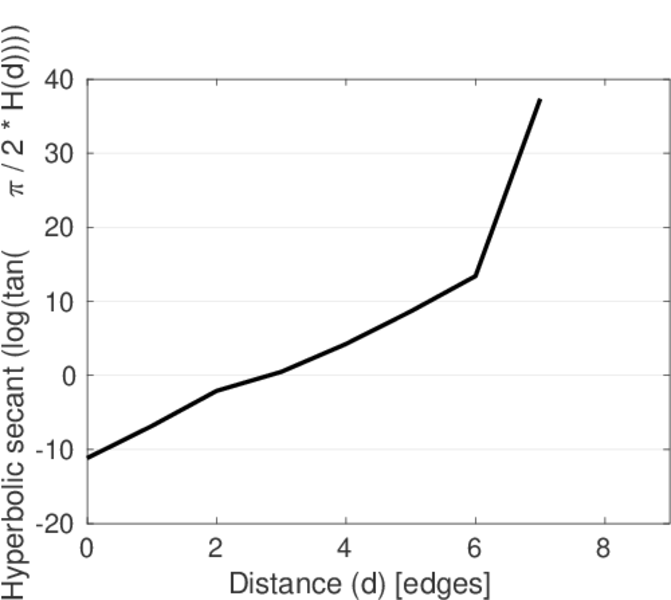
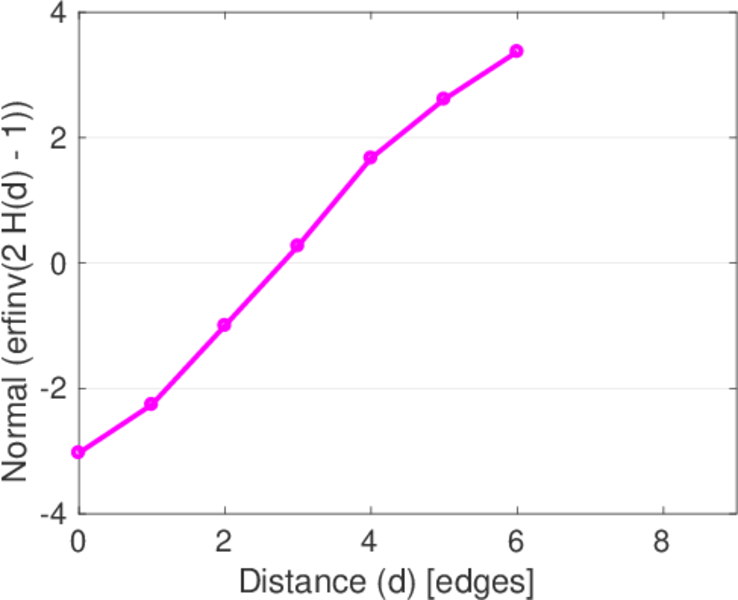
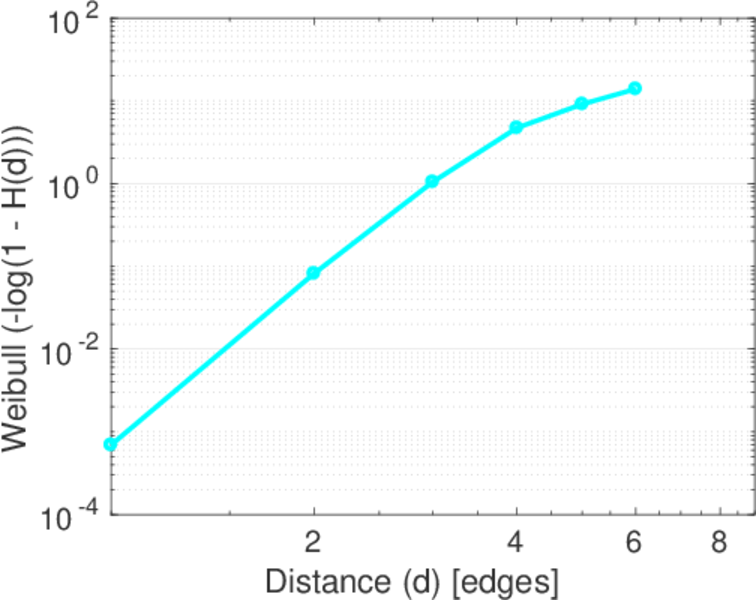
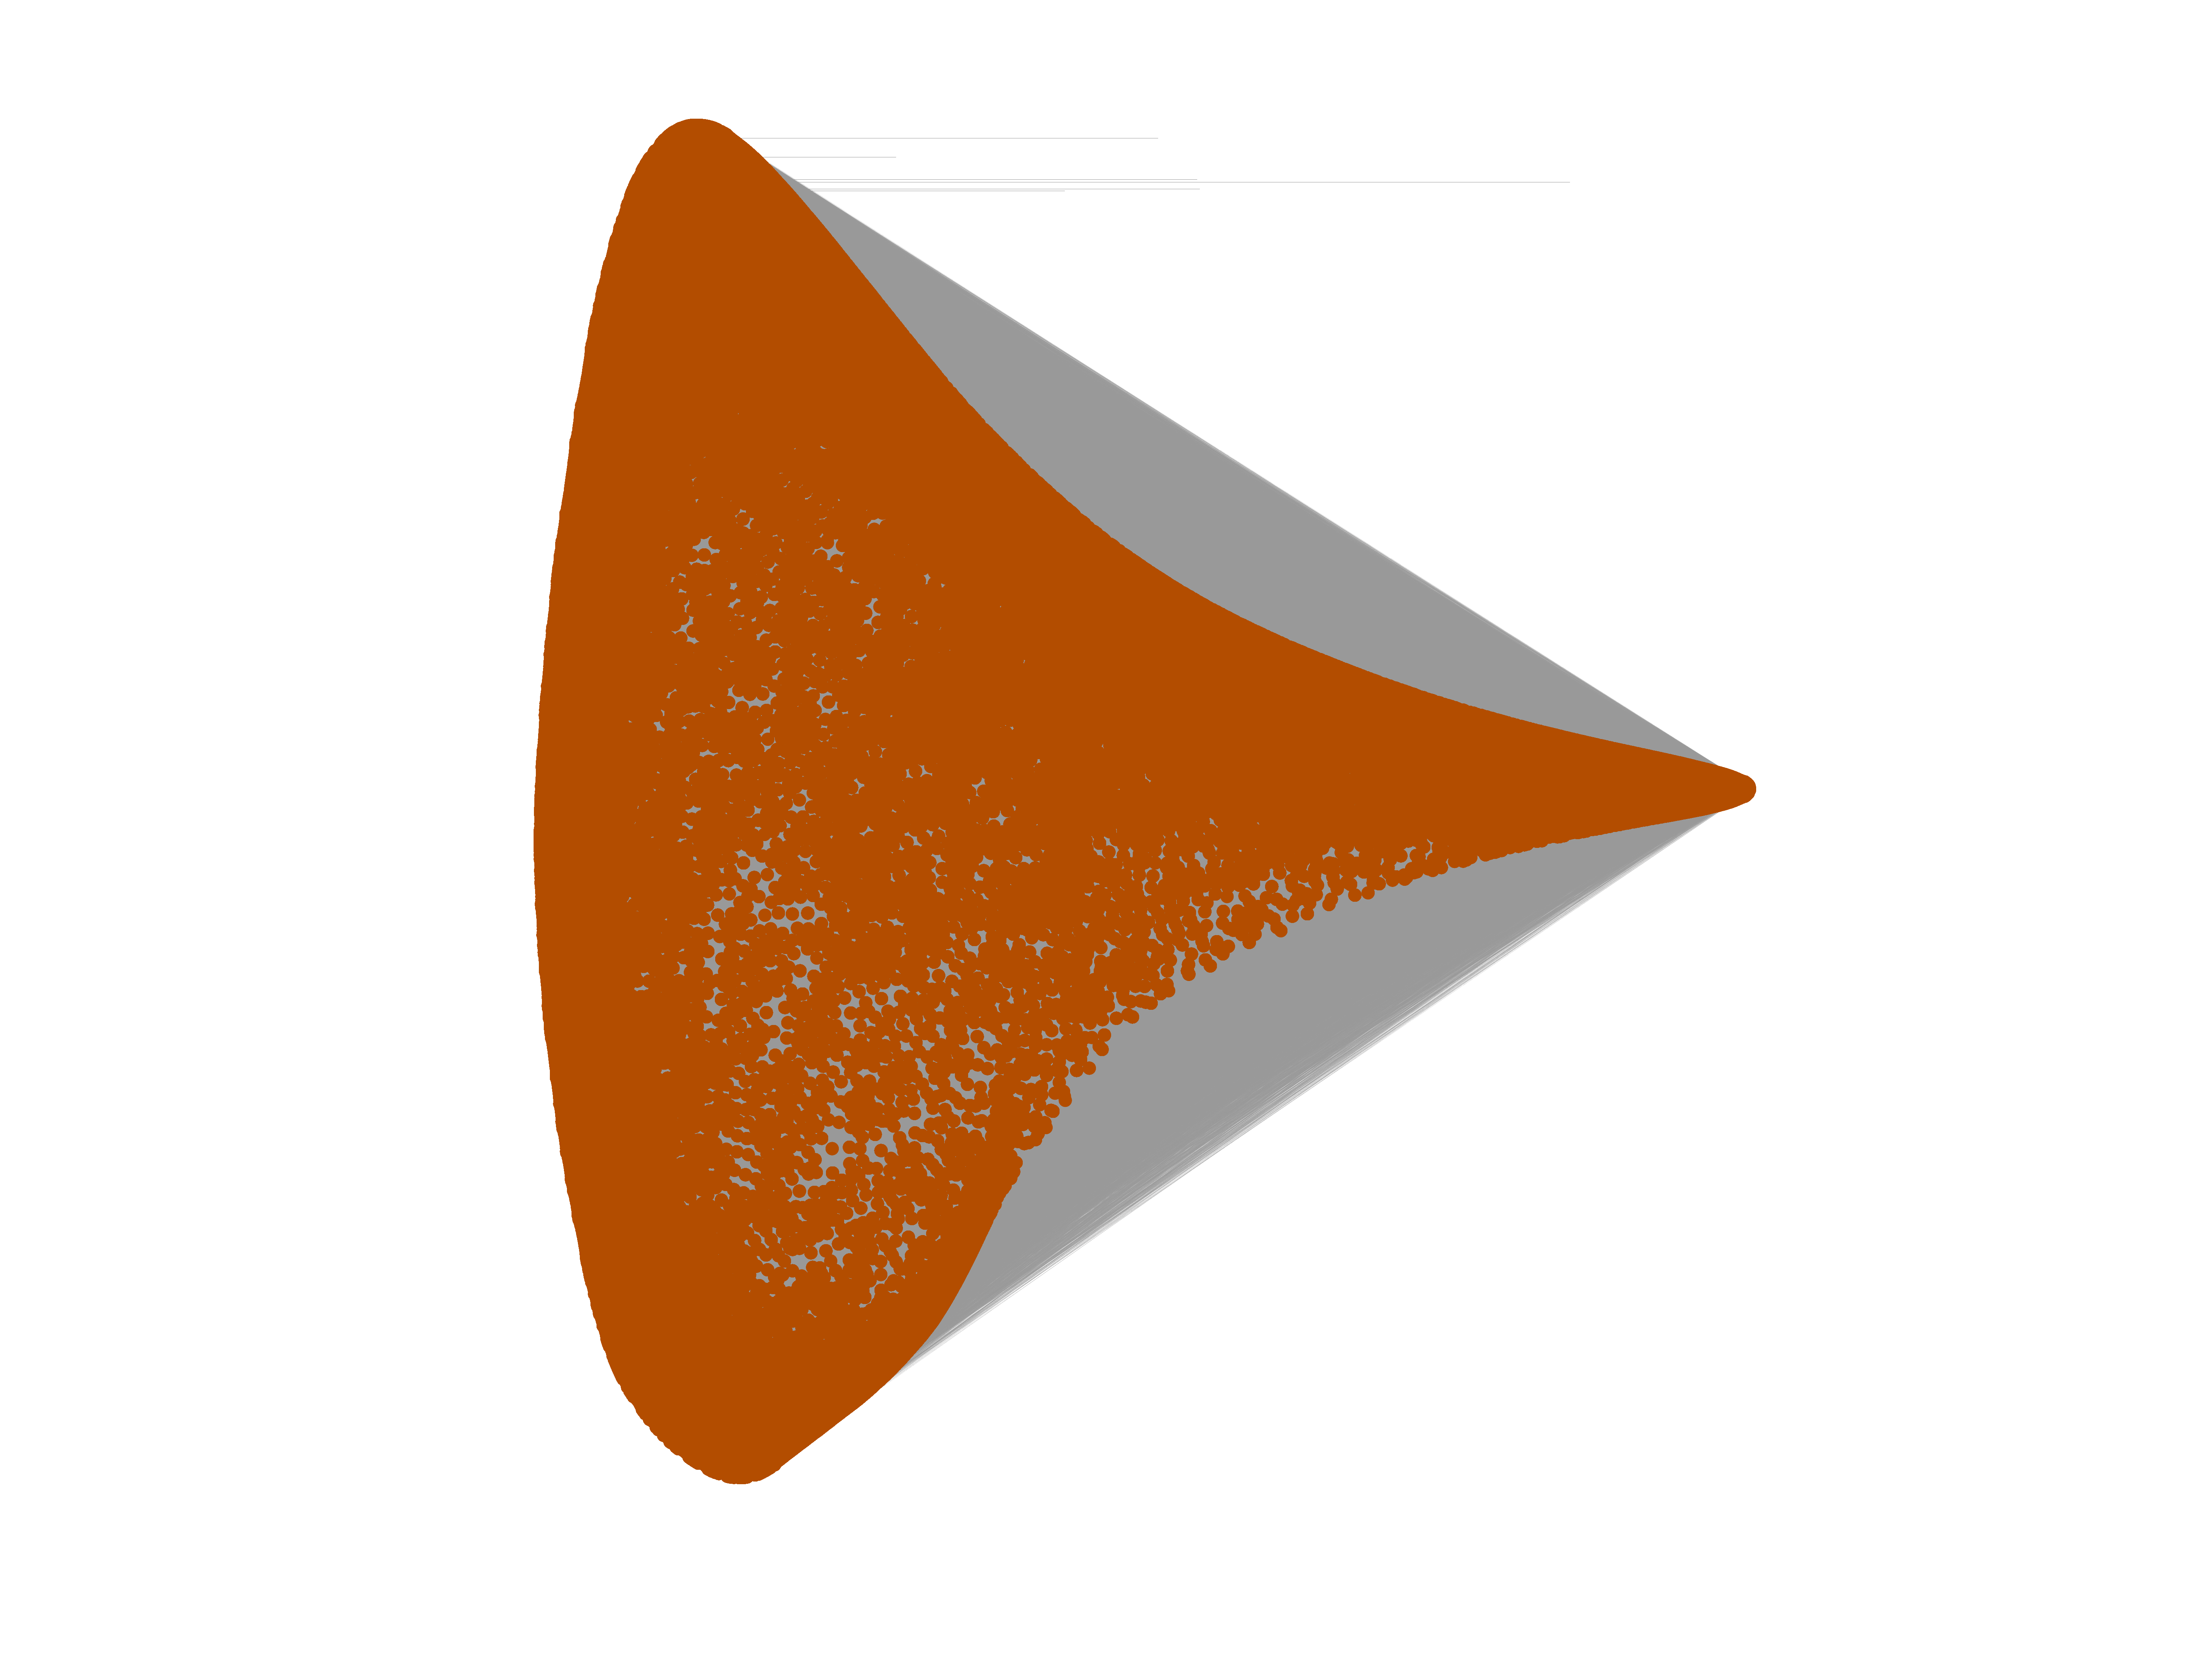
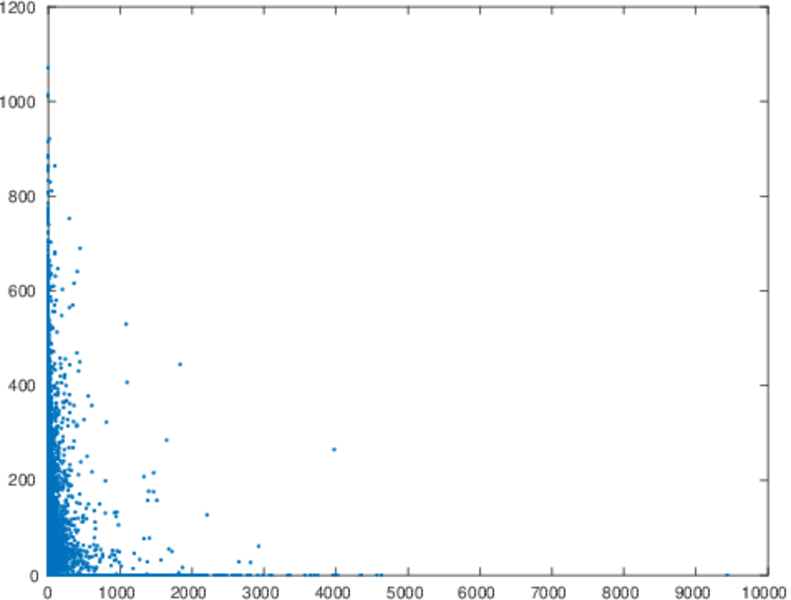
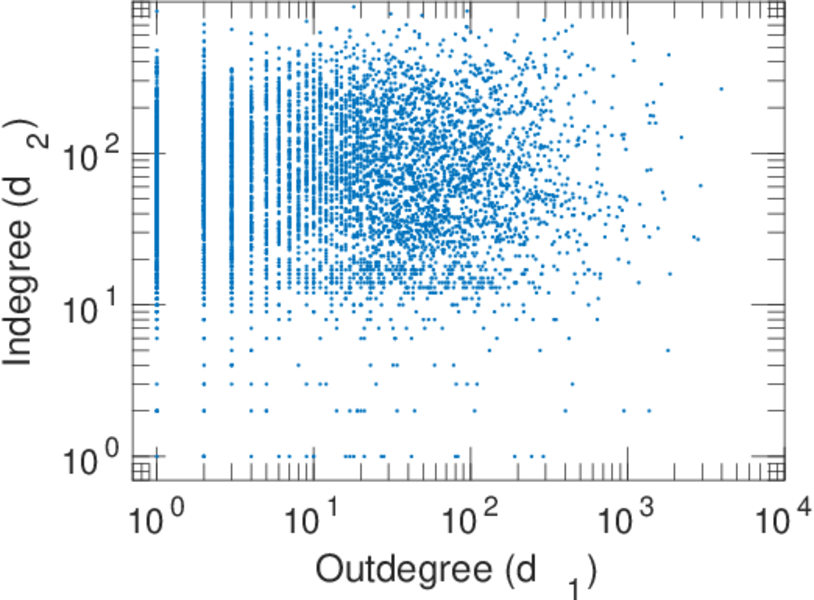
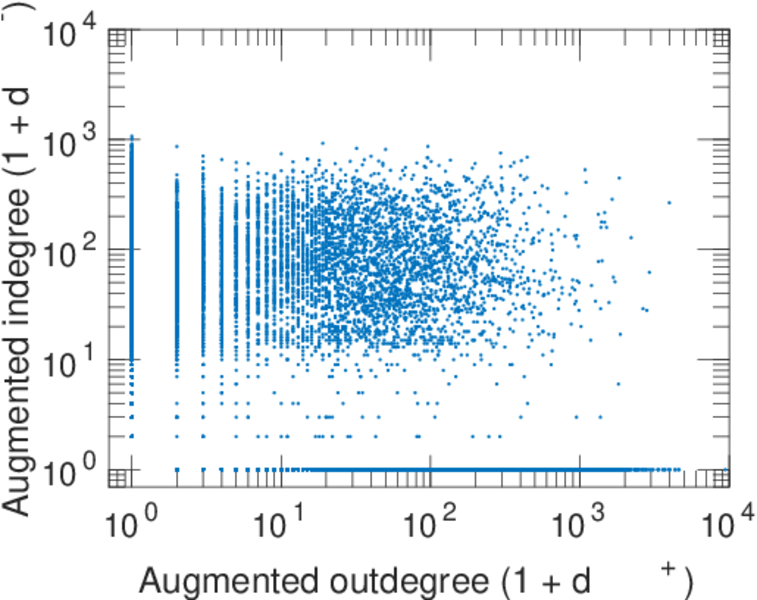
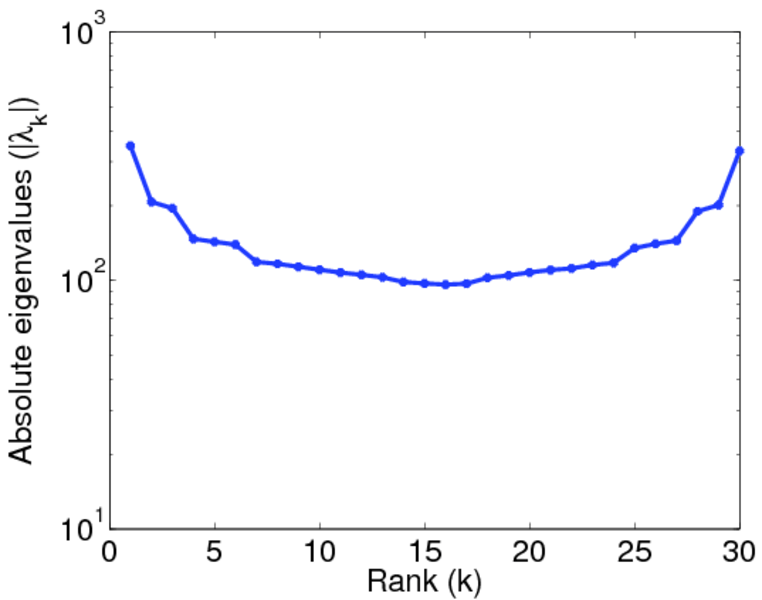
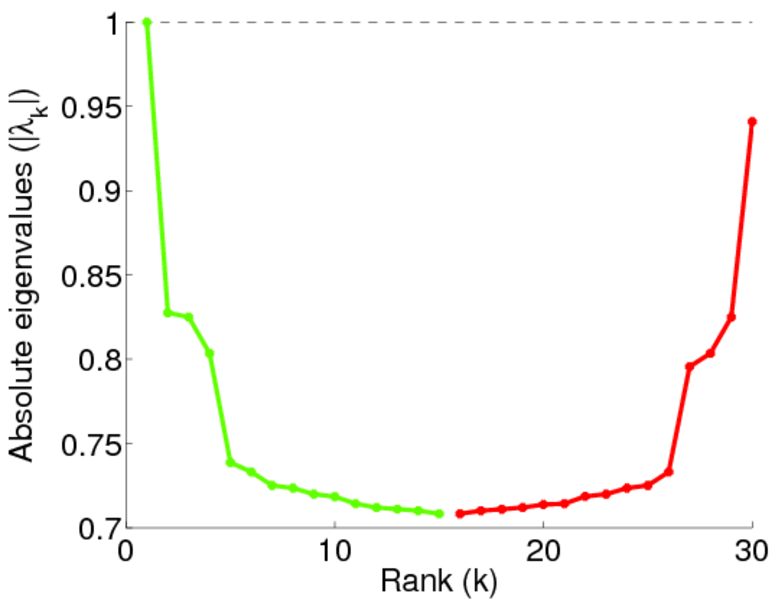
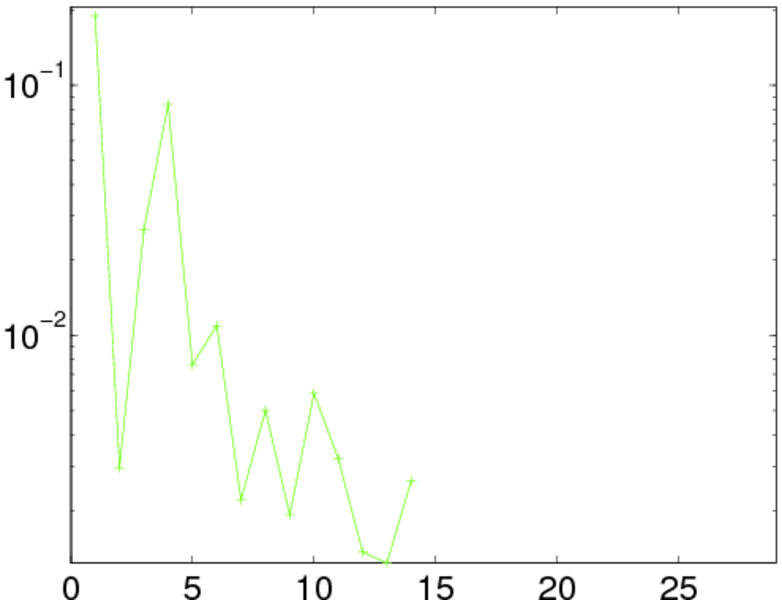
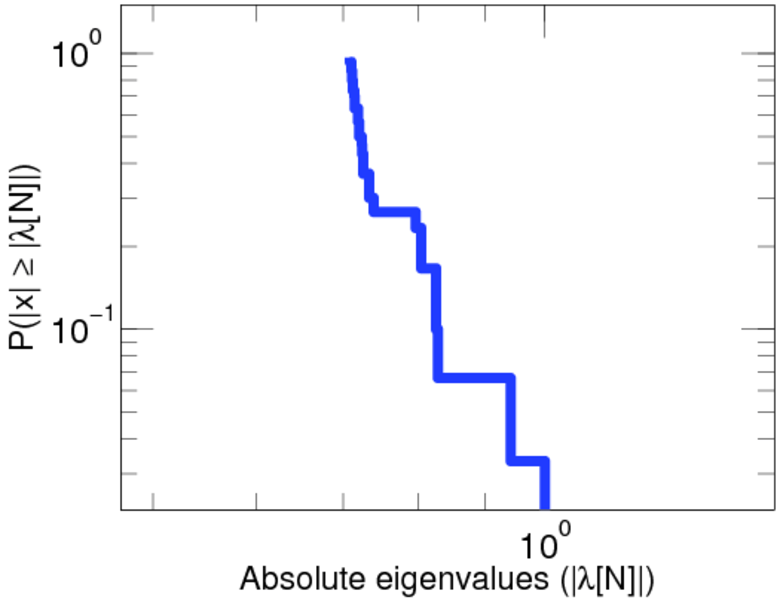
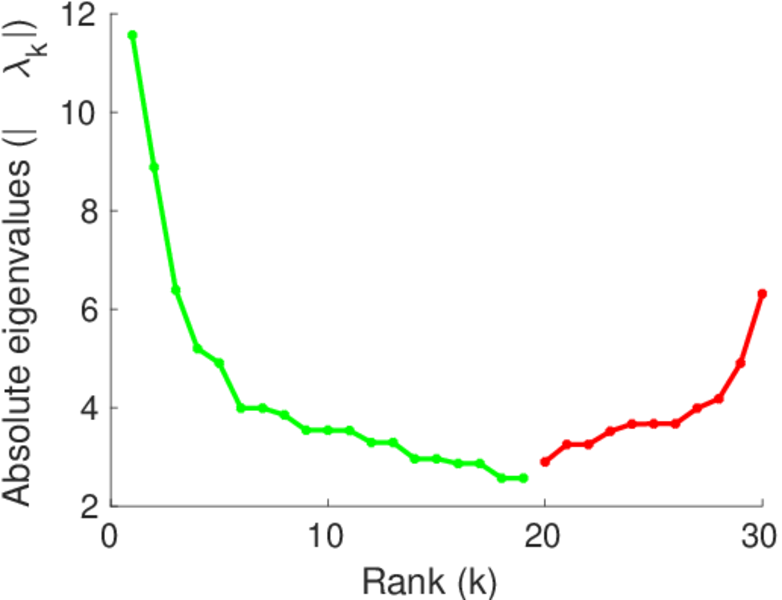
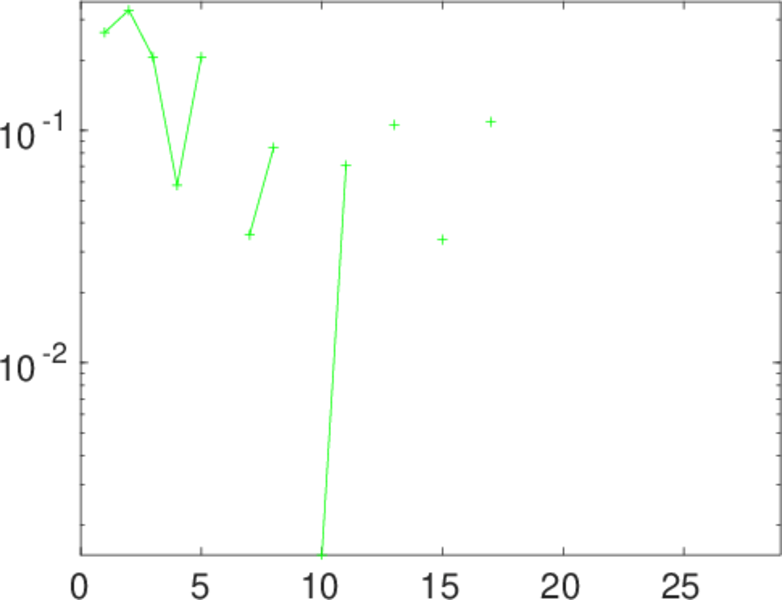
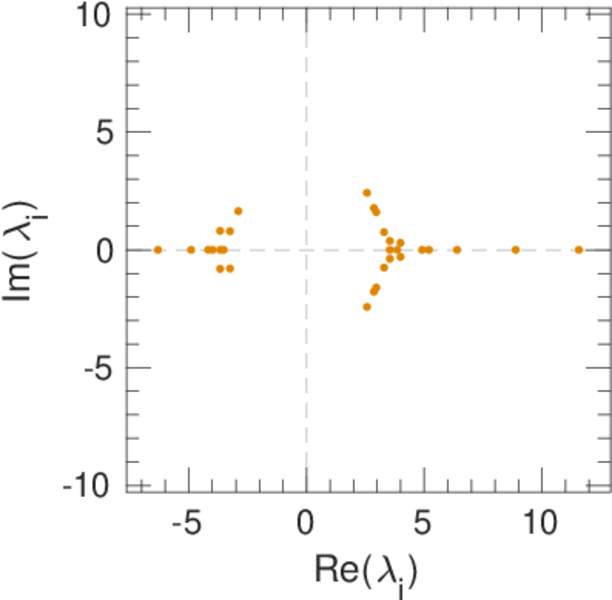
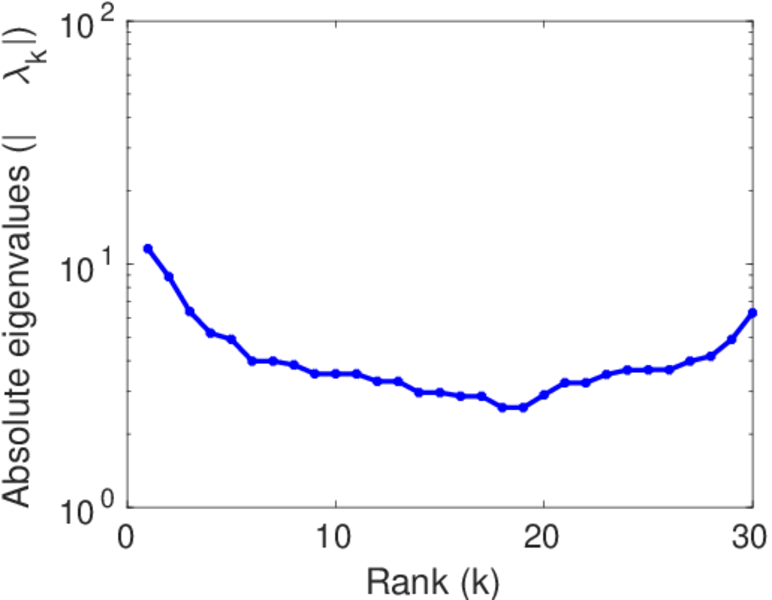
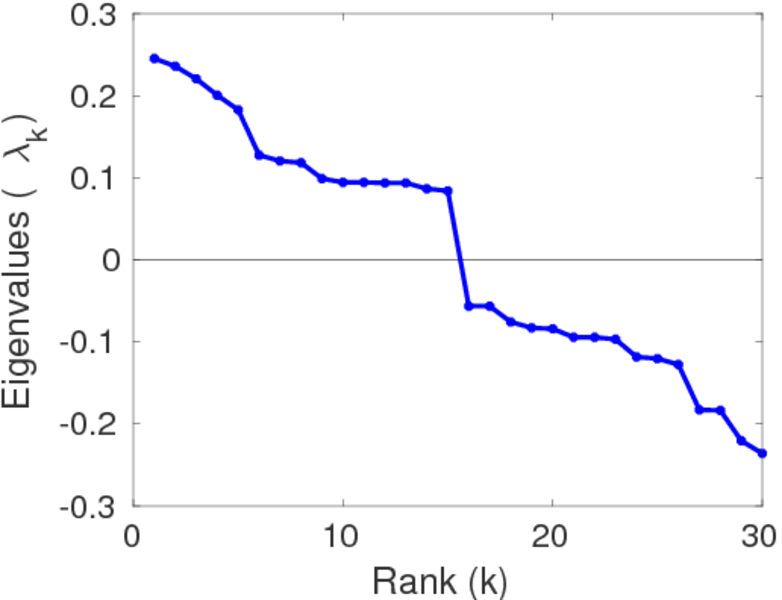
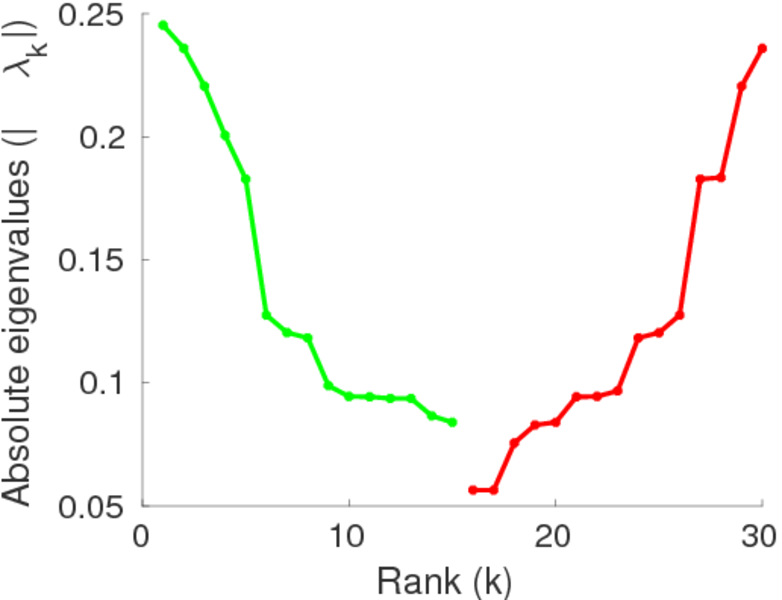
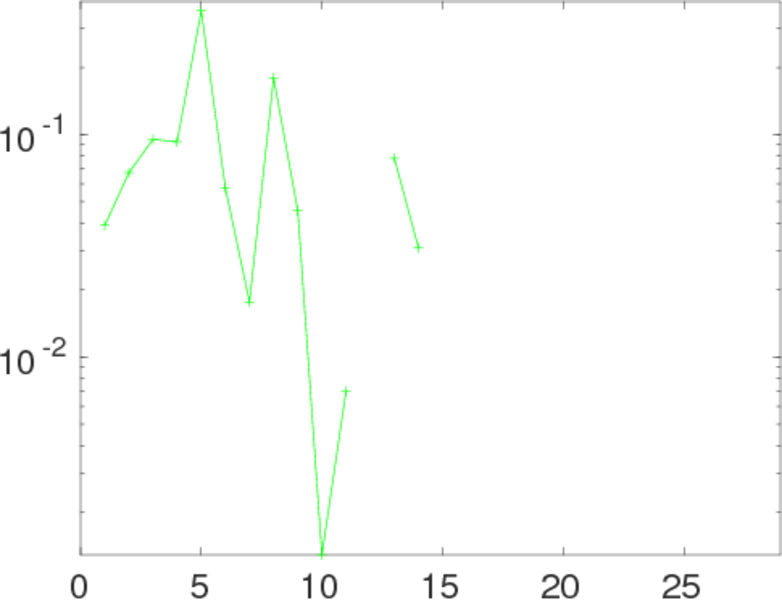
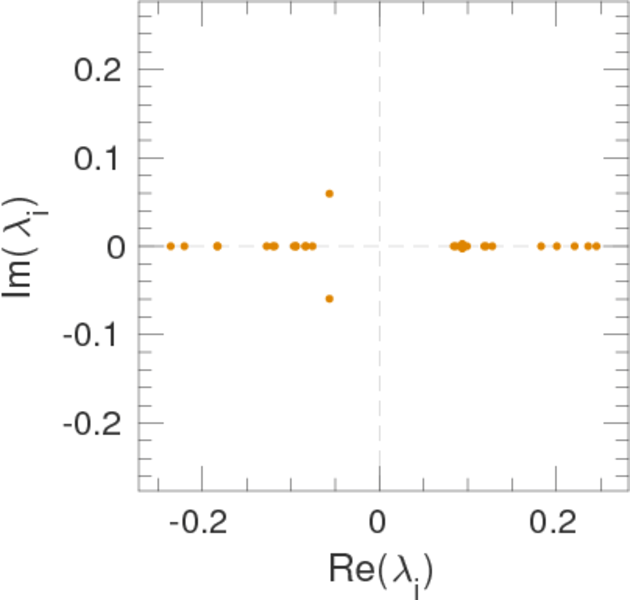
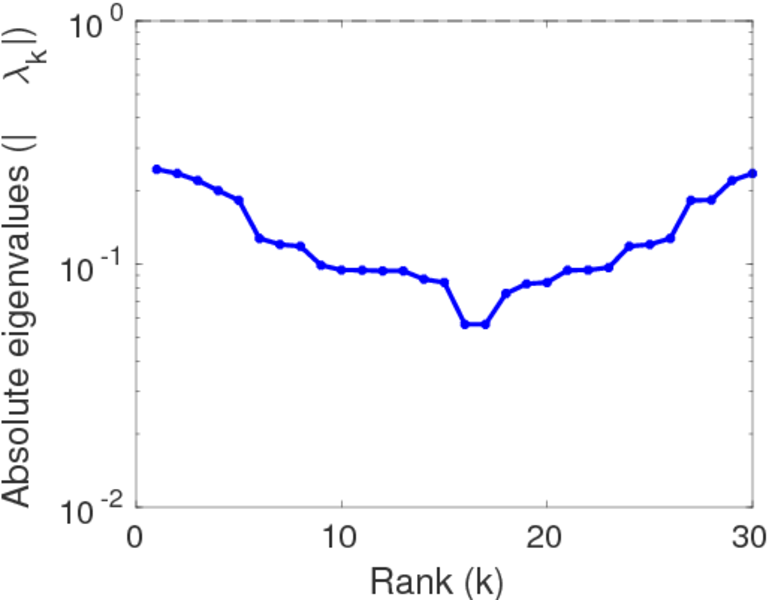
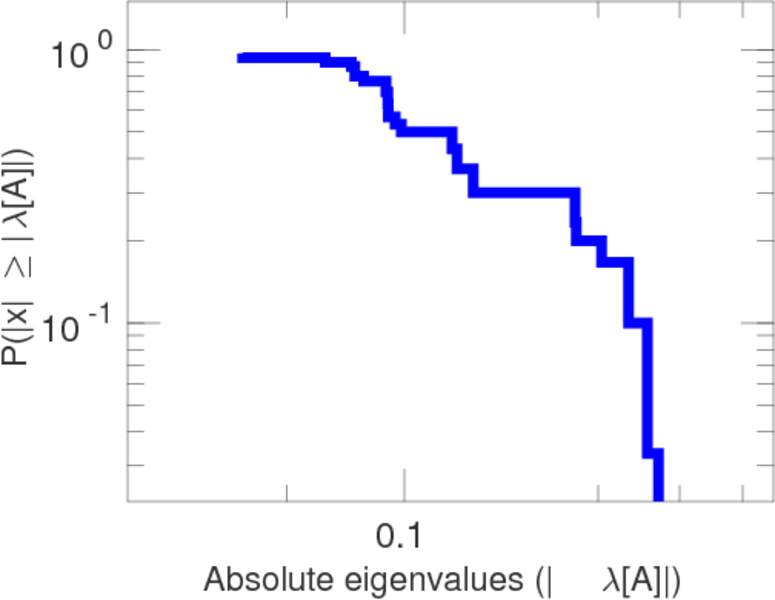
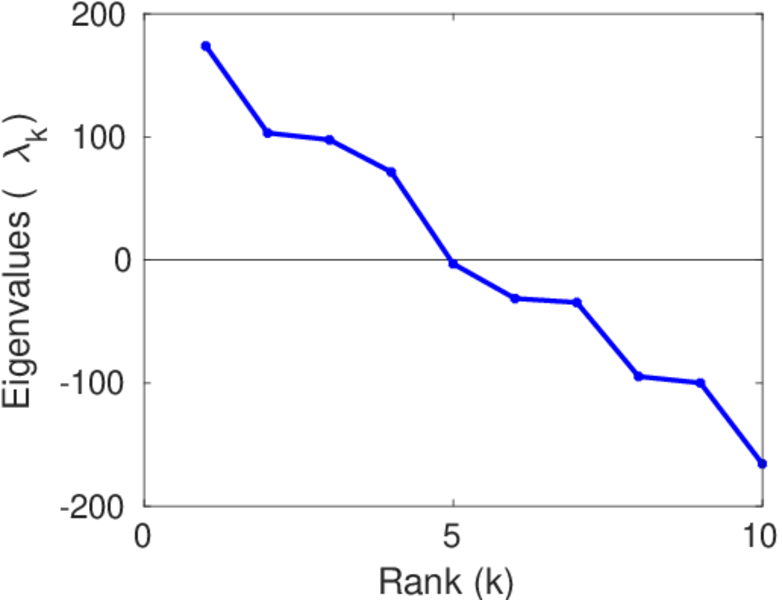
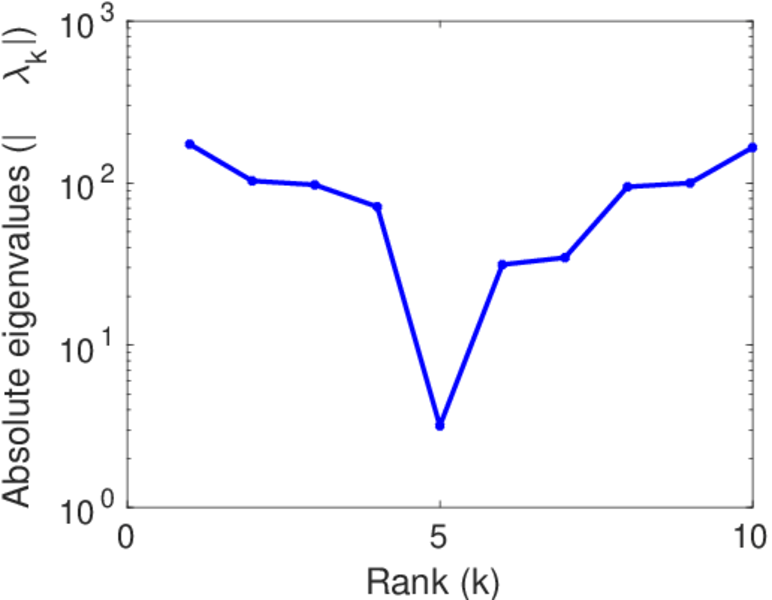
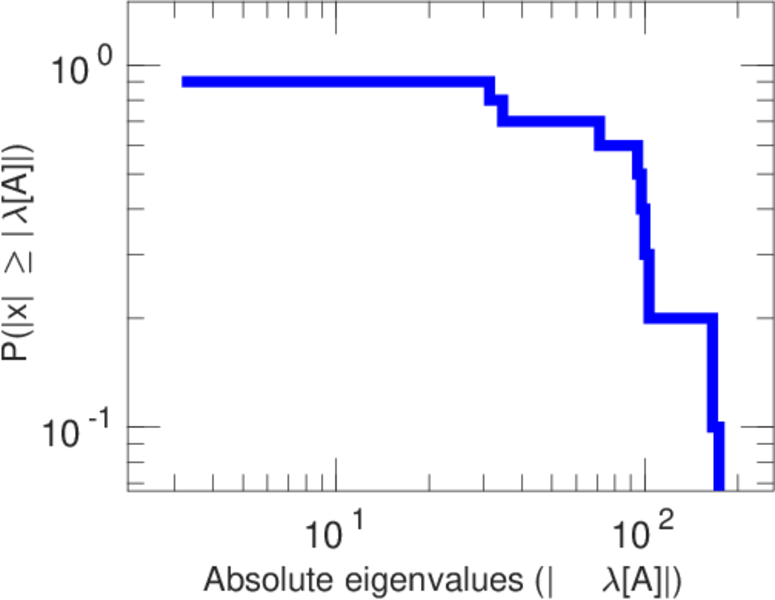
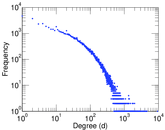
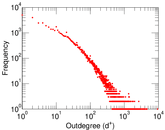
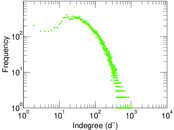
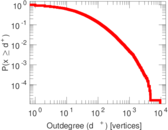
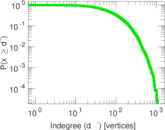
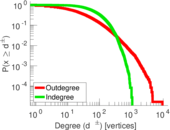
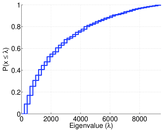
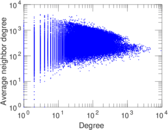
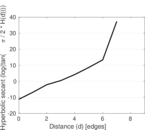
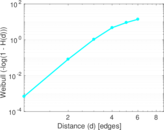
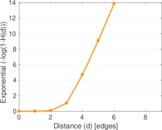
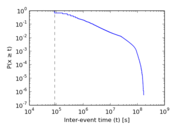
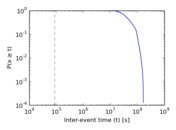
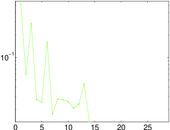
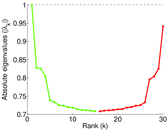
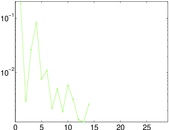
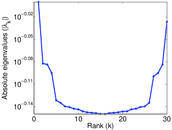
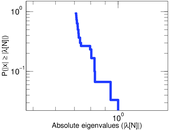
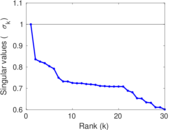
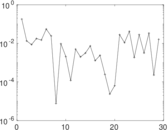
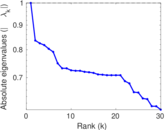
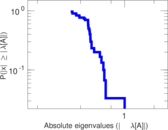
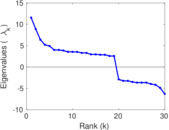
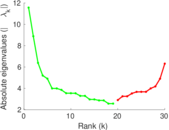
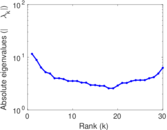
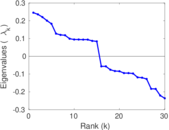
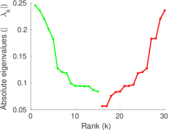
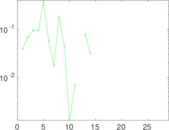
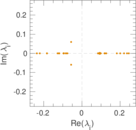
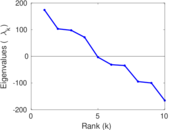
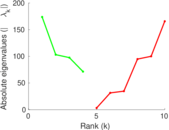
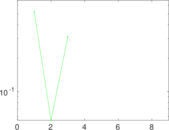
Plots


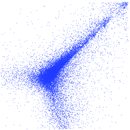
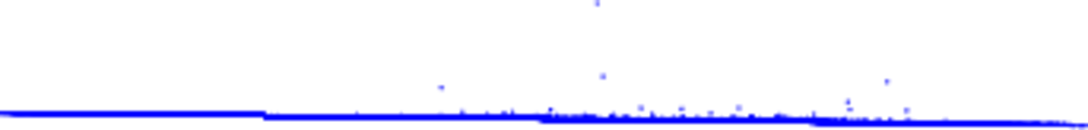


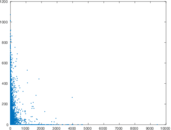


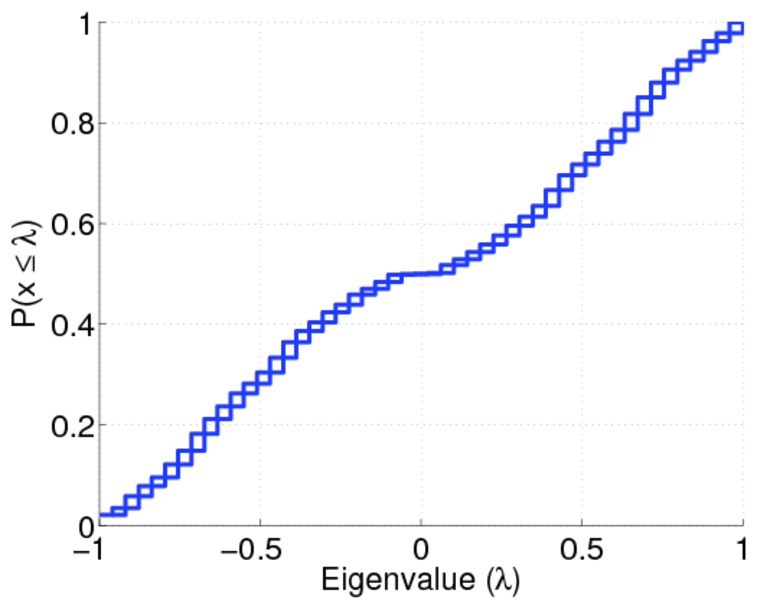
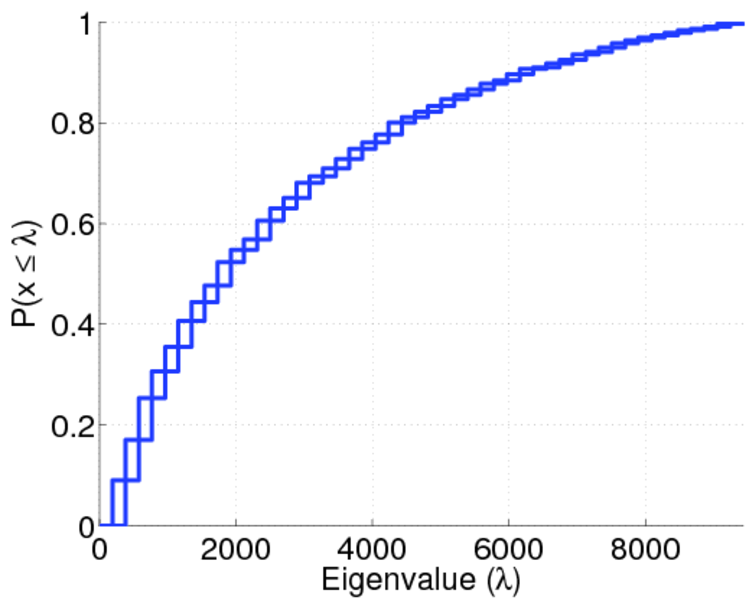
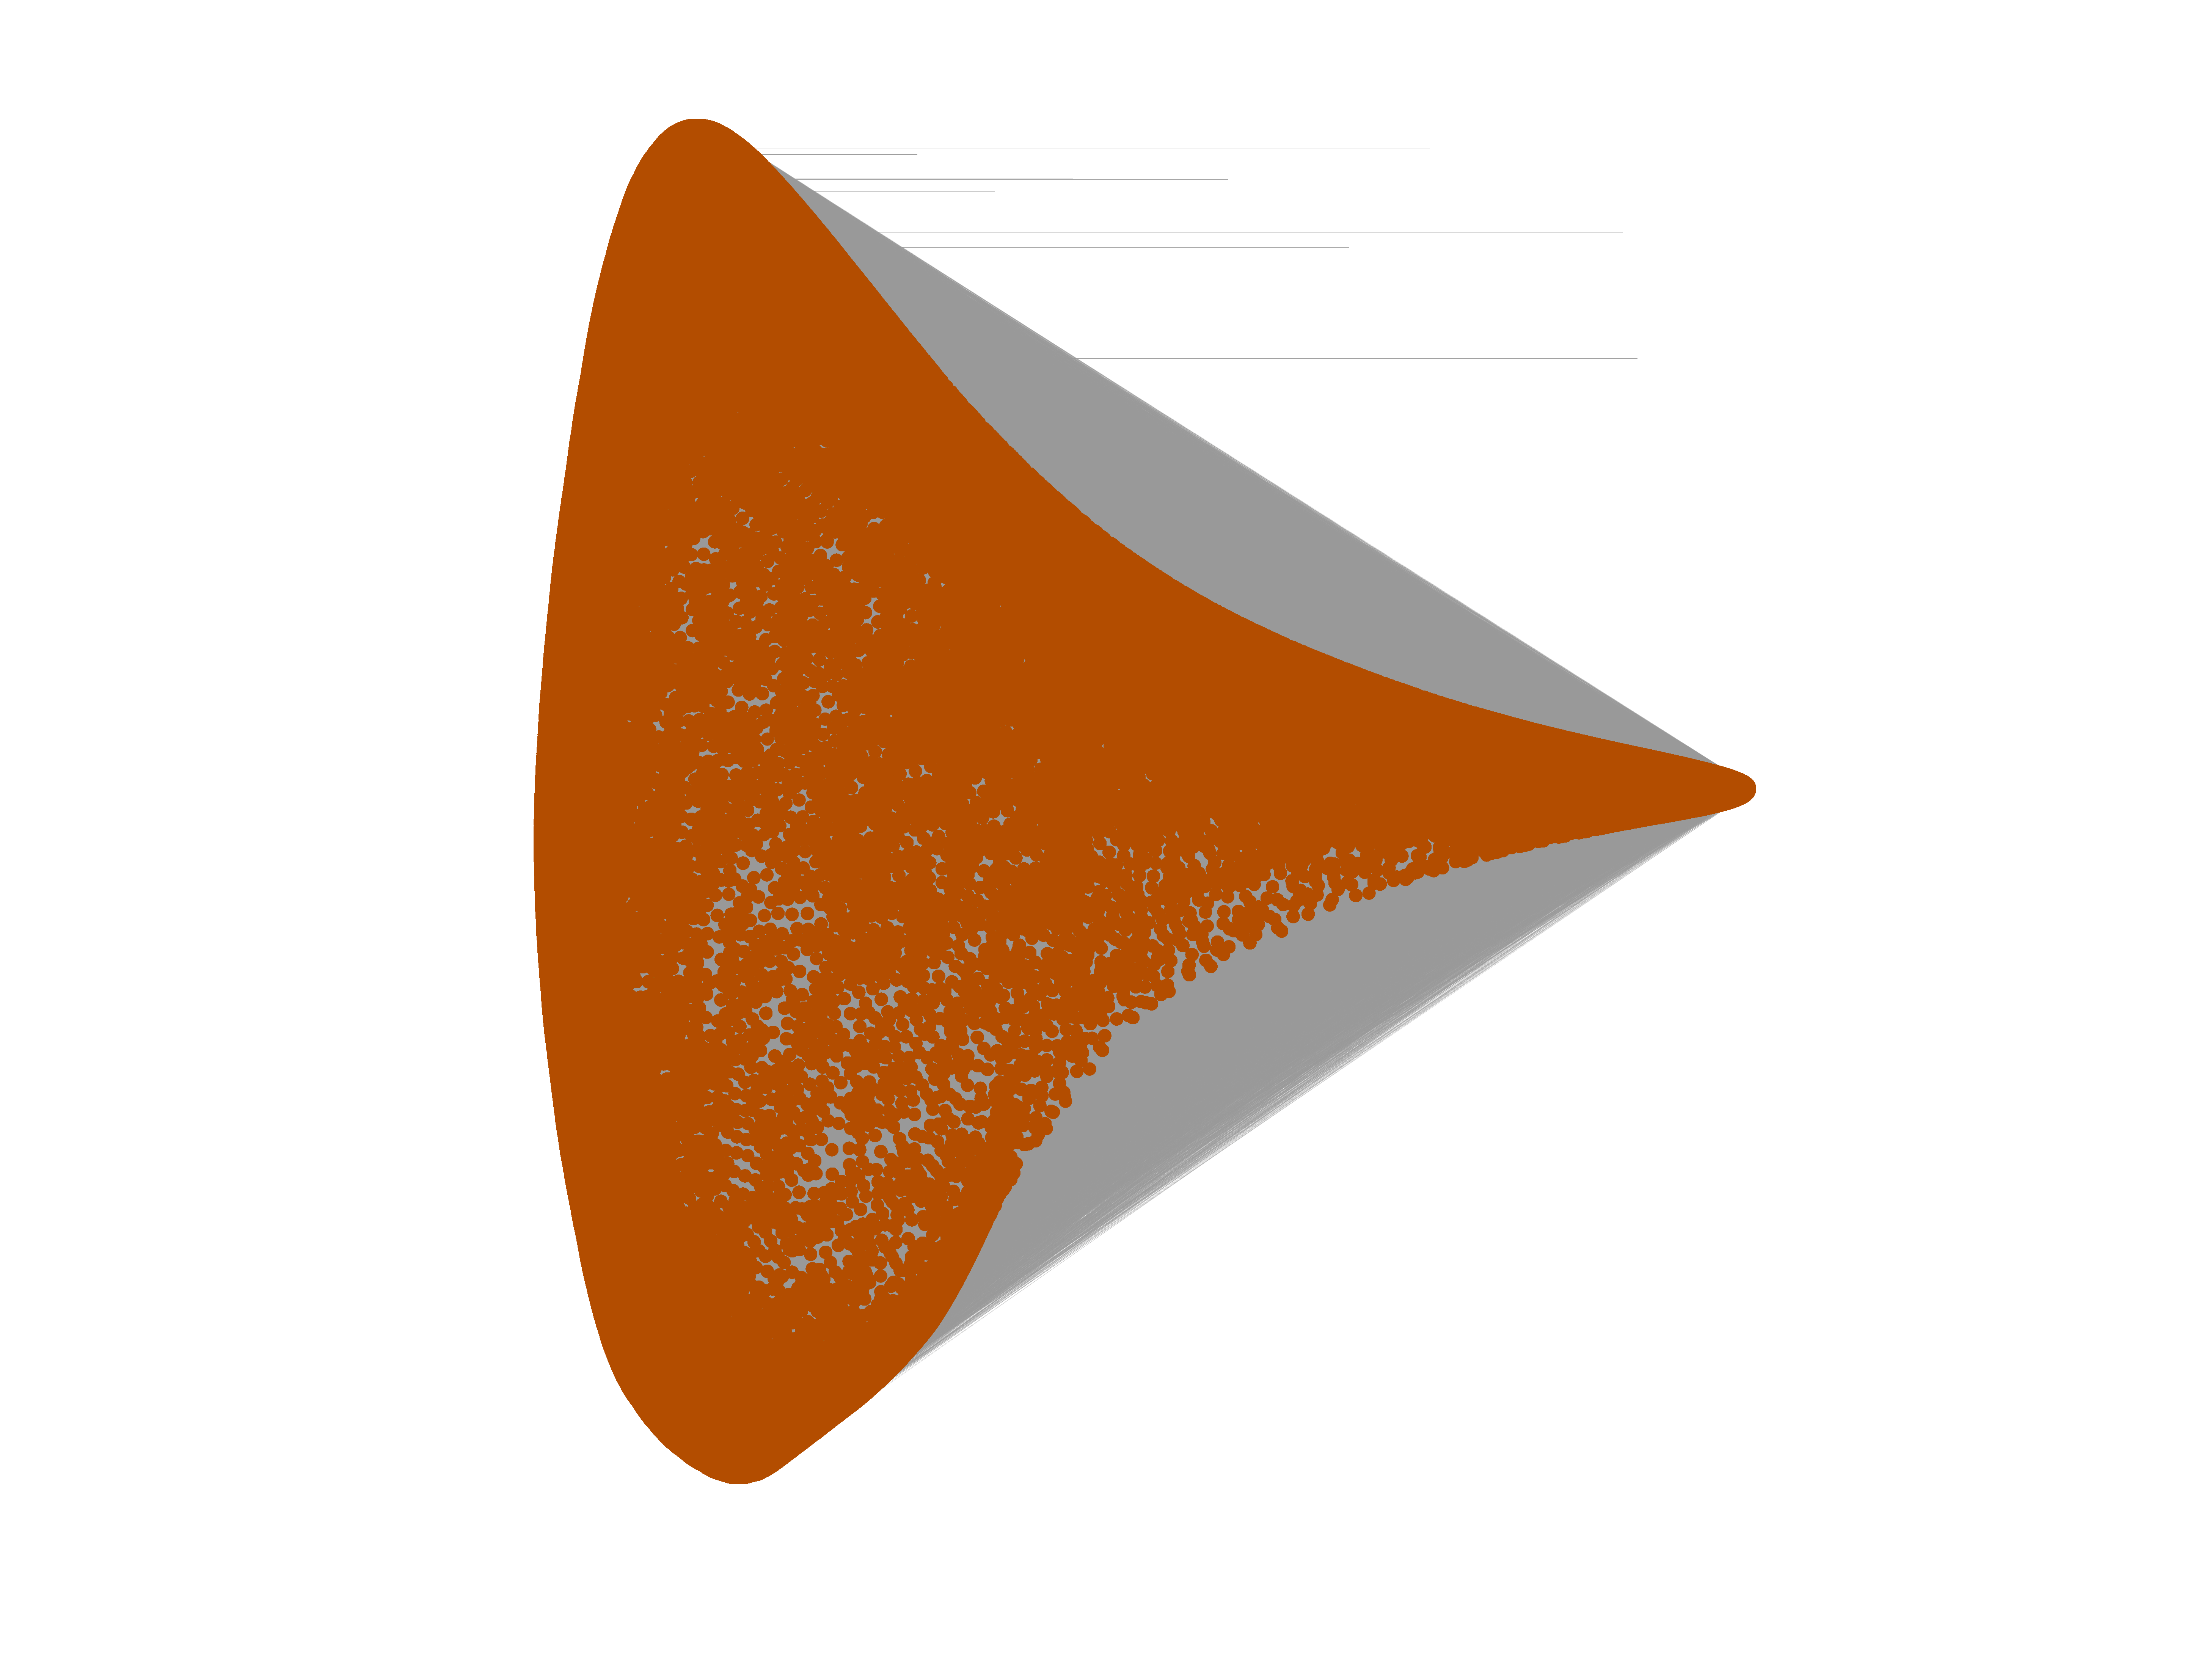
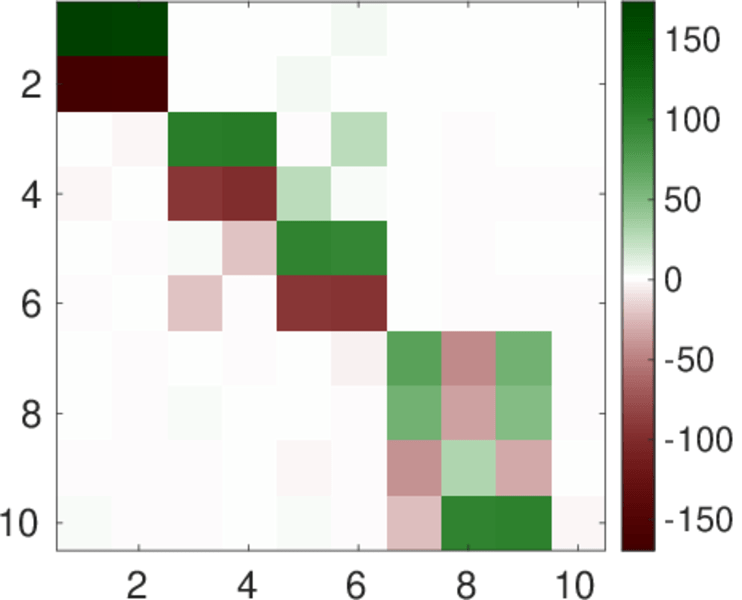
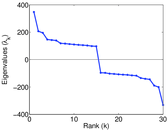
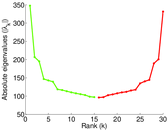
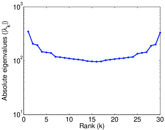
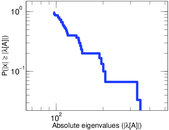
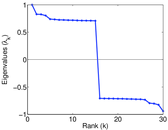
Matrix decompositions plots


Downloads
References
|
[1]
|
Jérôme Kunegis.
KONECT – The Koblenz Network Collection.
In Proc. Int. Conf. on World Wide Web Companion, pages
1343–1350, 2013.
[ http ]
|
|
[2]
|
Ursula Redmond and Pádraig Draig Cunningham.
A temporal network analysis reveals the unprofitability of arbitrage
in the Prosper marketplace.
Expert Syst. with Appl.: An Int. J., 40(9), 2013.
|
 KONECT ‣ Networks ‣
Buy Me a Coffee
KONECT ‣ Networks ‣
Buy Me a Coffee