Stack Overflow
This is the bipartite Stack Overflow favorite network. Stack Overflow is the
main question and answer website of the Stack Exchange Network. The nodes
represent users and posts. An undirected, unweighted edge denotes that a user
has marked a post as a favorite.
Metadata
Statistics
| Size | n = | 641,876
|
| Left size | n1 = | 545,196
|
| Right size | n2 = | 96,680
|
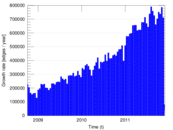
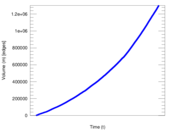
| Volume | m = | 1,301,942
|
| Wedge count | s = | 205,586,615
|
| Claw count | z = | 168,997,476,966
|
| Cross count | x = | 188,183,075,262,776
|
| Square count | q = | 18,293,548
|
| 4-Tour count | T4 = | 971,310,588
|
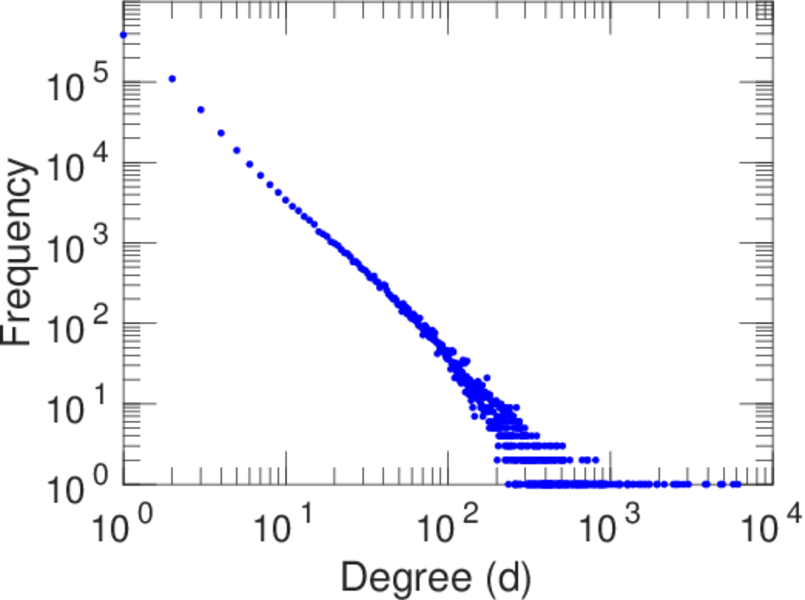
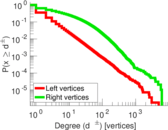
| Maximum degree | dmax = | 6,119
|
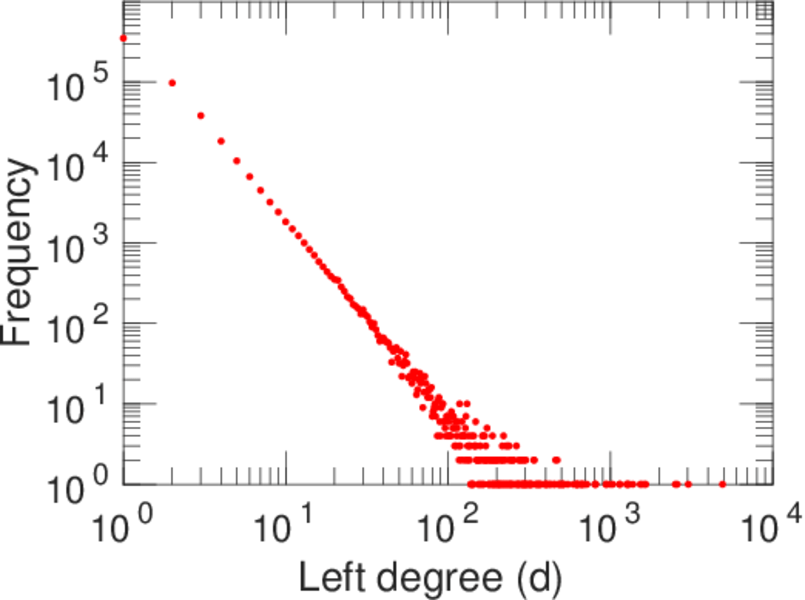
| Maximum left degree | d1max = | 4,917
|
| Maximum right degree | d2max = | 6,119
|
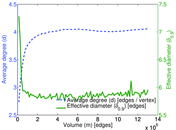
| Average degree | d = | 4.056 68
|
| Average left degree | d1 = | 2.388 03
|
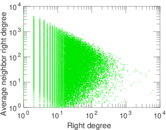
| Average right degree | d2 = | 13.466 5
|
| Fill | p = | 2.470 03 × 10−5
|
| Size of LCC | N = | 605,159
|
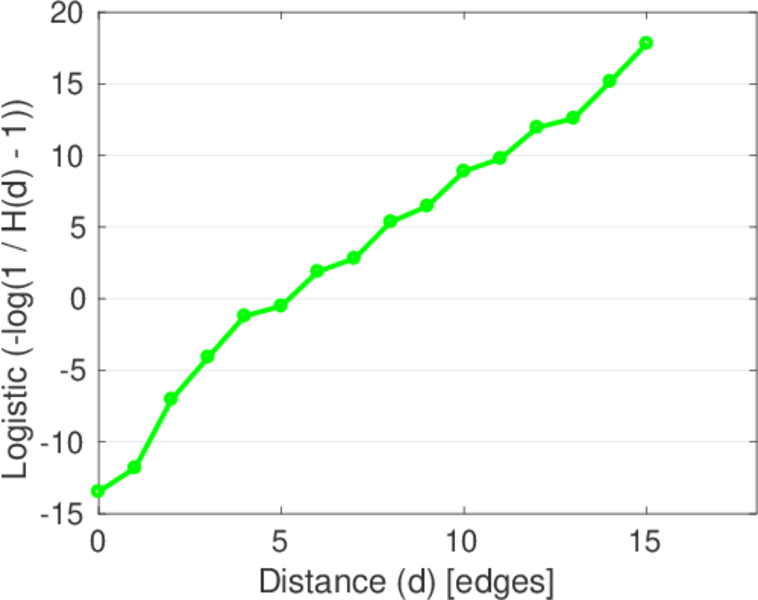
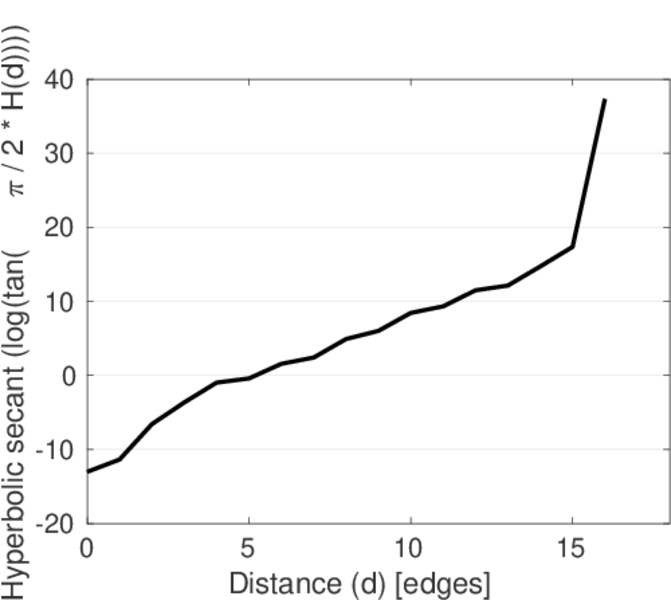
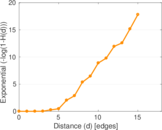
| Diameter | δ = | 20
|
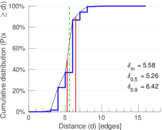
| 50-Percentile effective diameter | δ0.5 = | 5.257 96
|
| 90-Percentile effective diameter | δ0.9 = | 6.423 08
|
| Median distance | δM = | 6
|
| Mean distance | δm = | 5.576 15
|
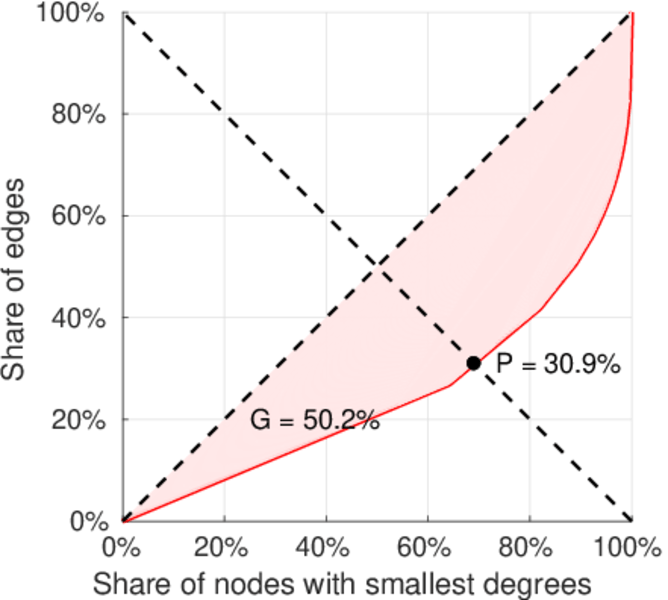
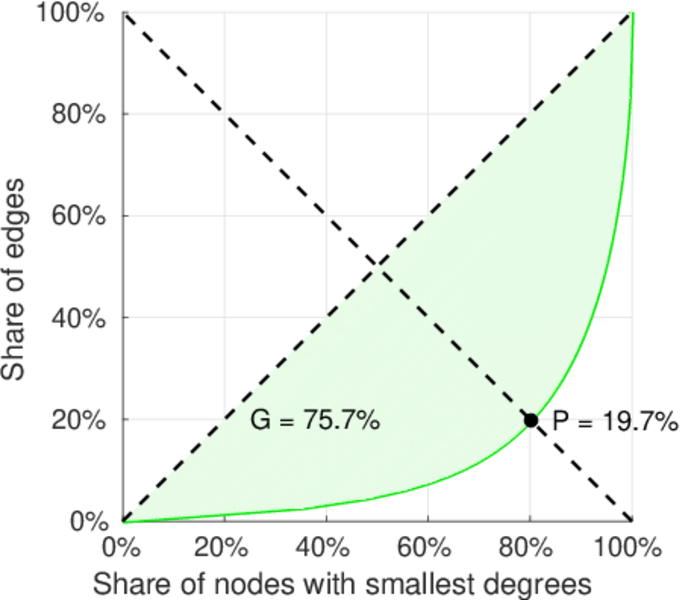
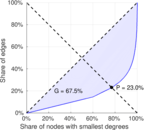
| Gini coefficient | G = | 0.705 753
|
| Balanced inequality ratio | P = | 0.214 349
|
| Left balanced inequality ratio | P1 = | 0.309 018
|
| Right balanced inequality ratio | P2 = | 0.196 541
|
| Relative edge distribution entropy | Her = | 0.890 745
|
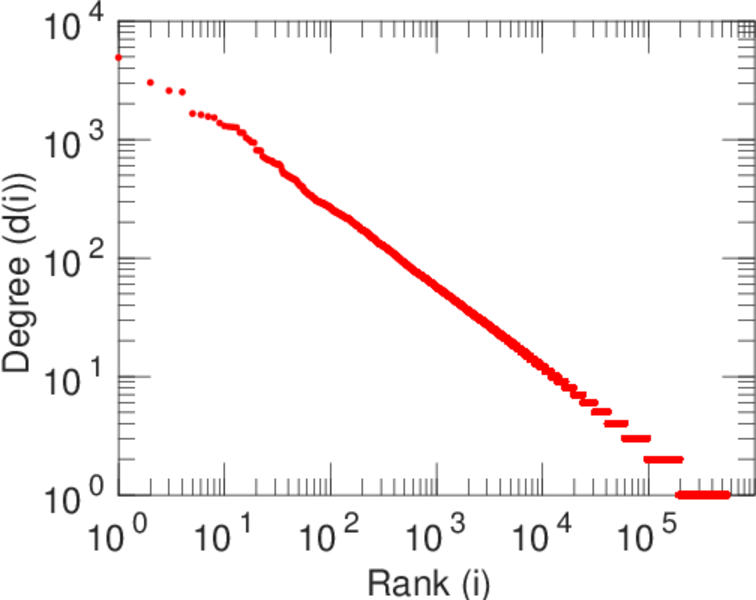
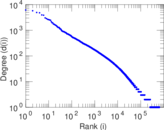
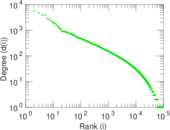
| Power law exponent | γ = | 2.797 70
|
| Tail power law exponent | γt = | 2.011 00
|
| Tail power law exponent with p | γ3 = | 2.011 00
|
| p-value | p = | 0.000 00
|
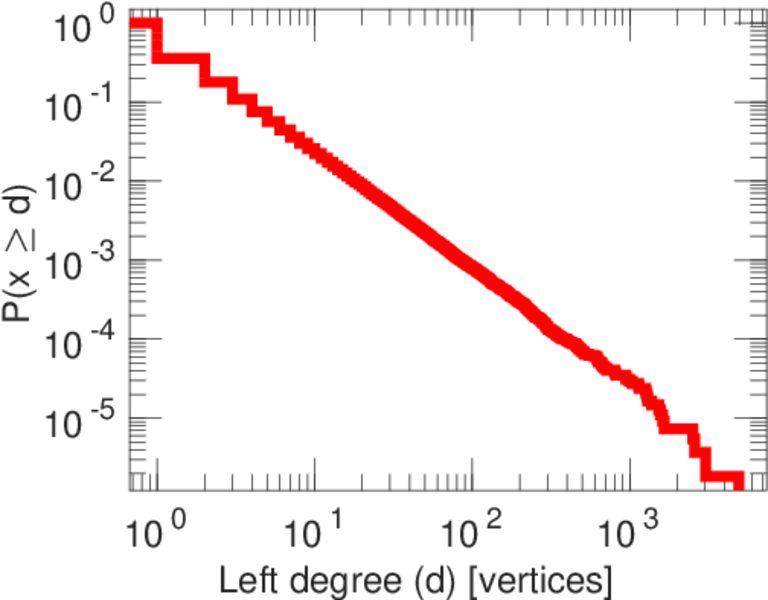
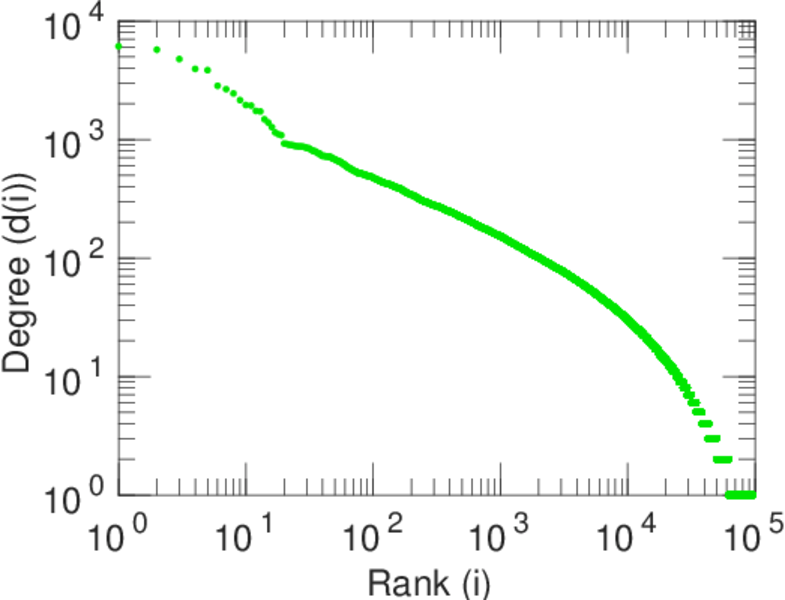
| Left tail power law exponent with p | γ3,1 = | 2.451 00
|
| Left p-value | p1 = | 0.651 000
|
| Right tail power law exponent with p | γ3,2 = | 2.611 00
|
| Right p-value | p2 = | 0.000 00
|
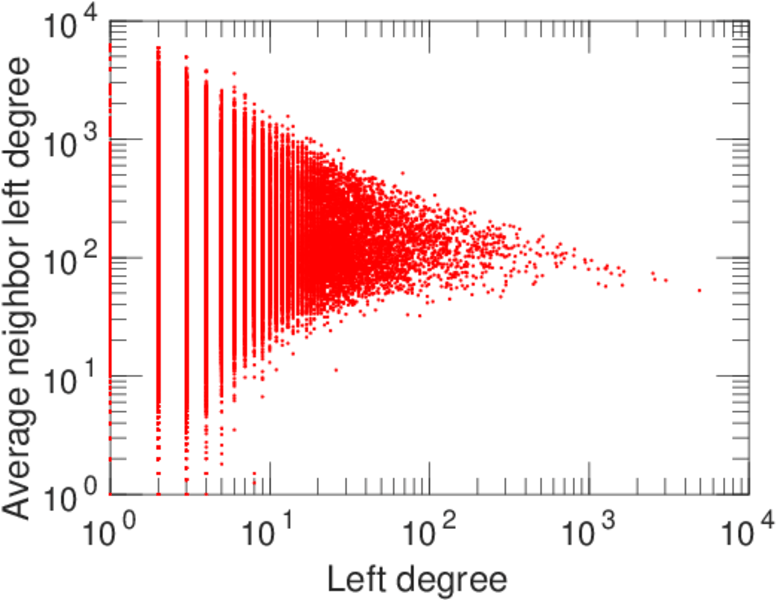
| Degree assortativity | ρ = | −0.039 986 1
|
| Degree assortativity p-value | pρ = | 0.000 00
|
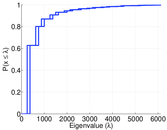
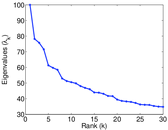
| Spectral norm | α = | 99.977 2
|
| Algebraic connectivity | a = | 0.013 941 0
|
| Spectral separation | |λ1[A] / λ2[A]| = | 1.278 42
|
| Controllability | C = | 460,863
|
| Relative controllability | Cr = | 0.717 997
|
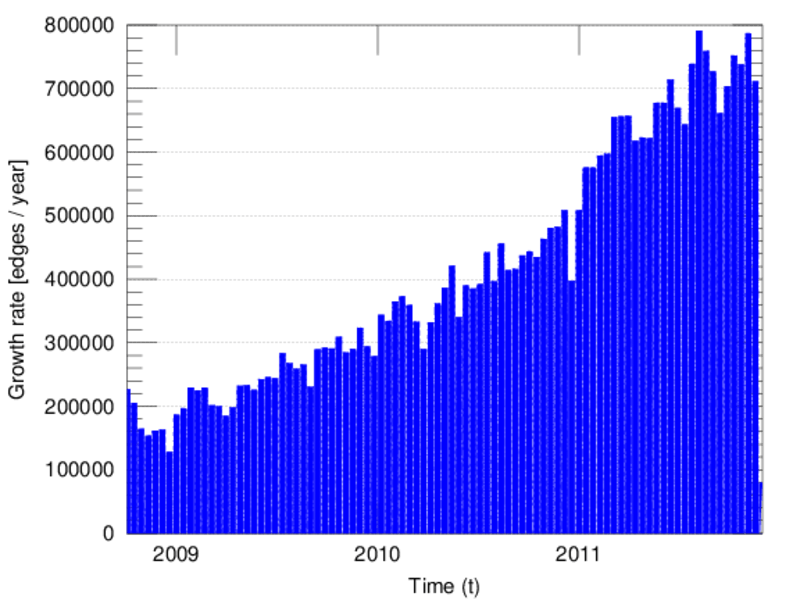
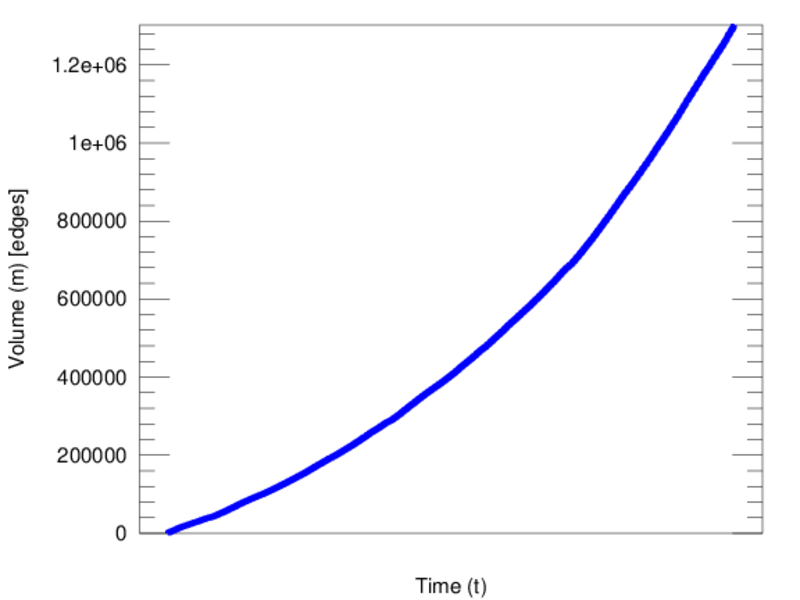
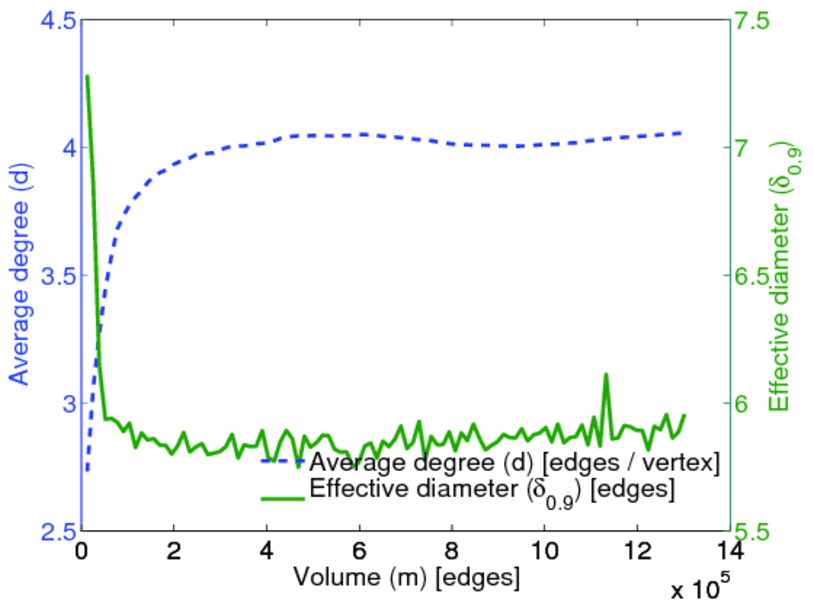
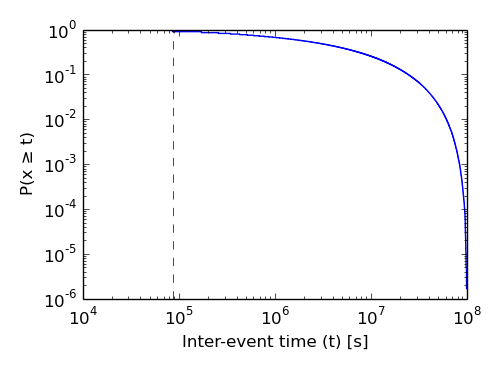
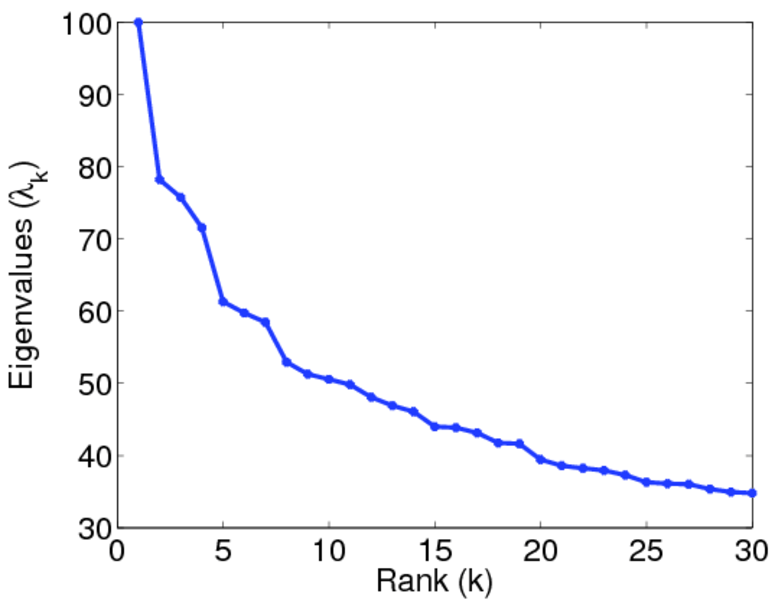
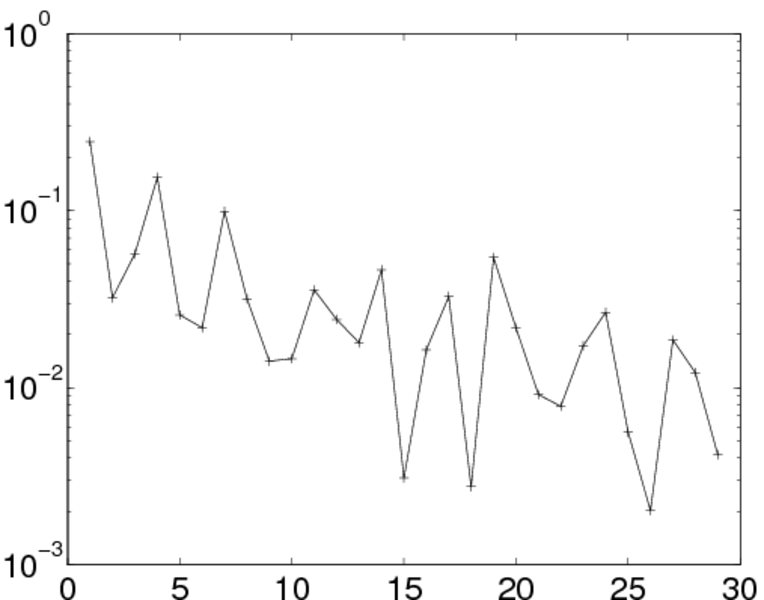
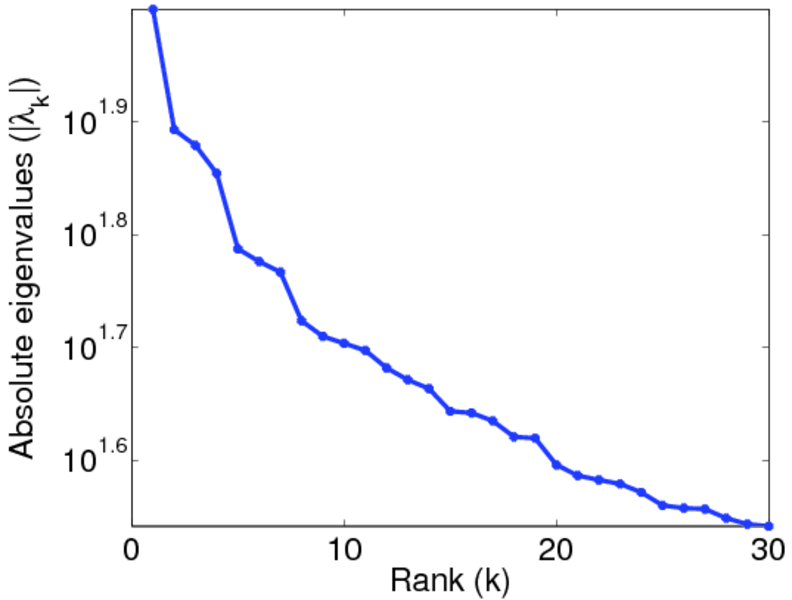
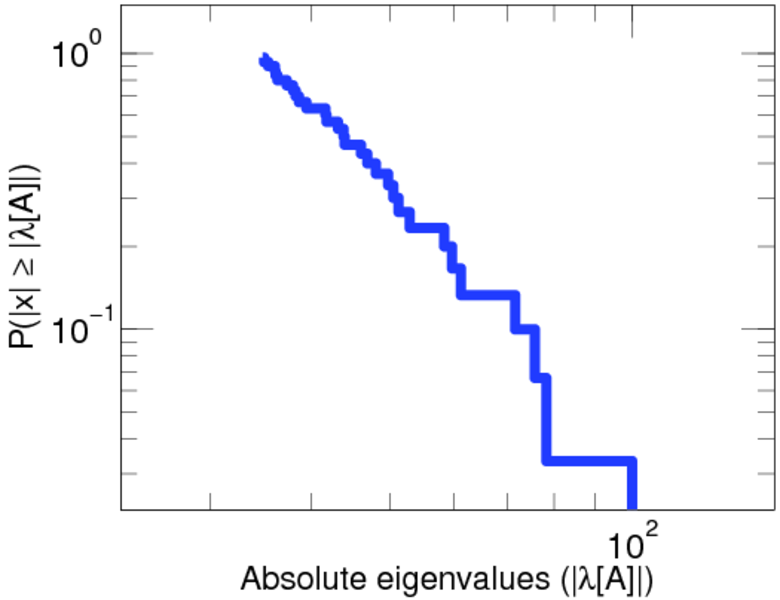
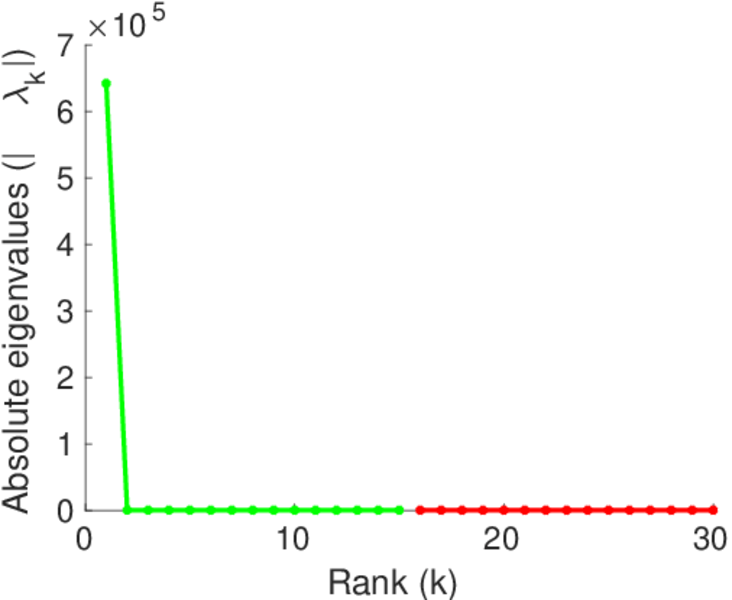
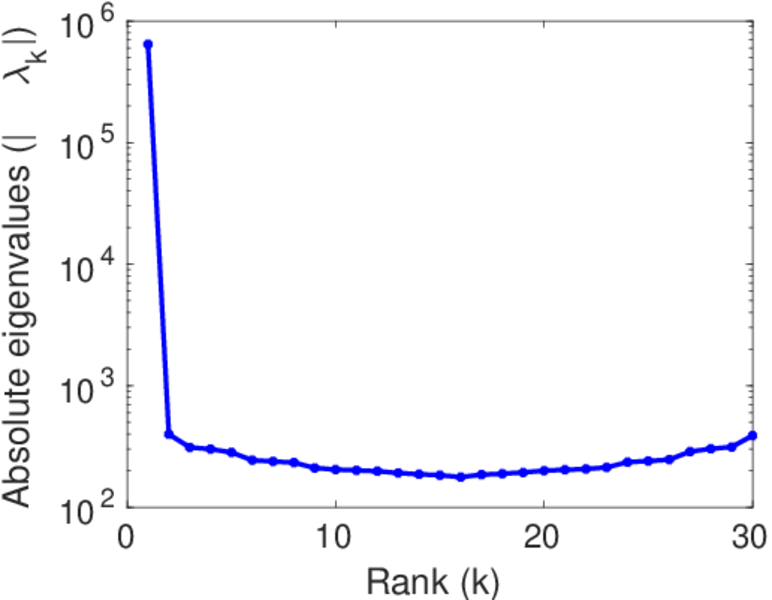
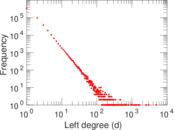
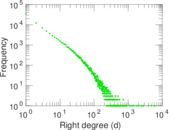
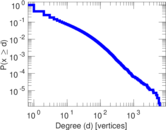
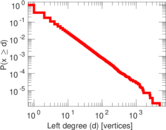
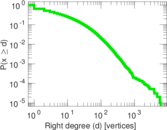
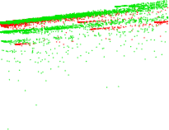
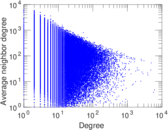
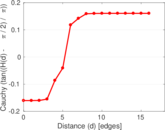
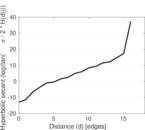
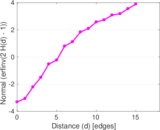
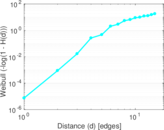
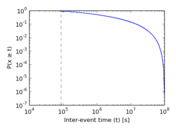
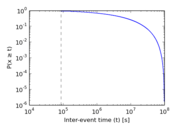
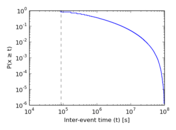
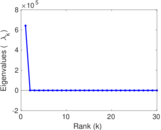
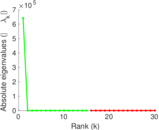
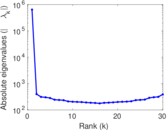
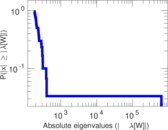
Plots


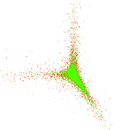
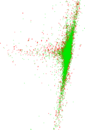


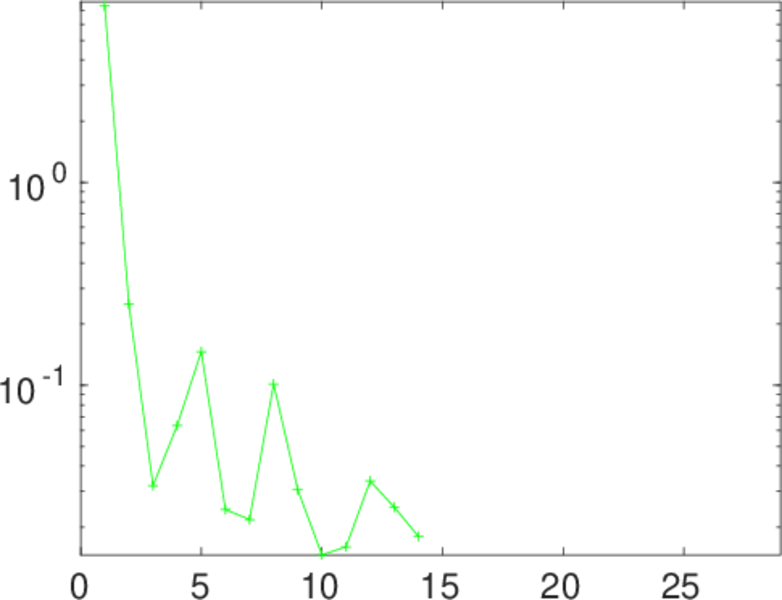
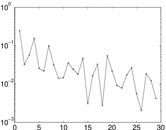
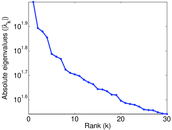
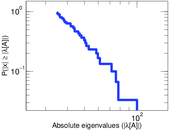
Matrix decompositions plots

Downloads
References
|
[1]
|
Jérôme Kunegis.
KONECT – The Koblenz Network Collection.
In Proc. Int. Conf. on World Wide Web Companion, pages
1343–1350, 2013.
[ http ]
|
|
[2]
|
Stack Exchange Inc.
Stack exchange data explorer.
http://data.stackexchange.com/, 2011.
|
 KONECT ‣ Networks ‣
Buy Me a Coffee
KONECT ‣ Networks ‣
Buy Me a Coffee