Google+ (IMC12)
This bipartite network contains a snapshot of the Google+ social structure.
Left nodes represent users and right nodes represent attributes. An edge links
a user to a attribute which he may share with other users.
Metadata
Statistics
| Size | n = | 10,442,421
|
| Left size | n1 = | 5,998,790
|
| Right size | n2 = | 4,443,631
|
| Volume | m = | 20,592,962
|
| Wedge count | s = | 31,413,709,466
|
| Claw count | z = | 310,331,918,210,903
|
| Cross count | x = | 4,592,753,920,185,512,448
|
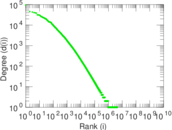
| Maximum degree | dmax = | 95,165
|
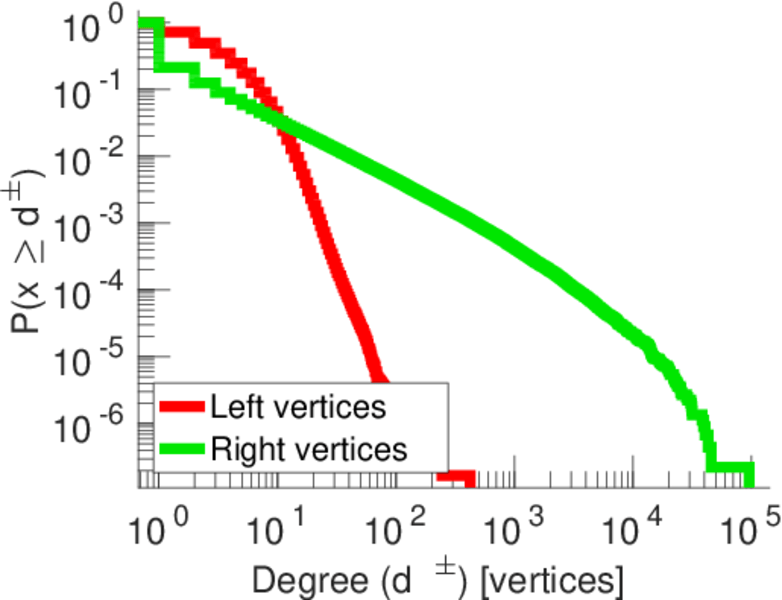
| Maximum left degree | d1max = | 423
|
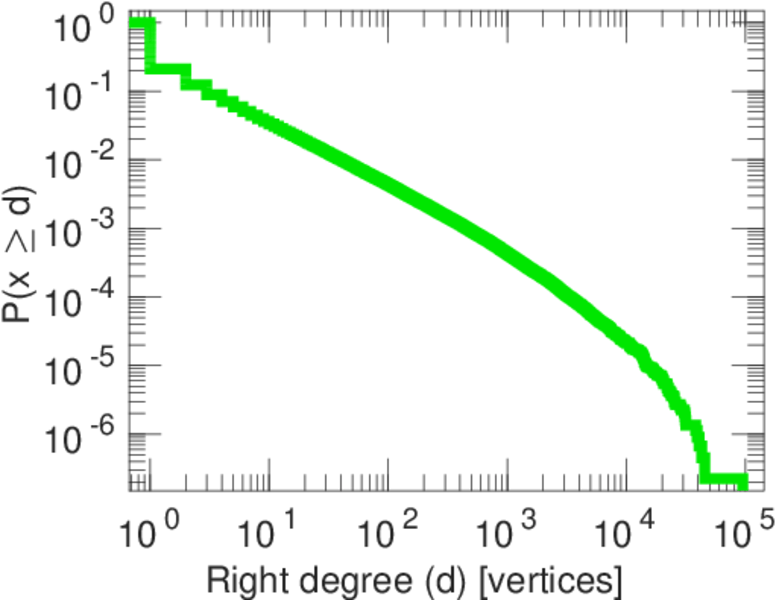
| Maximum right degree | d2max = | 95,165
|
| Average degree | d = | 3.944 10
|
| Average left degree | d1 = | 3.432 85
|
| Average right degree | d2 = | 4.634 26
|
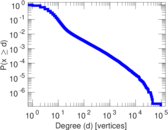
| Fill | p = | 7.725 33 × 10−7
|
| Size of LCC | N = | 9,363,023
|
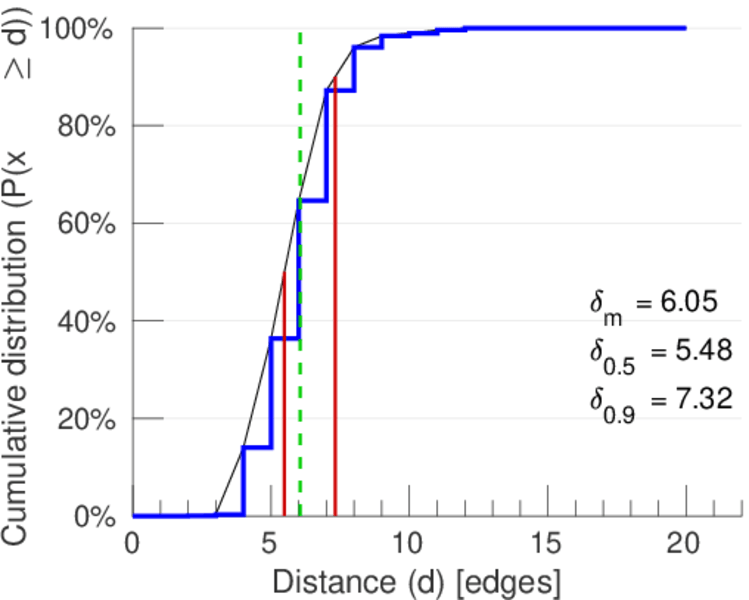
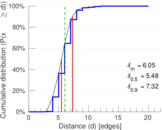
| Diameter | δ = | 24
|
| 50-Percentile effective diameter | δ0.5 = | 5.482 73
|
| 90-Percentile effective diameter | δ0.9 = | 7.315 80
|
| Median distance | δM = | 6
|
| Mean distance | δm = | 6.046 39
|
| Gini coefficient | G = | 0.579 175
|
| Balanced inequality ratio | P = | 0.290 747
|
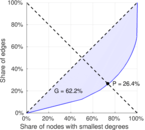
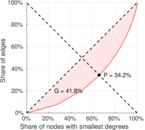
| Left balanced inequality ratio | P1 = | 0.342 269
|
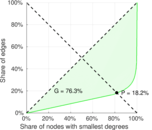
| Right balanced inequality ratio | P2 = | 0.181 707
|
| Relative edge distribution entropy | Her = | 0.893 300
|
| Power law exponent | γ = | 2.492 22
|
| Tail power law exponent | γt = | 1.961 00
|
| Degree assortativity | ρ = | −0.017 463 1
|
| Degree assortativity p-value | pρ = | 0.000 00
|
| Spectral norm | α = | 309.460
|
| Spectral separation | |λ1[A] / λ2[A]| = | 1.316 52
|
| Controllability | C = | 4,592,127
|
| Relative controllability | Cr = | 0.439 757
|
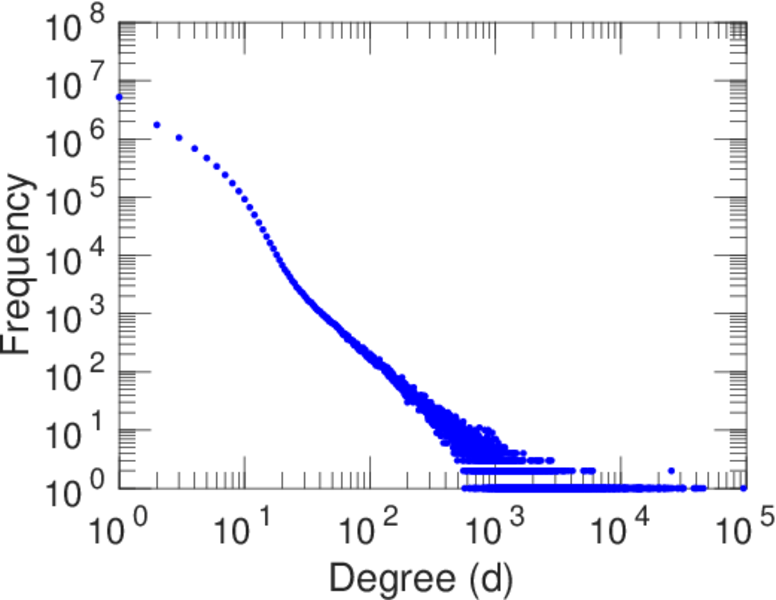
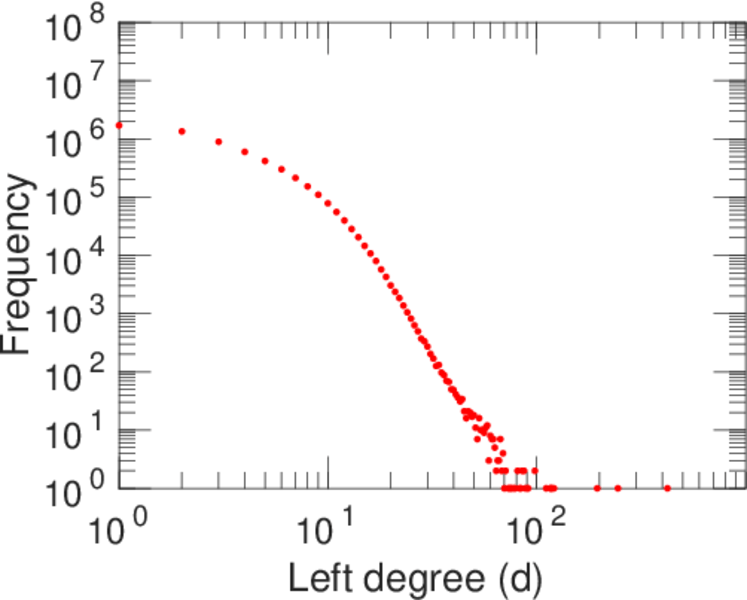
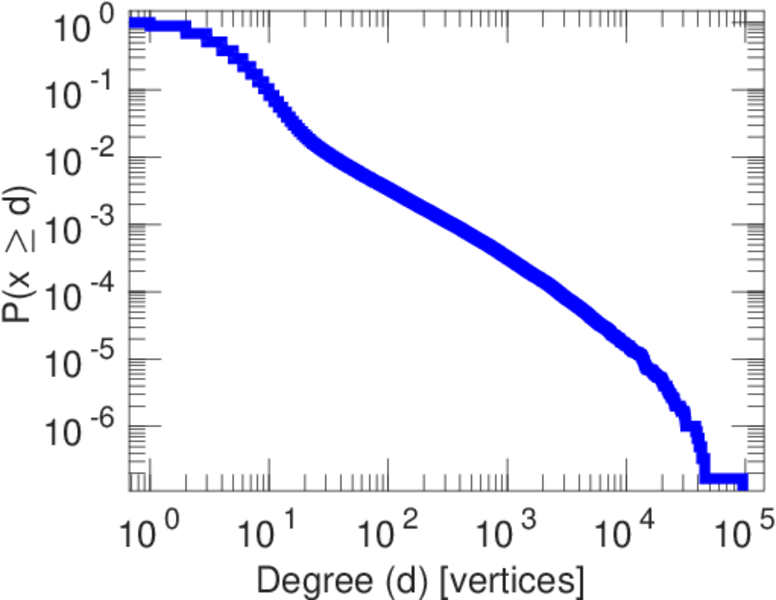
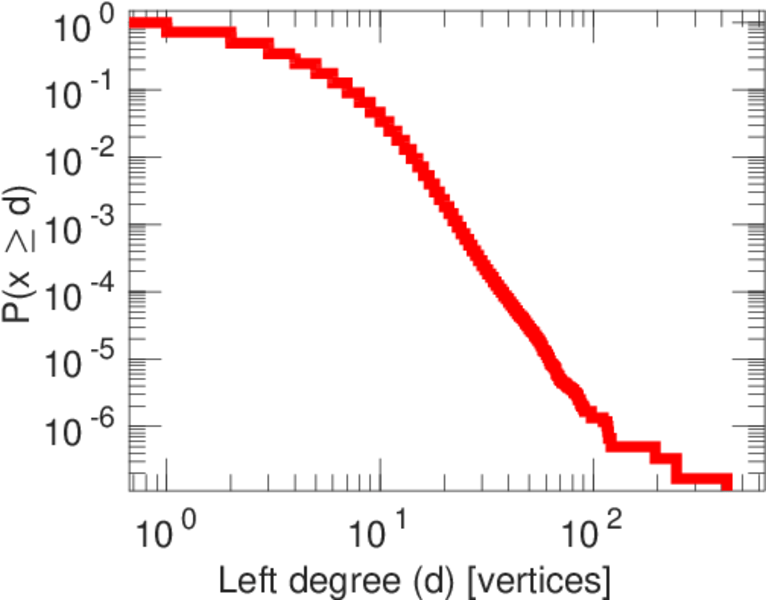
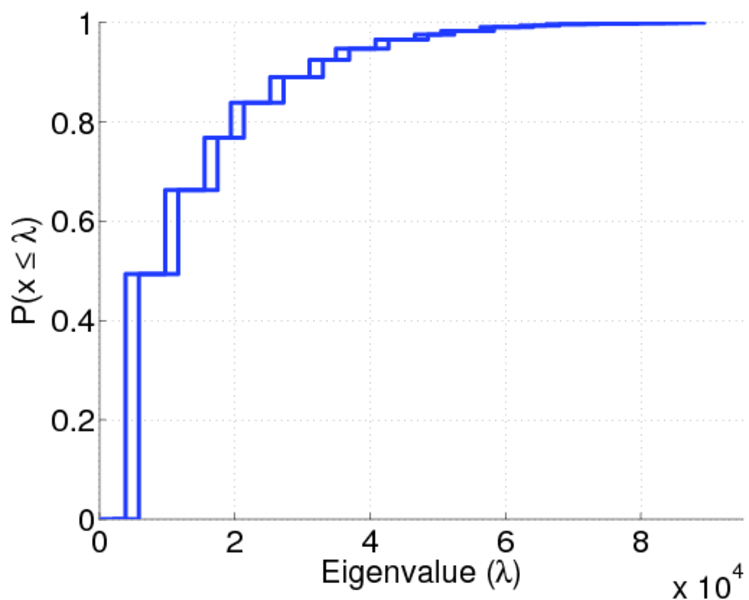
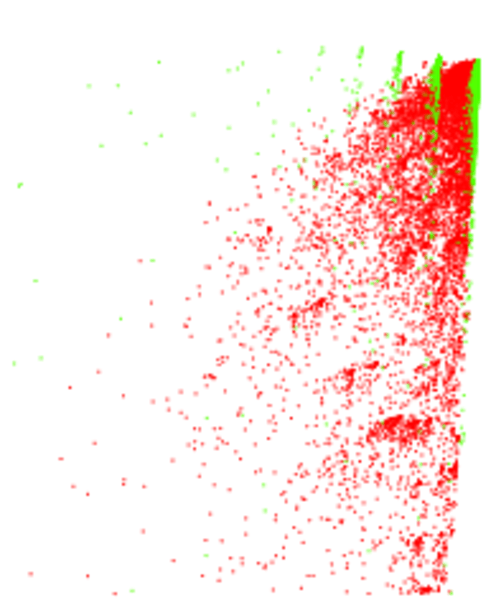
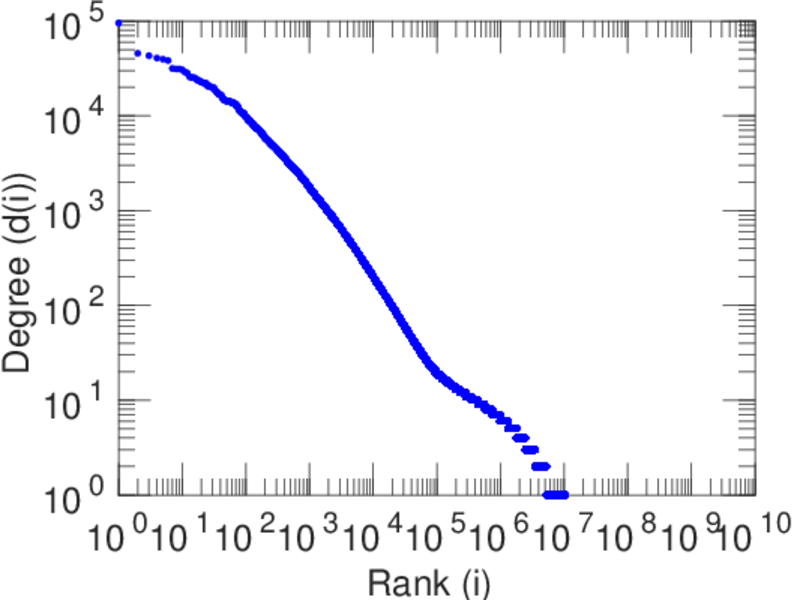
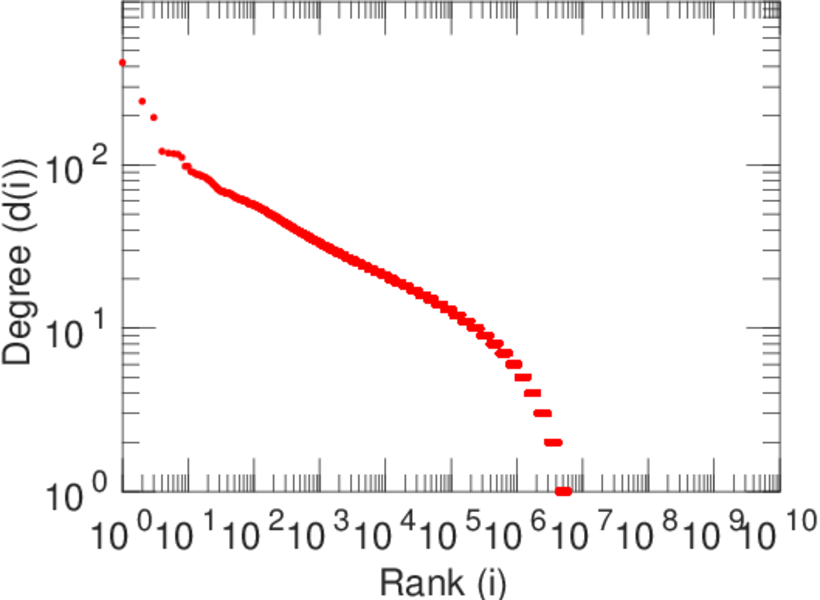
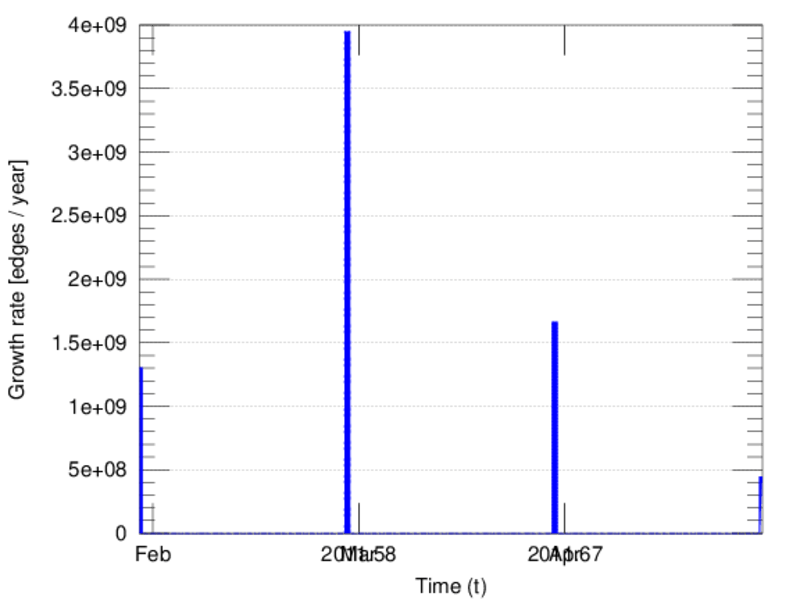
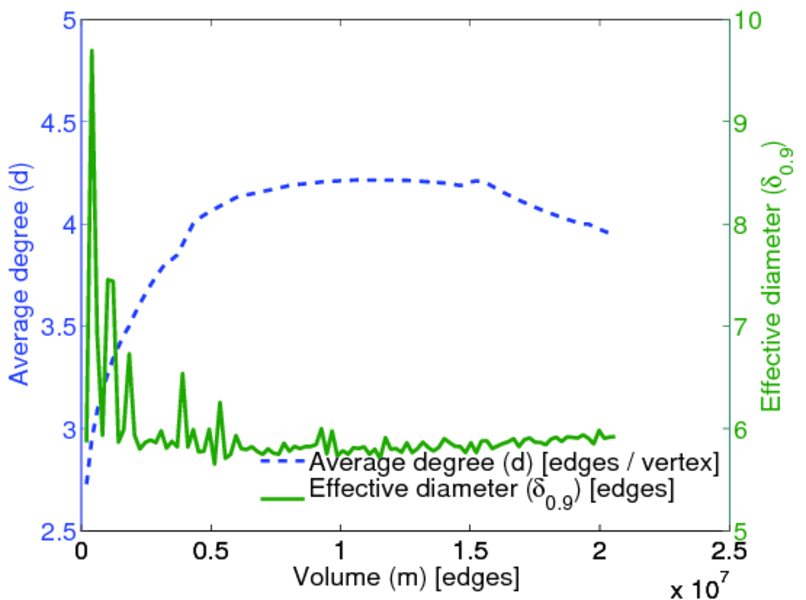
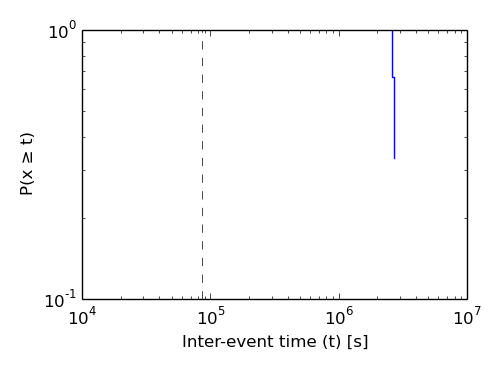
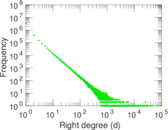
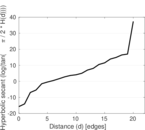
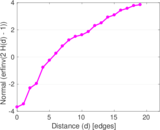
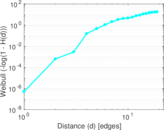
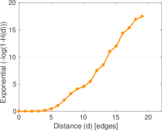
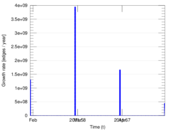
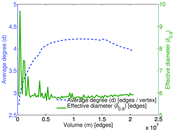
Plots


Downloads
References
|
[1]
|
Jérôme Kunegis.
KONECT – The Koblenz Network Collection.
In Proc. Int. Conf. on World Wide Web Companion, pages
1343–1350, 2013.
[ http ]
|
|
[2]
|
Neil Zhenqiang Gong, Wenchang Xu, Ling Huang, Prateek Mittal, Emil Stefanov,
Vyas Sekar, and Dawn Song.
Evolution of social-attribute networks: Measurements, modeling, and
implications using Google+.
In Proc. Internet Measurement Conf., pages 131–144, 2012.
|
 KONECT ‣ Networks ‣
Buy Me a Coffee
KONECT ‣ Networks ‣
Buy Me a Coffee