WebUni Magdeburg
This is the bipartite network of threads and the words they contain from the
student's social website WebUni of the Otto-von-Guericke University Magdeburg
in Germany.
Metadata
Statistics
| Size | n = | 206,350
|
| Left size | n1 = | 6,202
|
| Right size | n2 = | 200,148
|
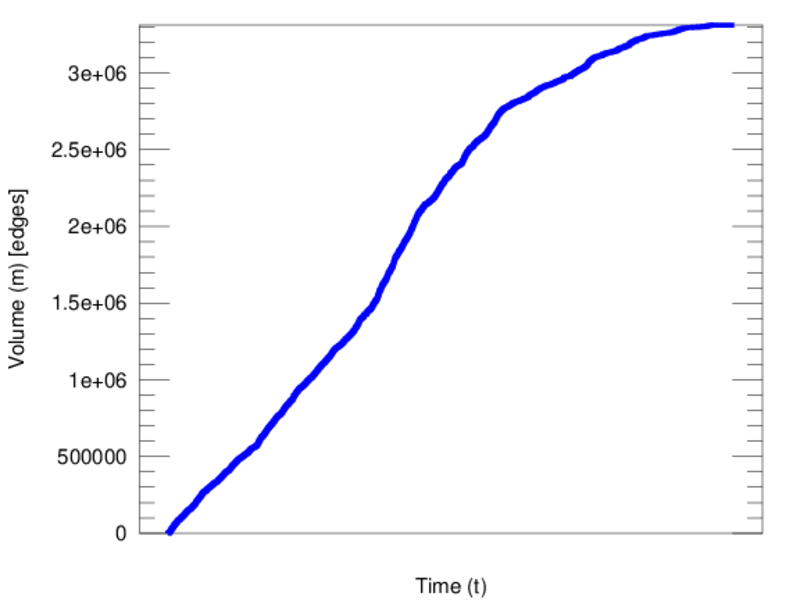
| Volume | m = | 3,869,707
|
| Unique edge count | m̿ = | 1,948,004
|
| Wedge count | s = | 1,353,078,618
|
| Claw count | z = | 779,473,328,511
|
| Cross count | x = | 513,883,255,015,350
|
| Square count | q = | 21,431,485,810
|
| 4-Tour count | T4 = | 176,869,111,720
|
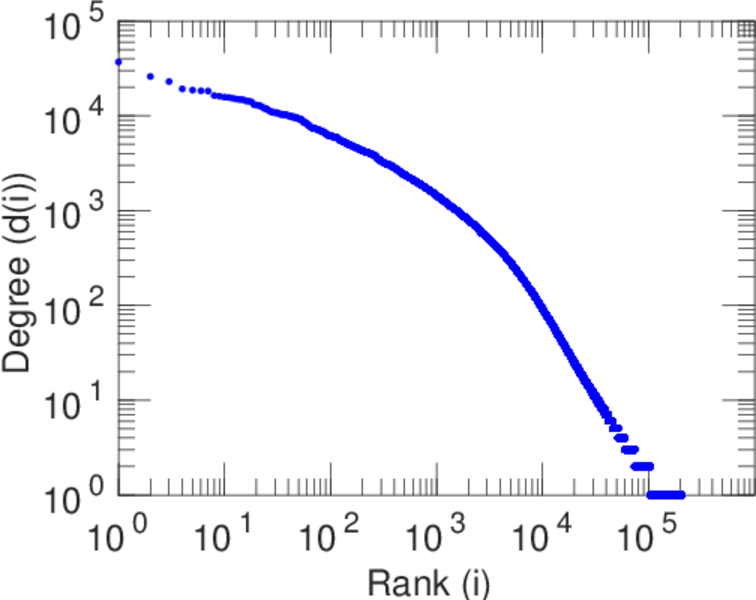
| Maximum degree | dmax = | 28,837
|
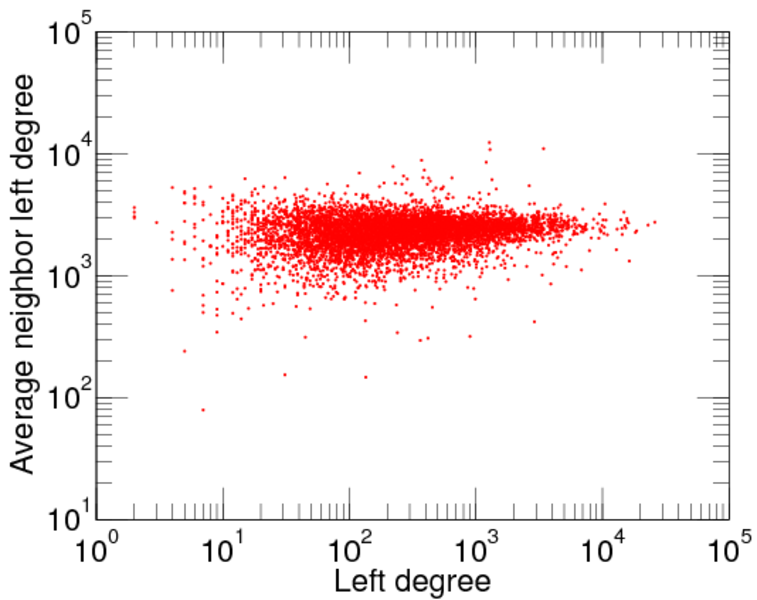
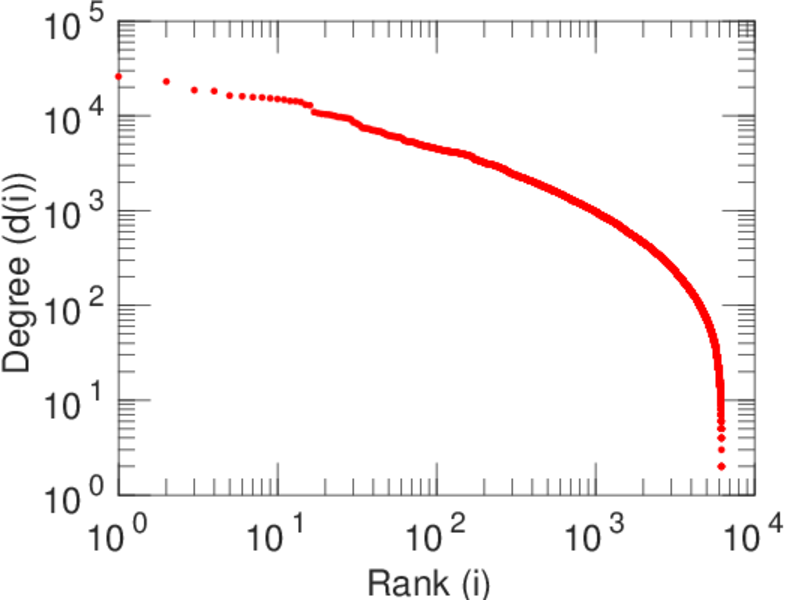
| Maximum left degree | d1max = | 23,355
|
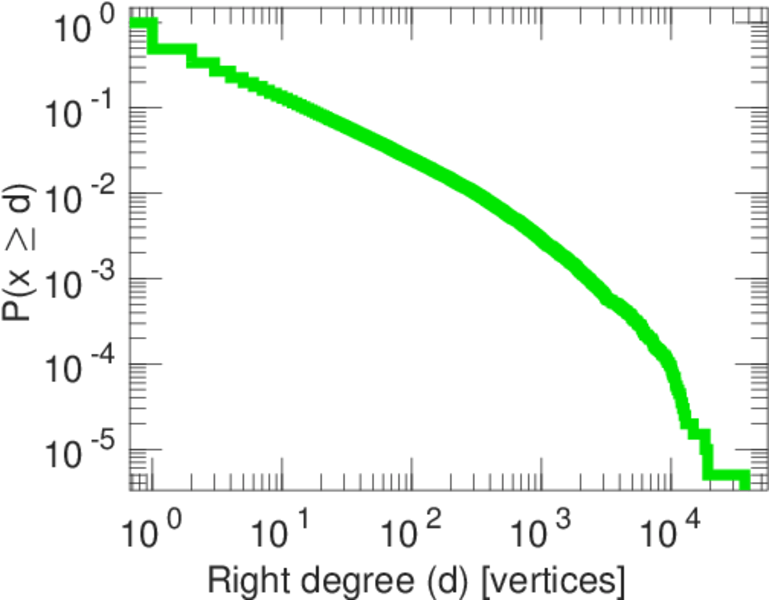
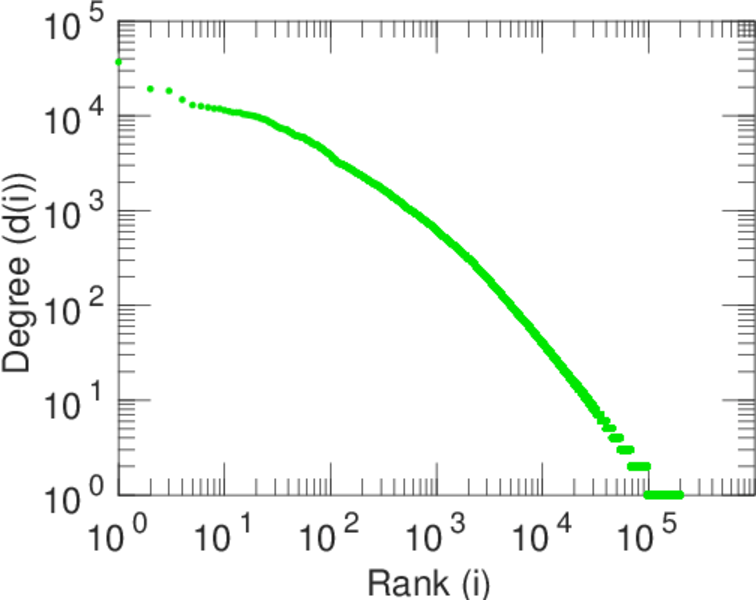
| Maximum right degree | d2max = | 28,837
|
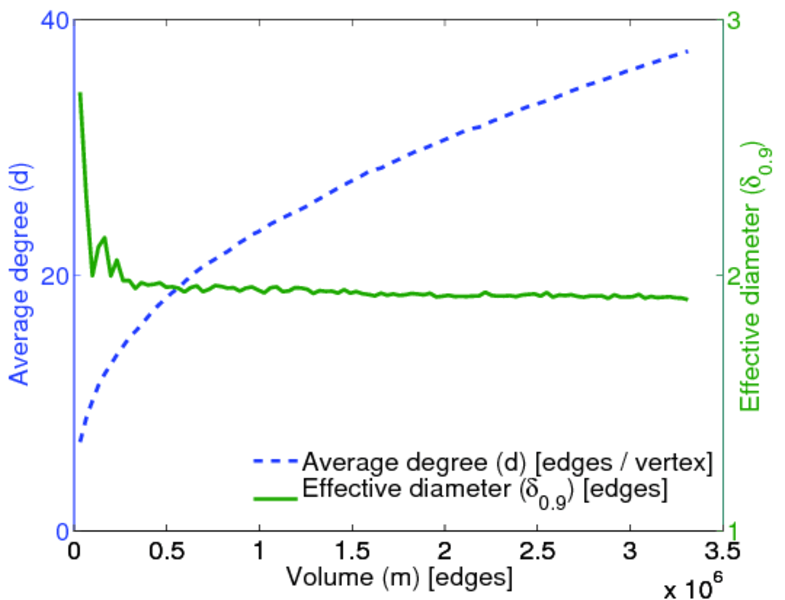
| Average degree | d = | 37.506 2
|
| Average left degree | d1 = | 623.945
|
| Average right degree | d2 = | 19.334 2
|
| Fill | p = | 0.001 569 30
|
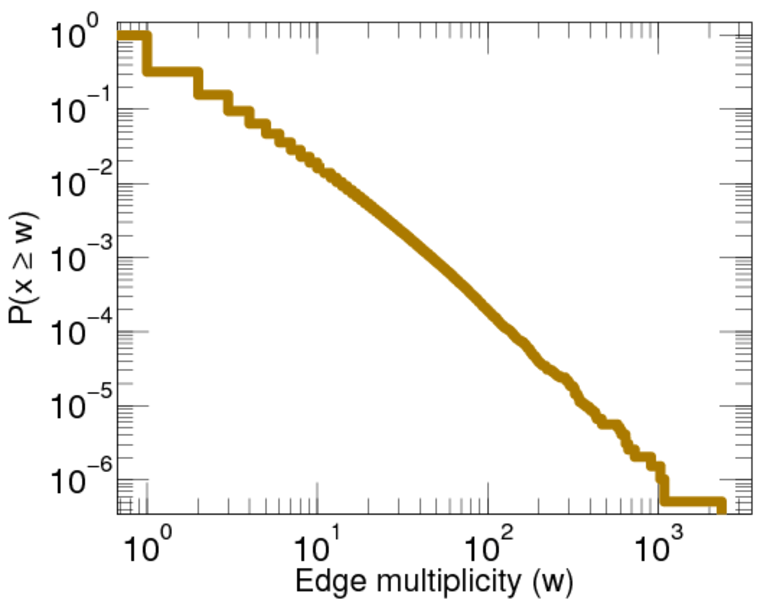
| Average edge multiplicity | m̃ = | 1.986 50
|
| Size of LCC | N = | 206,350
|
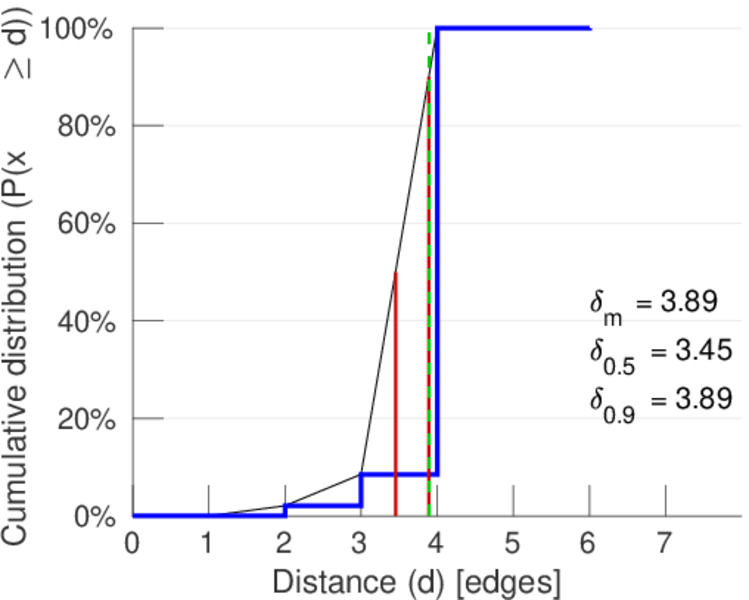
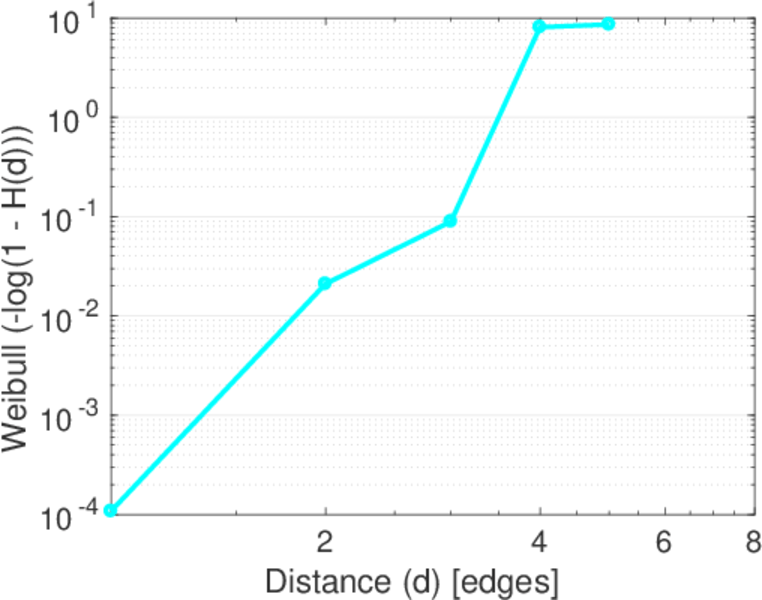
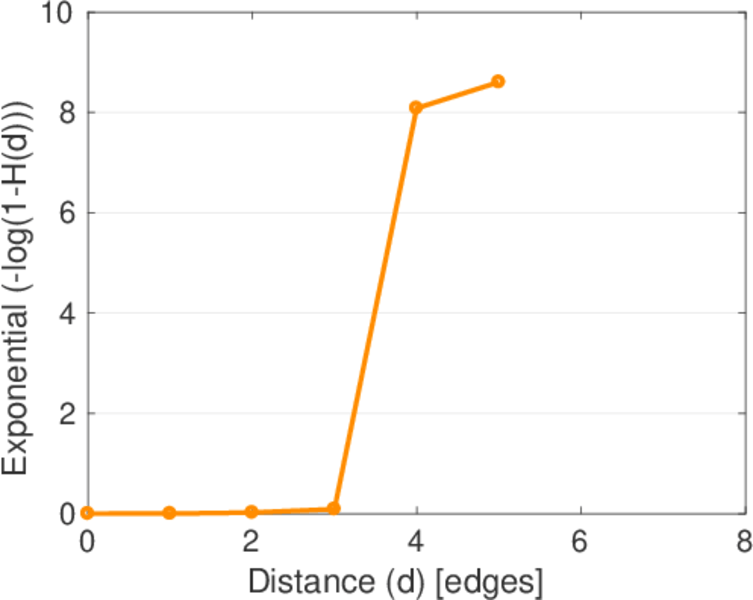
| Diameter | δ = | 6
|
| 50-Percentile effective diameter | δ0.5 = | 3.453 54
|
| 90-Percentile effective diameter | δ0.9 = | 3.890 98
|
| Median distance | δM = | 4
|
| Mean distance | δm = | 3.894 33
|
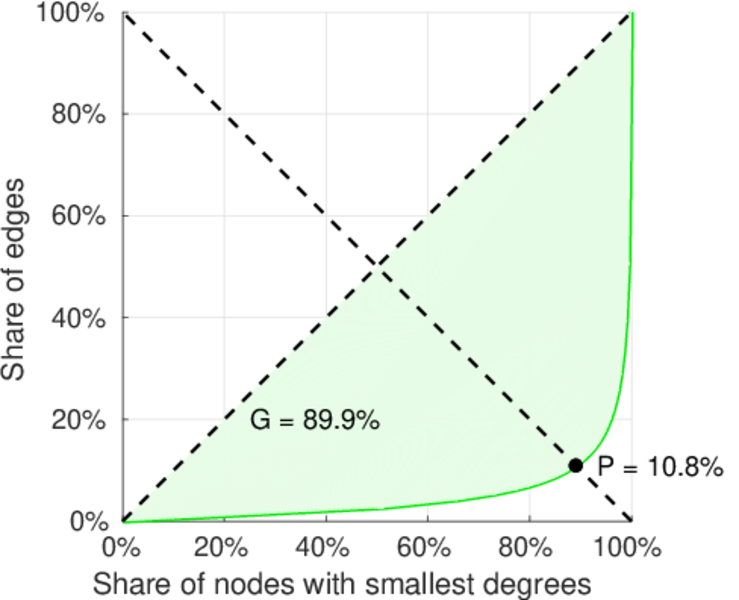
| Gini coefficient | G = | 0.938 415
|
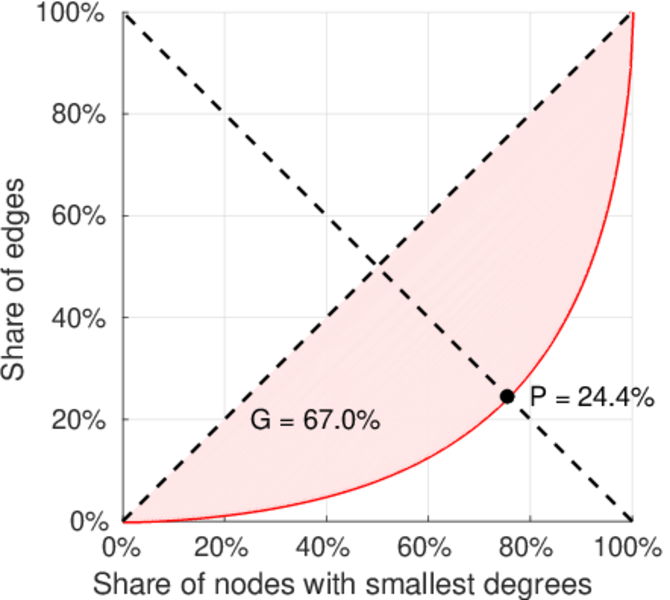
| Balanced inequality ratio | P = | 0.074 570 9
|
| Left balanced inequality ratio | P1 = | 0.243 679
|
| Right balanced inequality ratio | P2 = | 0.107 938
|
| Relative edge distribution entropy | Her = | 0.789 169
|
| Power law exponent | γ = | 2.223 00
|
| Tail power law exponent | γt = | 1.641 00
|
| Tail power law exponent with p | γ3 = | 1.641 00
|
| p-value | p = | 0.000 00
|
| Left tail power law exponent with p | γ3,1 = | 1.691 00
|
| Left p-value | p1 = | 0.000 00
|
| Right tail power law exponent with p | γ3,2 = | 1.761 00
|
| Right p-value | p2 = | 0.000 00
|
| Degree assortativity | ρ = | −0.157 788
|
| Degree assortativity p-value | pρ = | 0.000 00
|
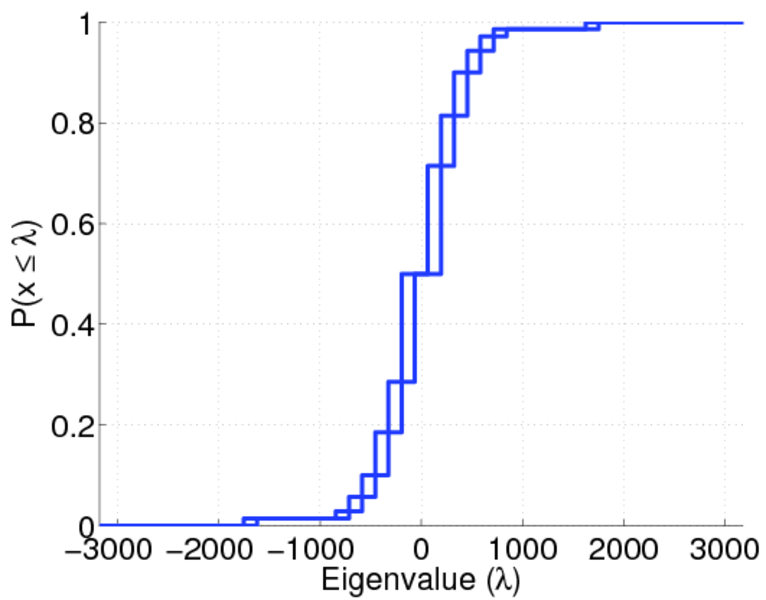
| Spectral norm | α = | 3,181.60
|
| Algebraic connectivity | a = | 0.522 814
|
| Spectral separation | |λ1[A] / λ2[A]| = | 1.047 85
|
| Controllability | C = | 193,946
|
| Relative controllability | Cr = | 0.939 889
|
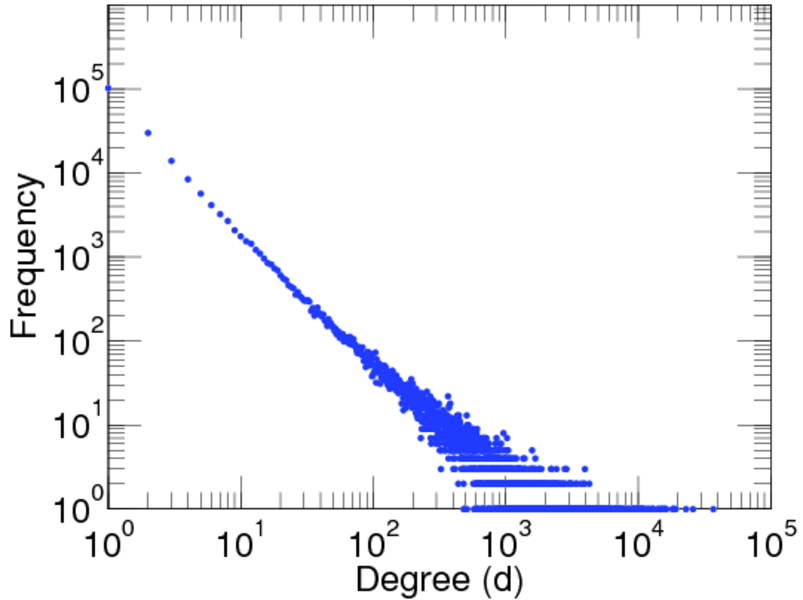
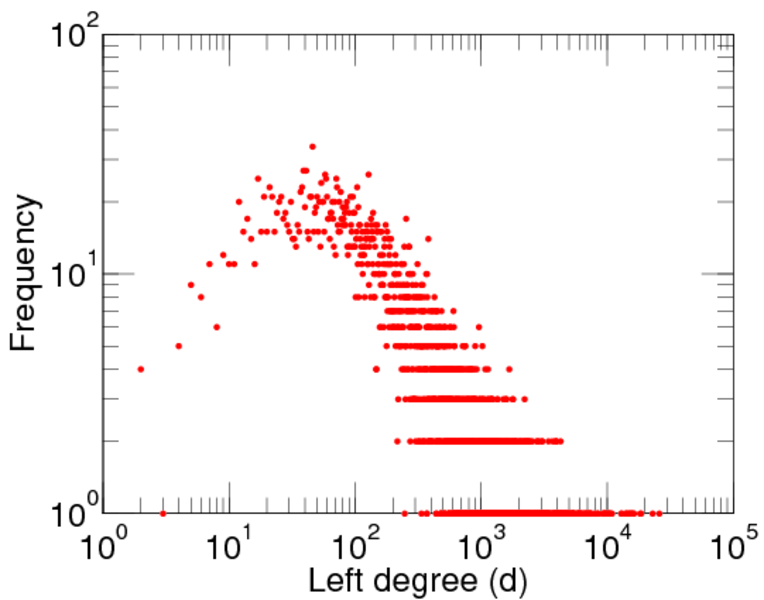
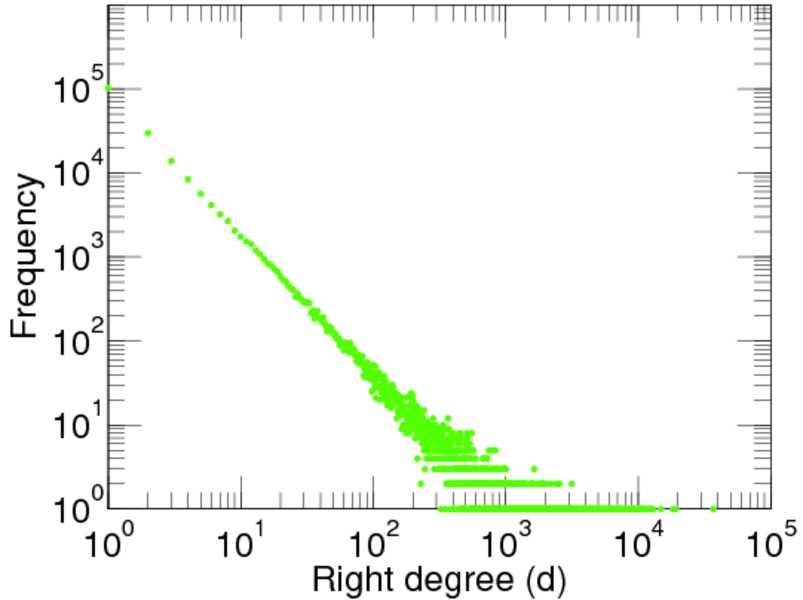
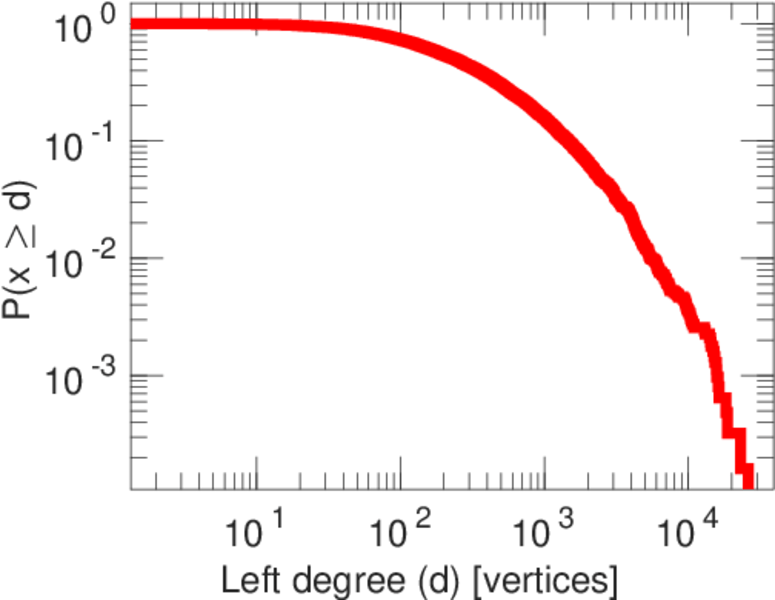
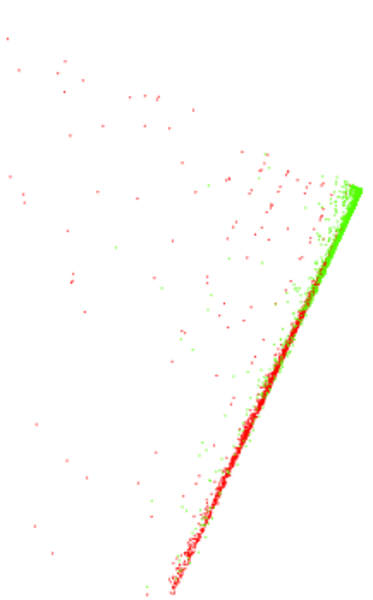
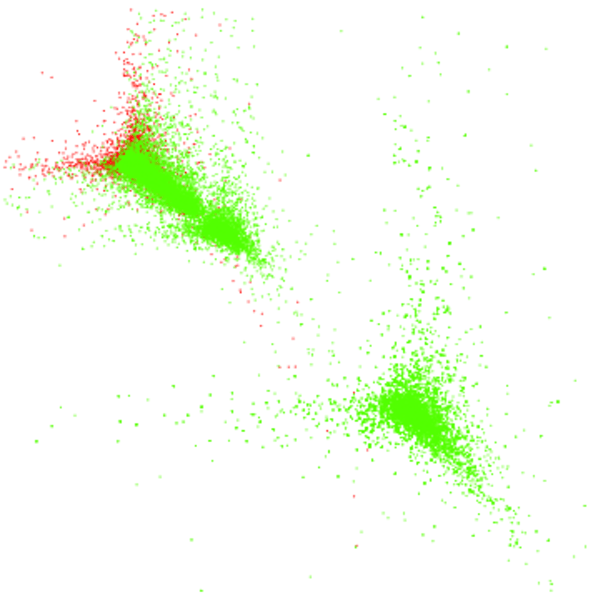
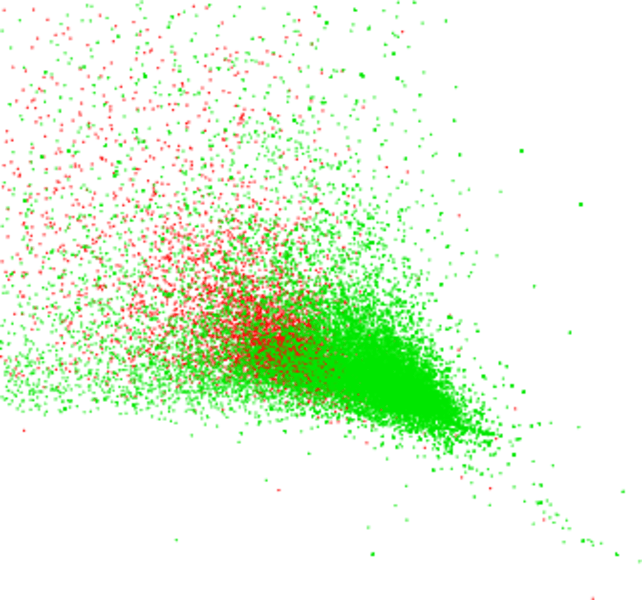
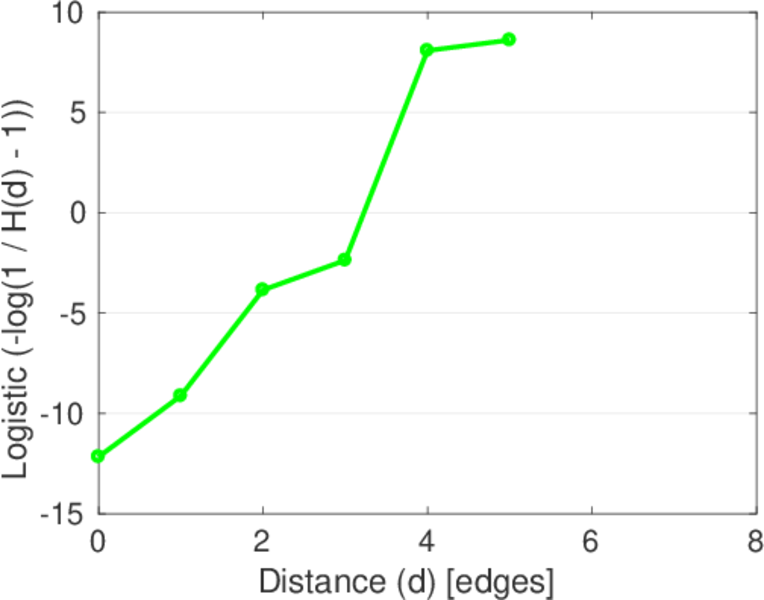
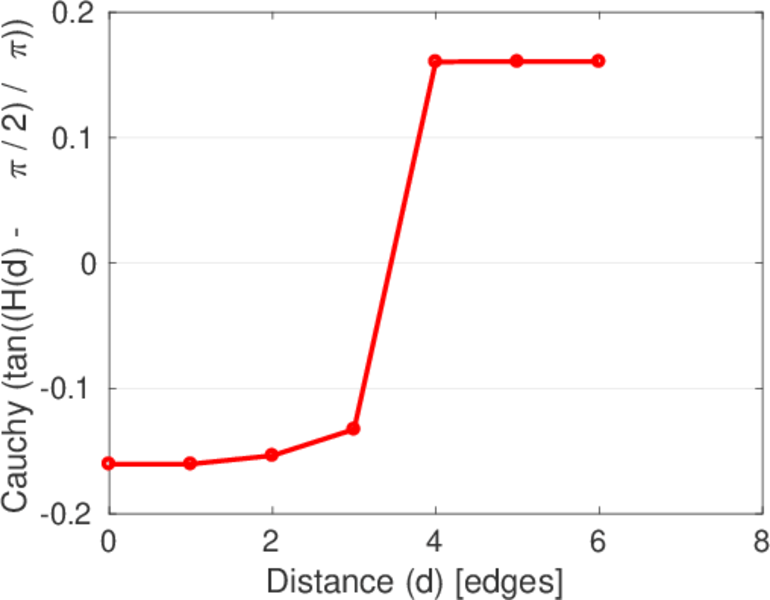
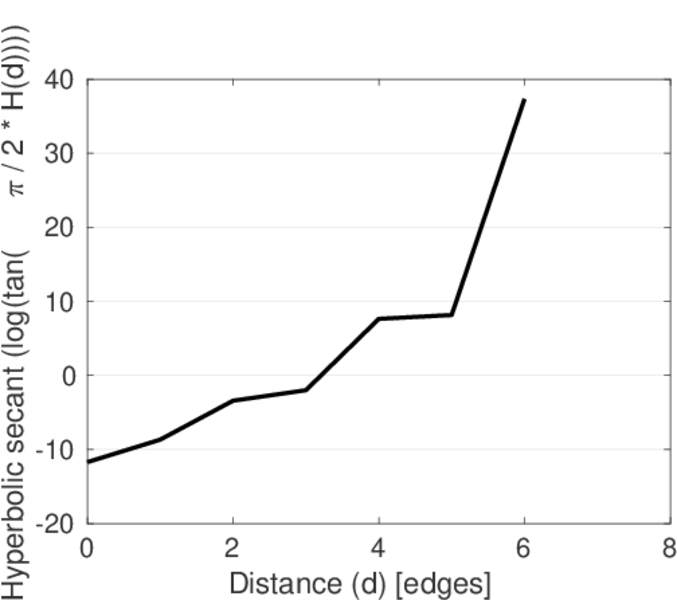
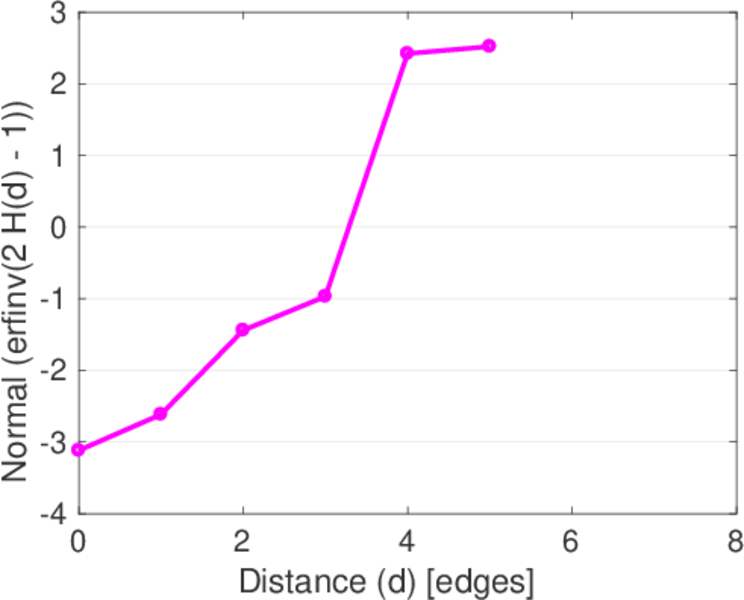
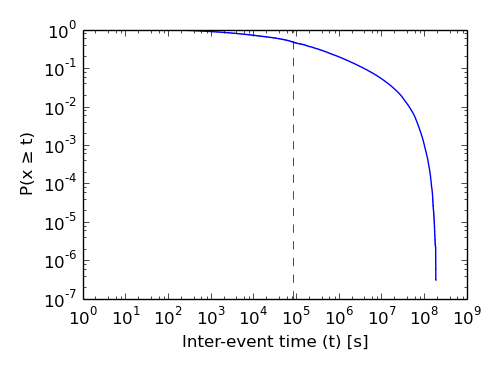
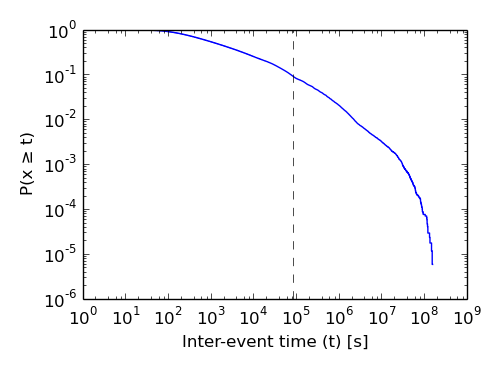
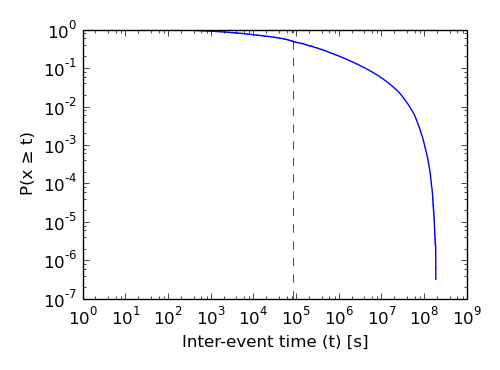
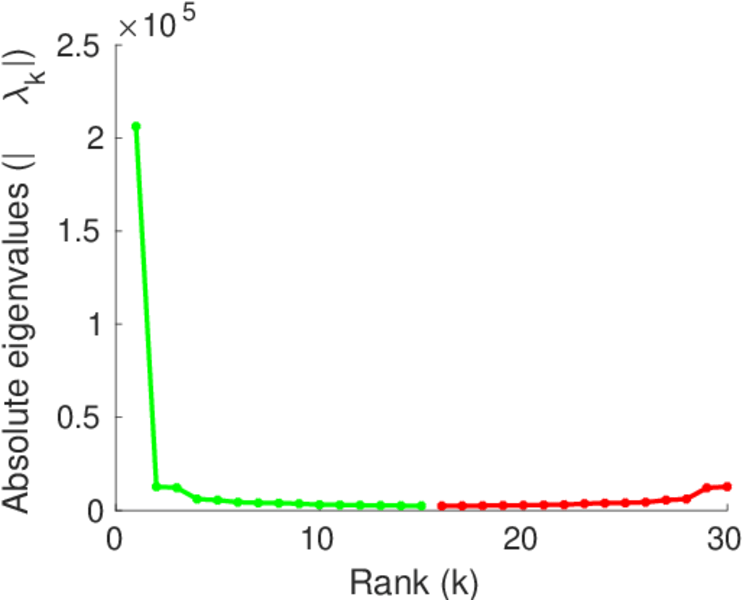
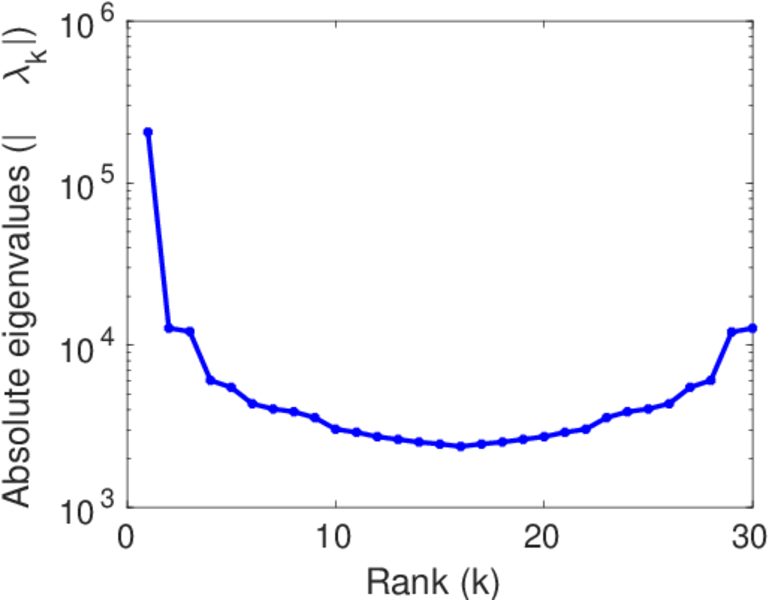
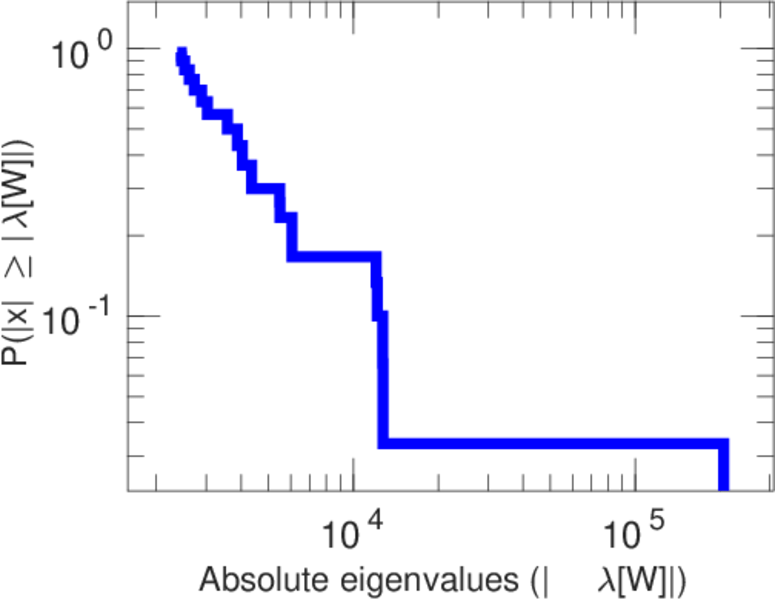
Plots


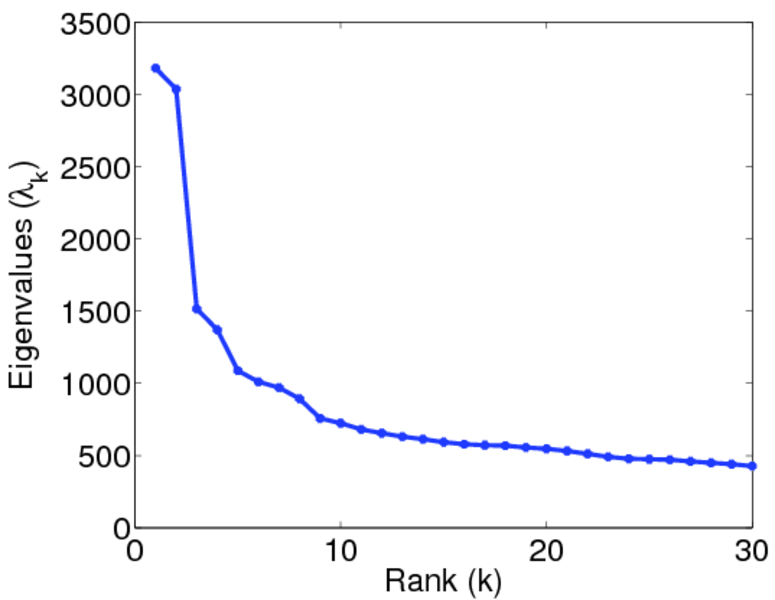
Matrix decompositions plots


Downloads
References
|
[1]
|
Jérôme Kunegis.
KONECT – The Koblenz Network Collection.
In Proc. Int. Conf. on World Wide Web Companion, pages
1343–1350, 2013.
[ http ]
|
|
[2]
|
Julia Preusse.
Analysis of the WebUni online student community.
Master's thesis, Otto-von-Guericke-Universität Magdeburg, 2010.
|
 KONECT ‣ Networks ‣
Buy Me a Coffee
KONECT ‣ Networks ‣
Buy Me a Coffee