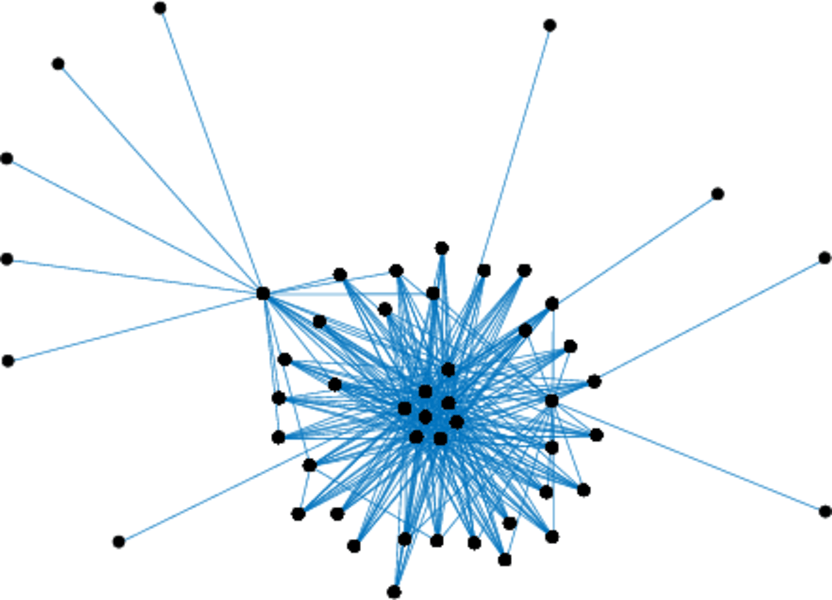
Wikipedia conflict
The edges in this network represent positive and negative conflicts between
users of the English Wikipedia, for example users involved in an edit-war. A
node represents a user and an edge represents a conflict between two users,
with the edge sign representing positive and negative interactions. An example
for a negative interaction would be when one user revert the edit of another
user.
Metadata
Statistics
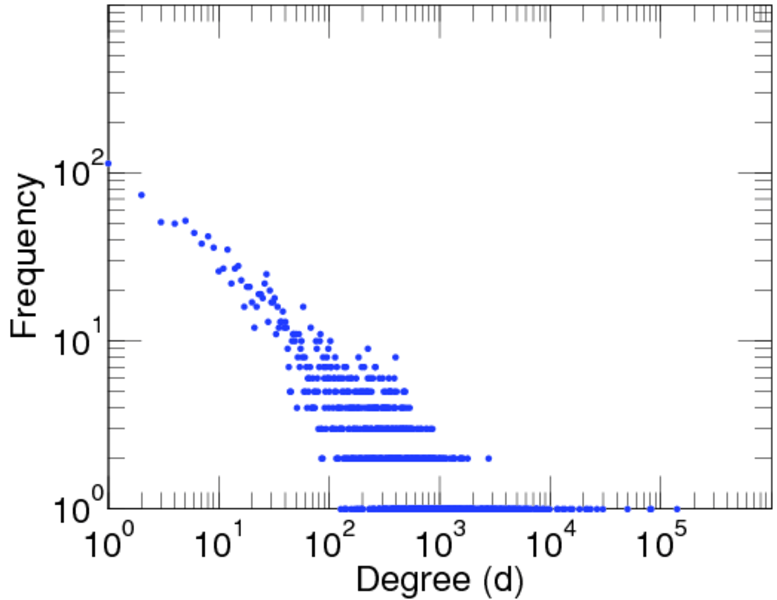
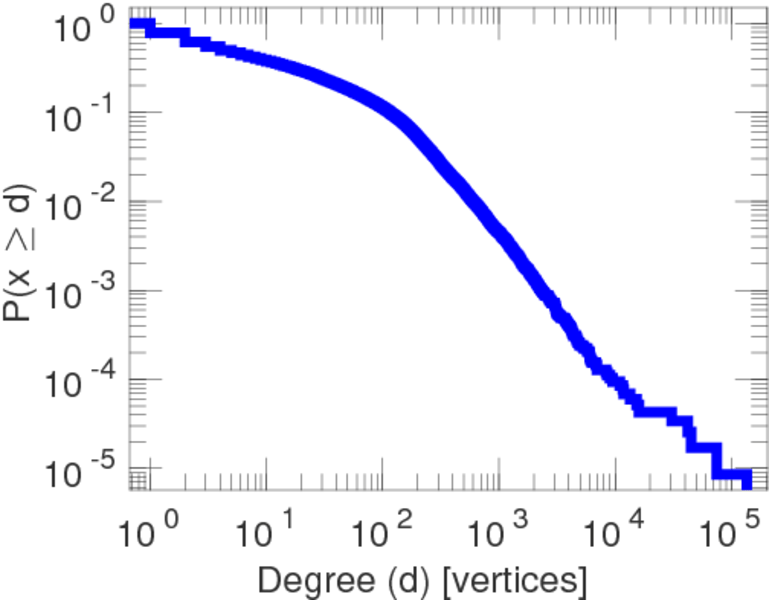
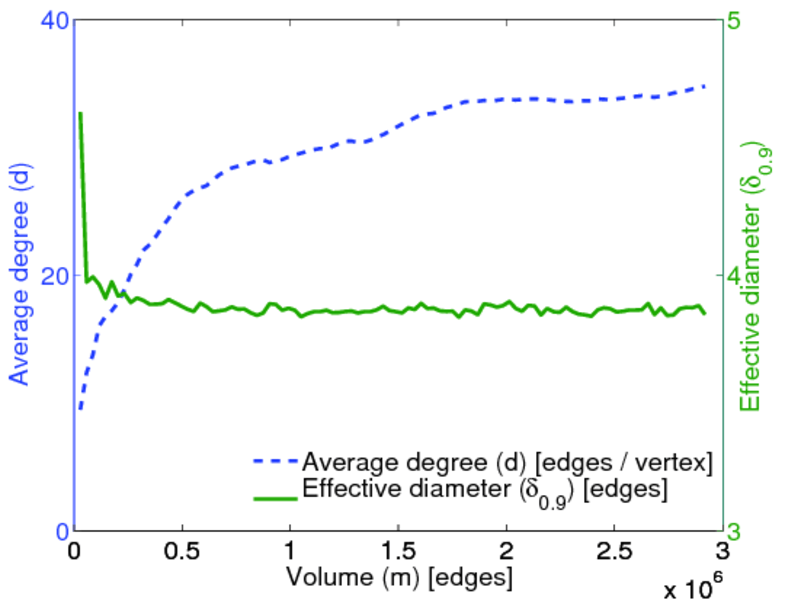
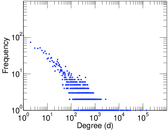
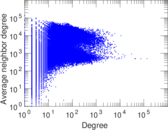
| Size | n = | 118,100
|
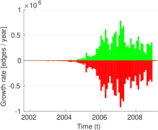
| Volume | m = | 2,917,785
|
| Unique edge count | m̿ = | 2,014,062
|
| Loop count | l = | 0
|
| Wedge count | s = | 1,394,925,925
|
| Claw count | z = | 3,157,737,873,756
|
| Triangle count | t = | 13,852,230
|
| Square count | q = | 7,362,075,281
|
| 4-Tour count | T4 = | 64,440,643,864
|
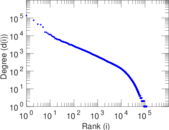
| Maximum degree | dmax = | 136,192
|
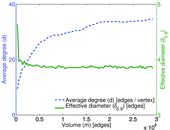
| Average degree | d = | 49.412 1
|
| Average edge multiplicity | m̃ = | 1.448 71
|
| Size of LCC | N = | 113,123
|
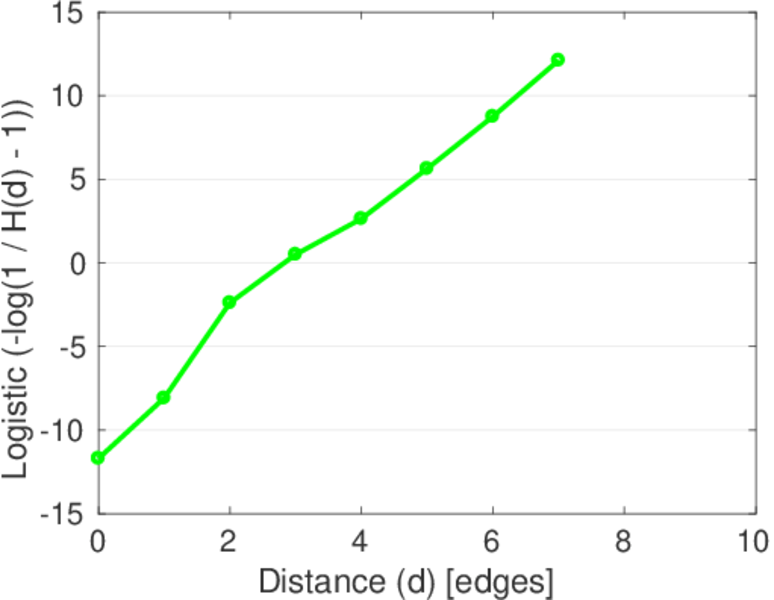
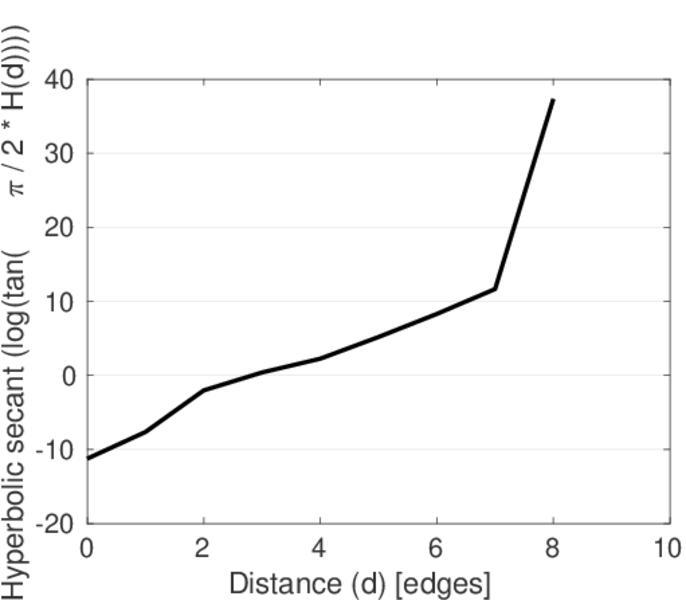
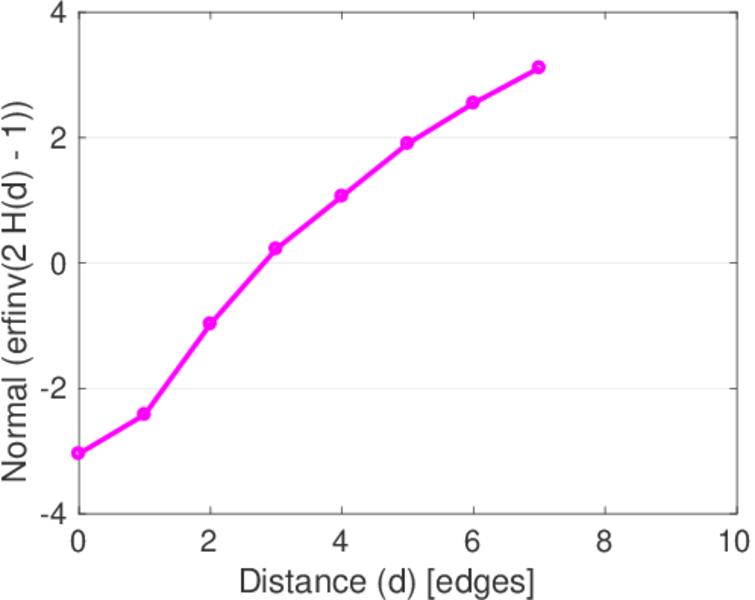
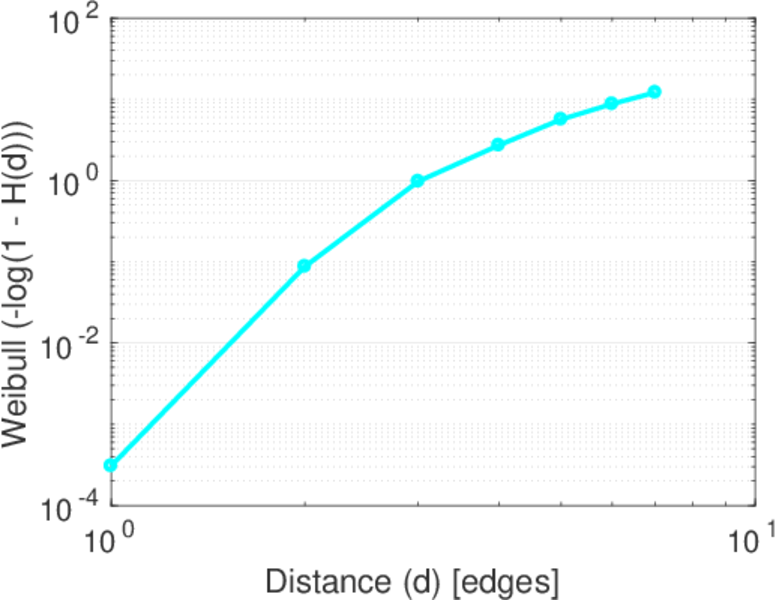
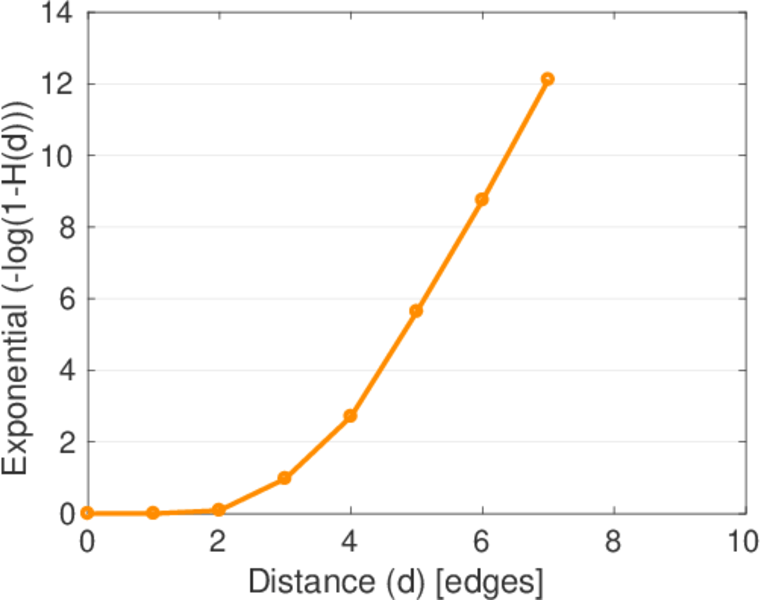
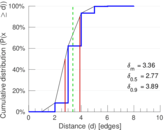
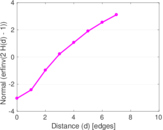
| Diameter | δ = | 10
|
| 50-Percentile effective diameter | δ0.5 = | 2.772 34
|
| 90-Percentile effective diameter | δ0.9 = | 3.892 43
|
| Median distance | δM = | 3
|
| Mean distance | δm = | 3.363 59
|
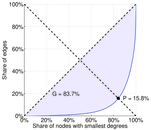
| Gini coefficient | G = | 0.809 687
|
| Balanced inequality ratio | P = | 0.167 106
|
| Relative edge distribution entropy | Her = | 0.864 542
|
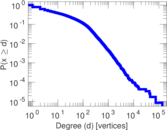
| Power law exponent | γ = | 1.534 62
|
| Tail power law exponent | γt = | 1.501 00
|
| Degree assortativity | ρ = | −0.065 011 7
|
| Degree assortativity p-value | pρ = | 0.000 00
|
| Clustering coefficient | c = | 0.029 791 3
|
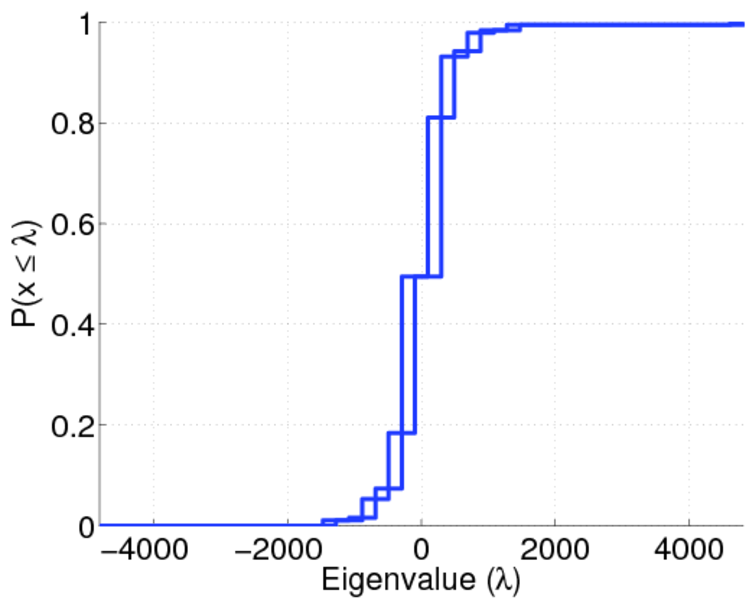
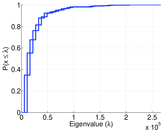
| Spectral norm | α = | 4,810.78
|
| Algebraic connectivity | a = | 0.018 347 8
|
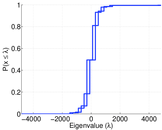
| Spectral separation | |λ1[A] / λ2[A]| = | 1.059 93
|
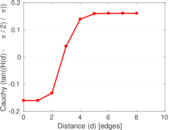
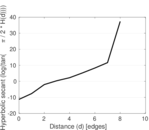
| Non-bipartivity | bA = | 0.260 217
|
| Normalized non-bipartivity | bN = | 0.074 872 1
|
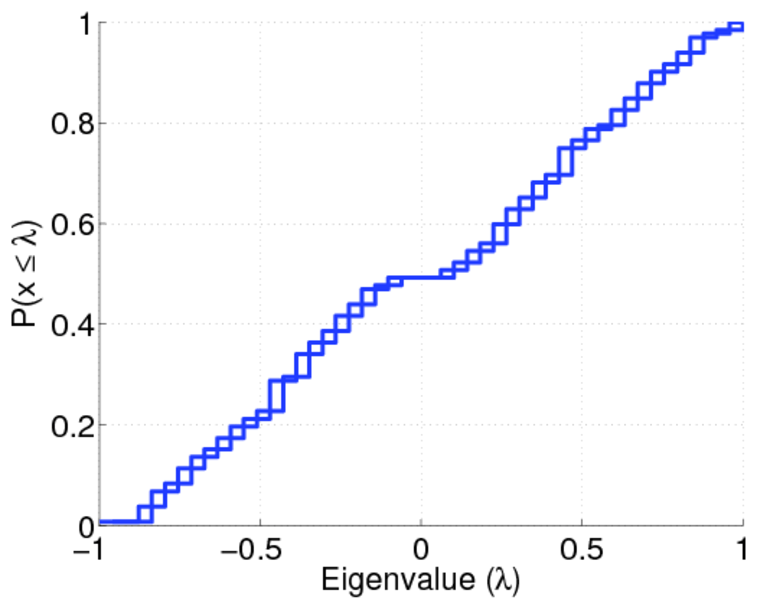
| Algebraic non-bipartivity | χ = | 0.120 114
|
| Spectral bipartite frustration | bK = | 0.000 836 416
|
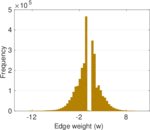
| Negativity | ζ = | 0.621 160
|
| Triadic conflict | τ = | 0.376 808
|
| Controllability | C = | 43,533
|
| Relative controllability | Cr = | 0.375 839
|
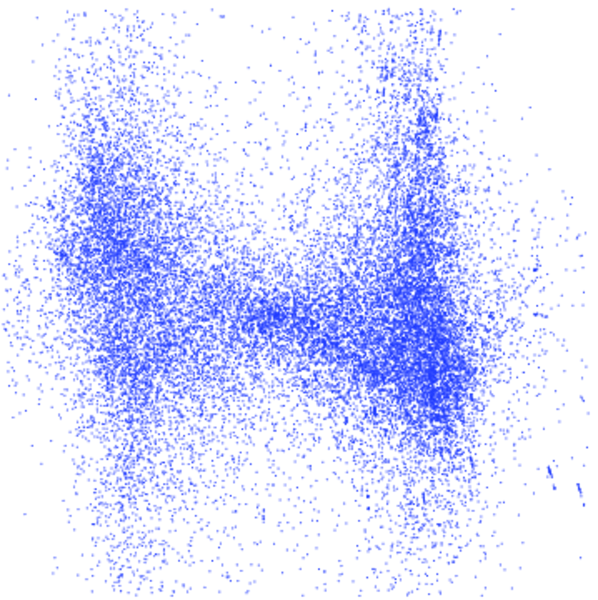
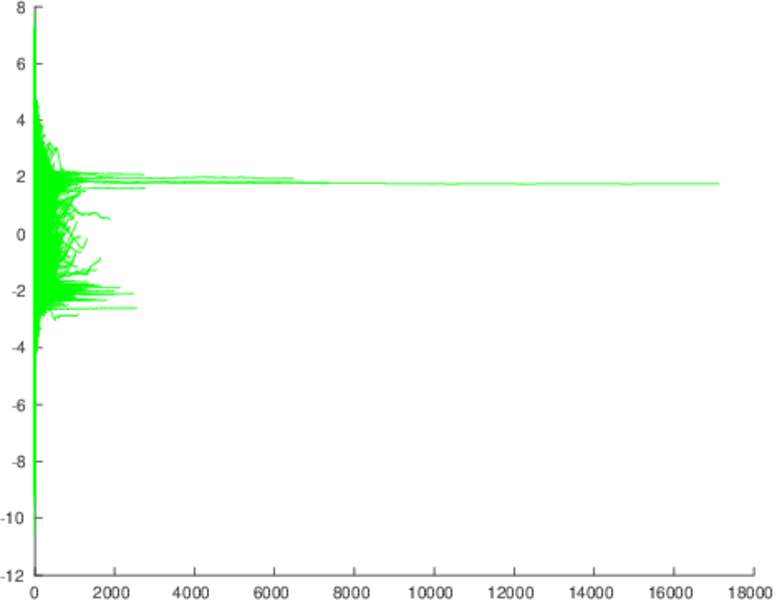
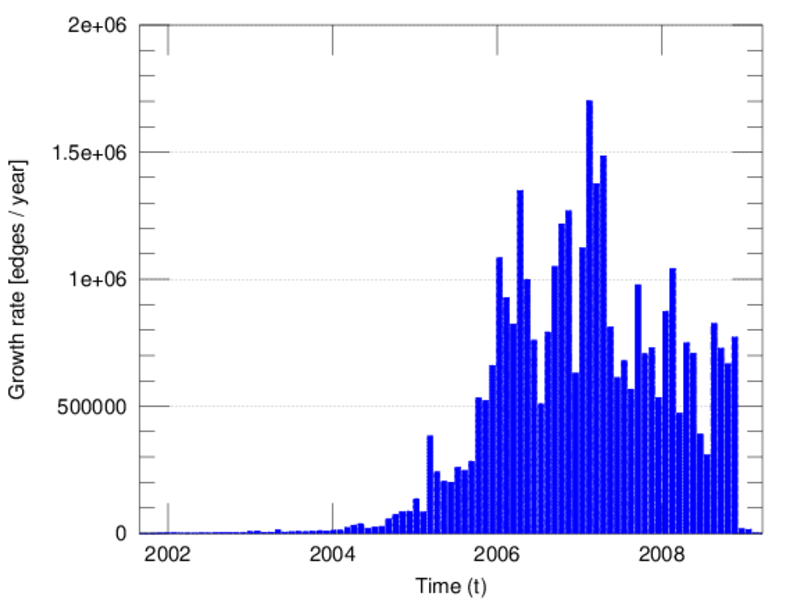
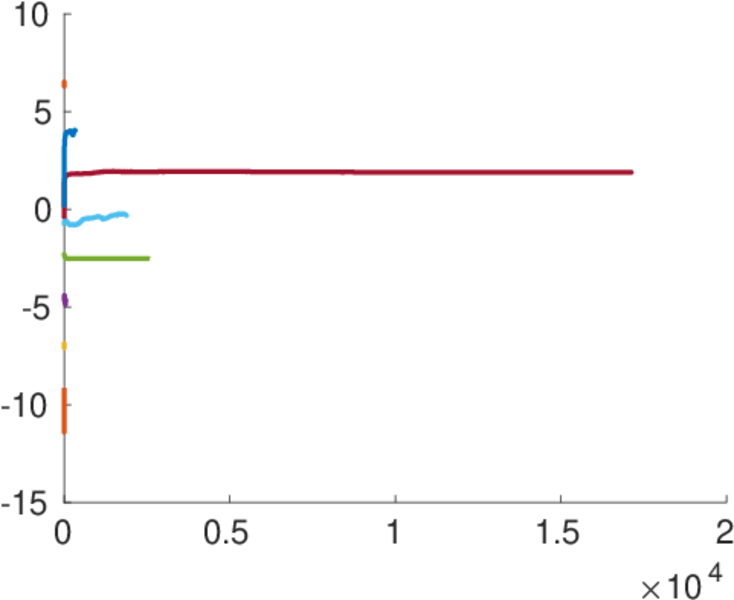
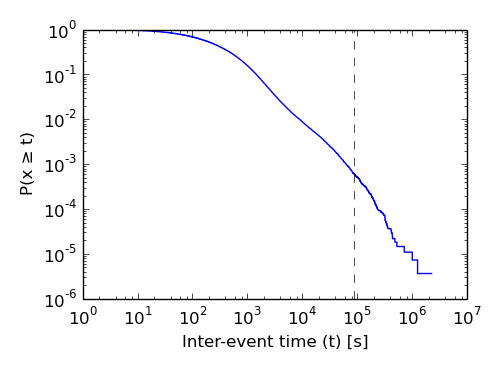
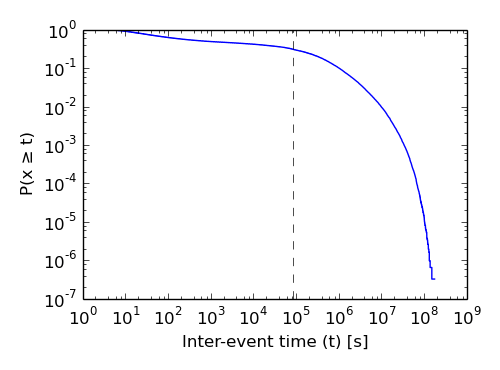
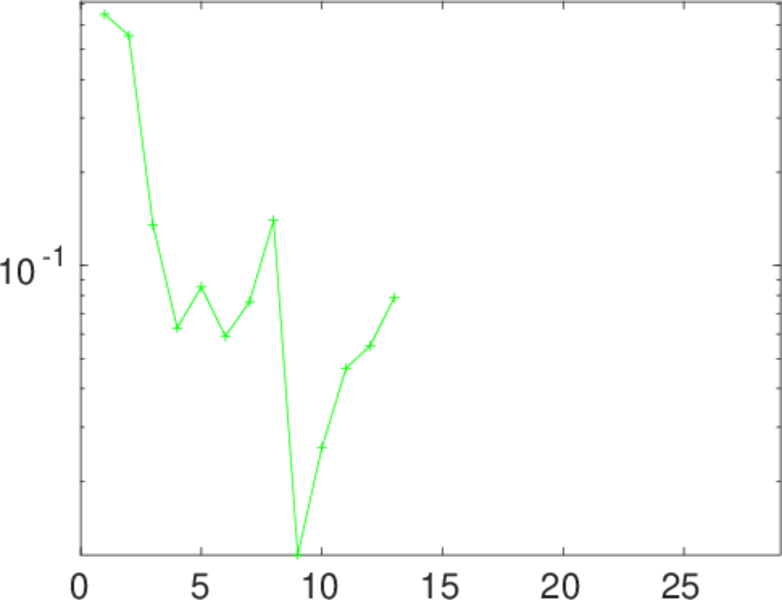
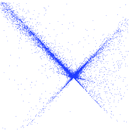
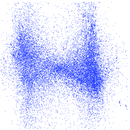
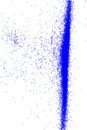
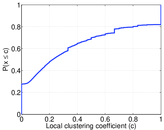
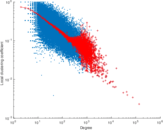
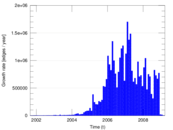
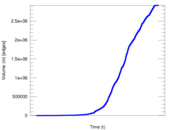
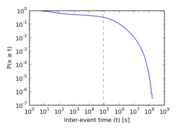
Plots


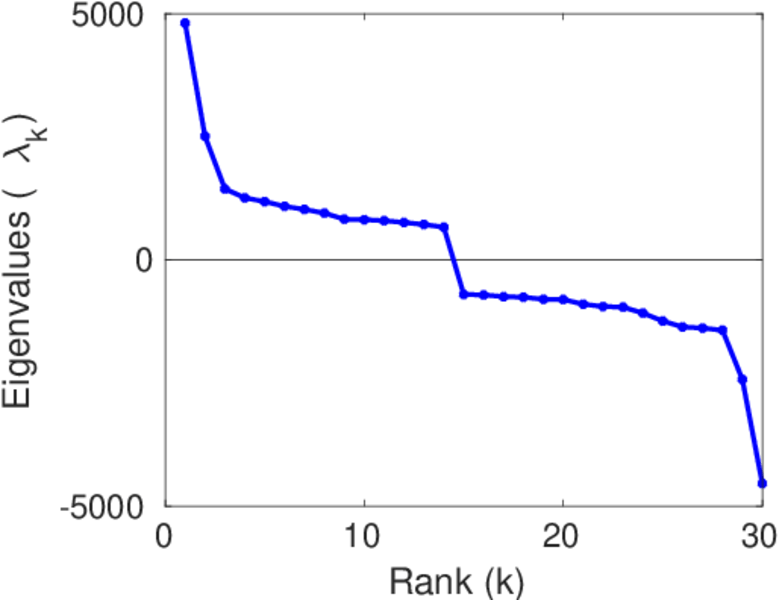
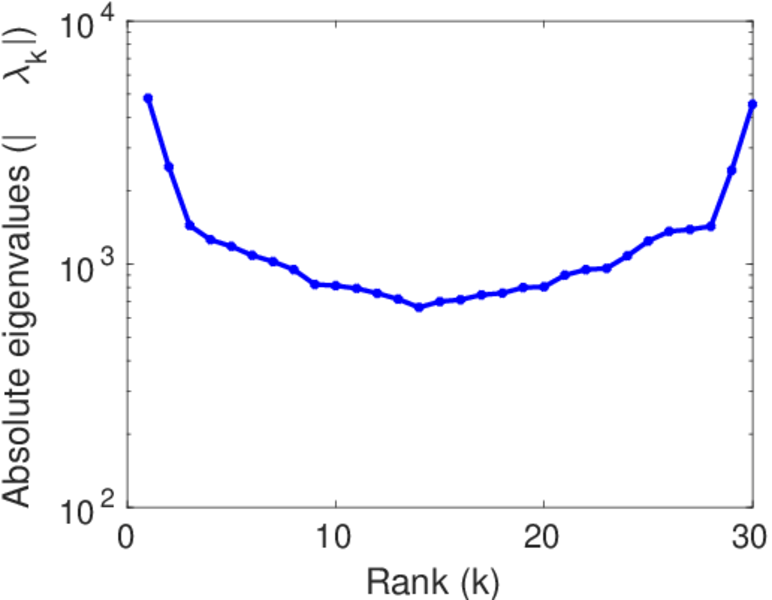
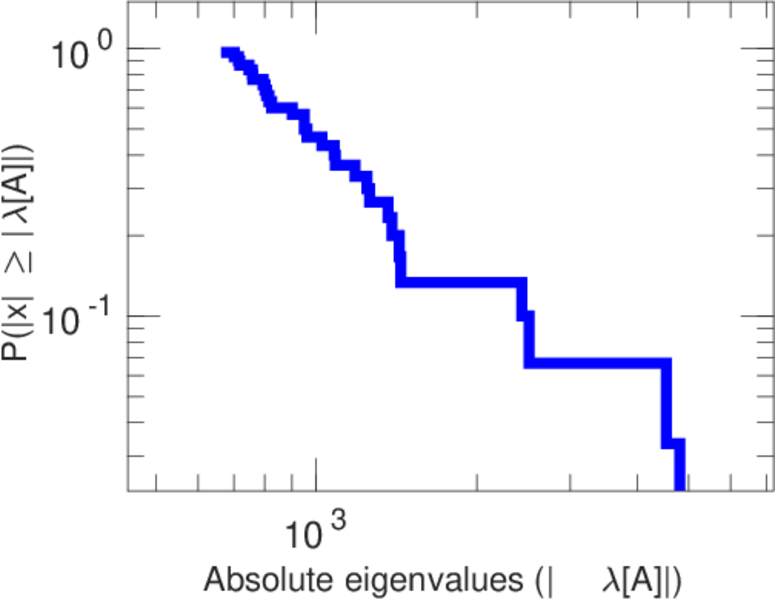
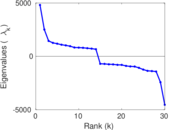
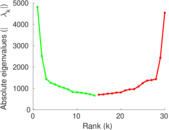
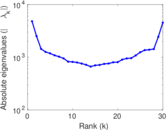
Matrix decompositions plots


Downloads
References
|
[1]
|
Jérôme Kunegis.
KONECT – The Koblenz Network Collection.
In Proc. Int. Conf. on World Wide Web Companion, pages
1343–1350, 2013.
[ http ]
|
|
[2]
|
Ulrik Brandes, Patrick Kenis, Jürgen Lerner, and Denise van Raaij.
Network analysis of collaboration structure in Wikipedia.
In Proc. Int. World Wide Web Conf., pages 731–740, 2009.
|
 KONECT ‣ Networks ‣
Buy Me a Coffee
KONECT ‣ Networks ‣
Buy Me a Coffee